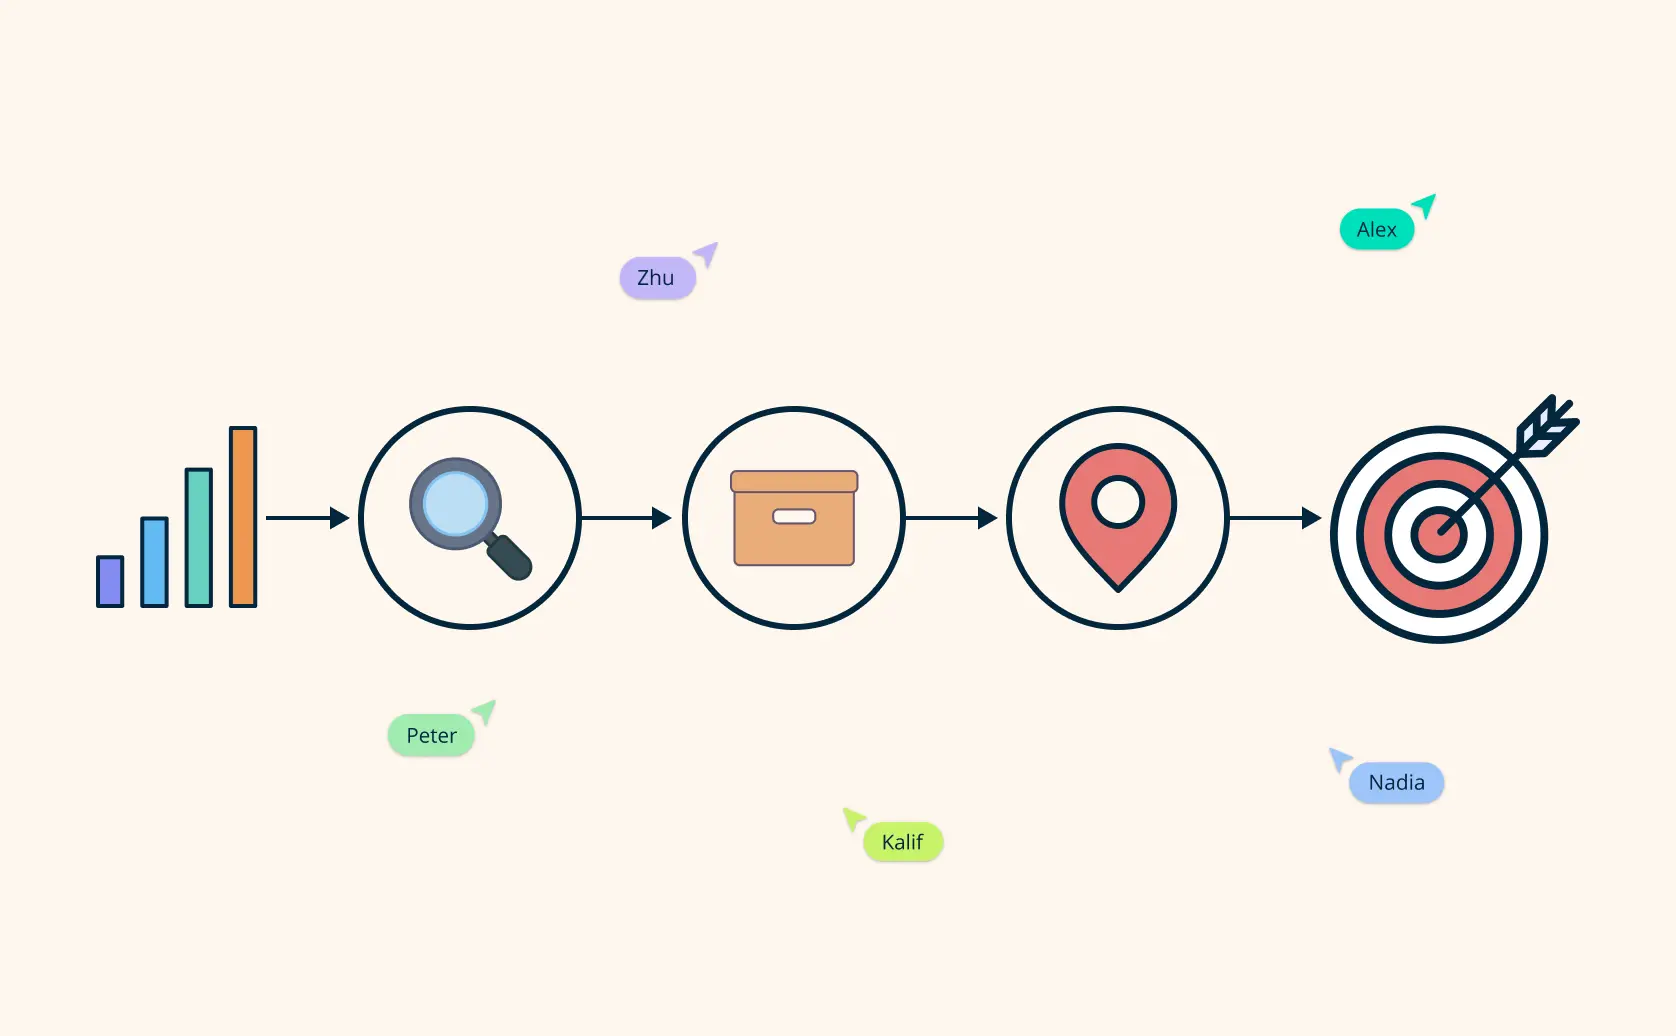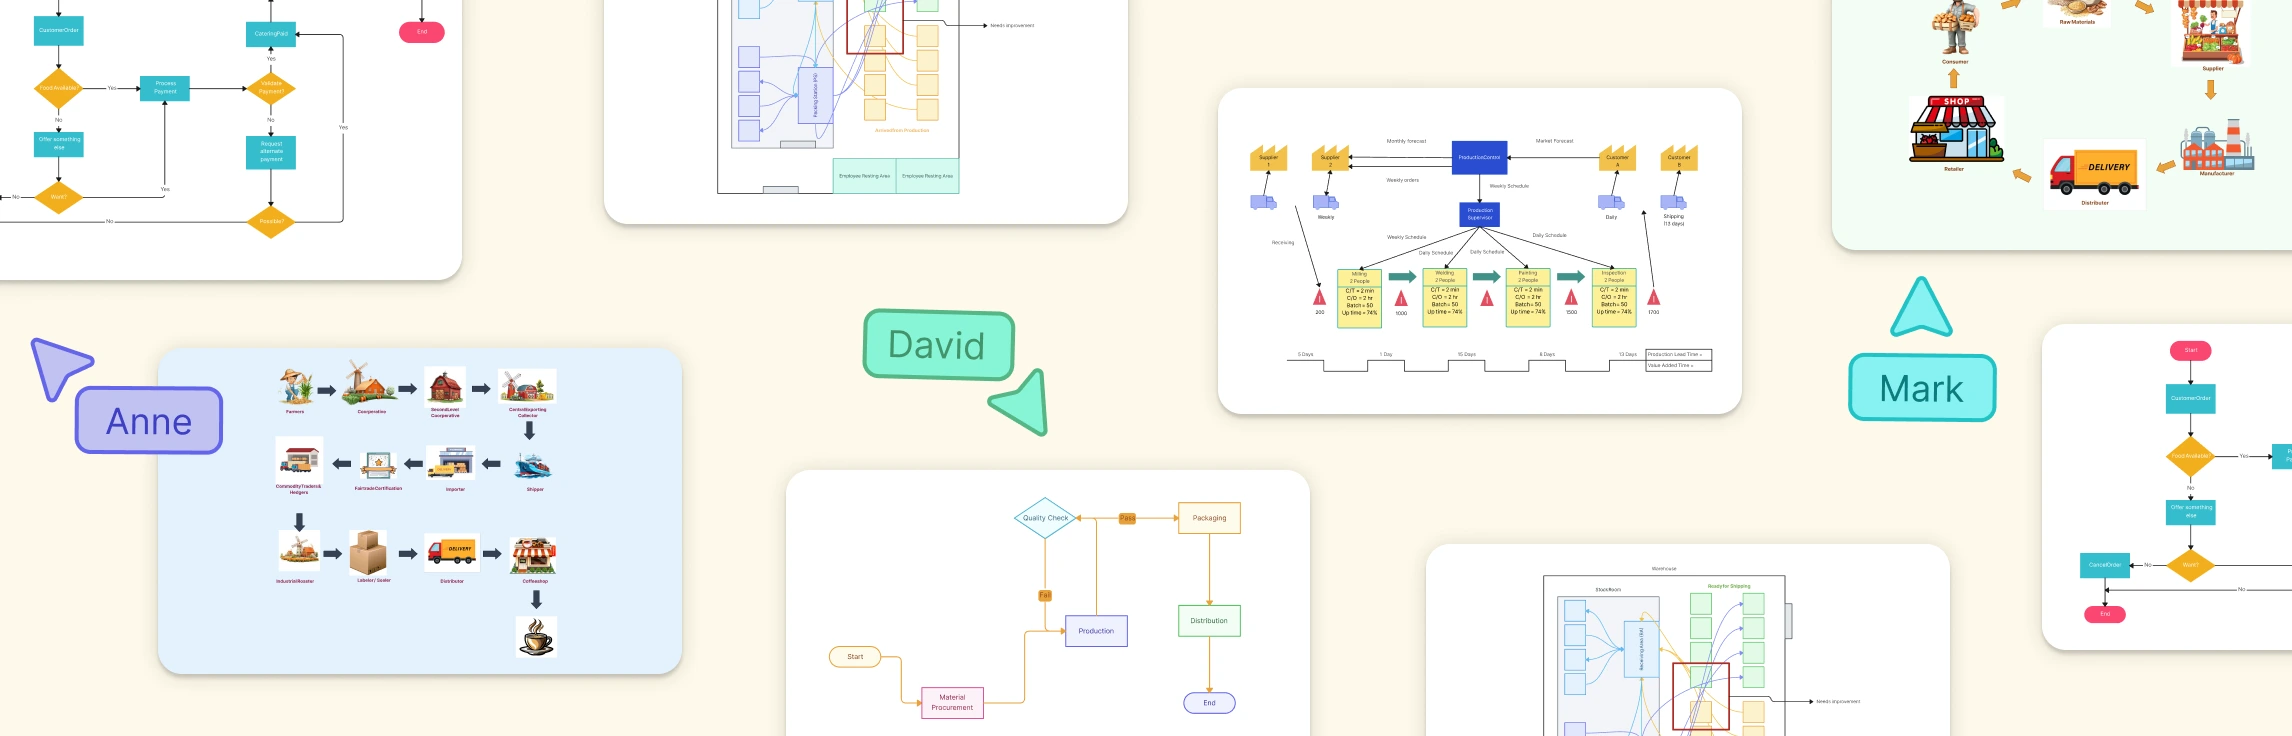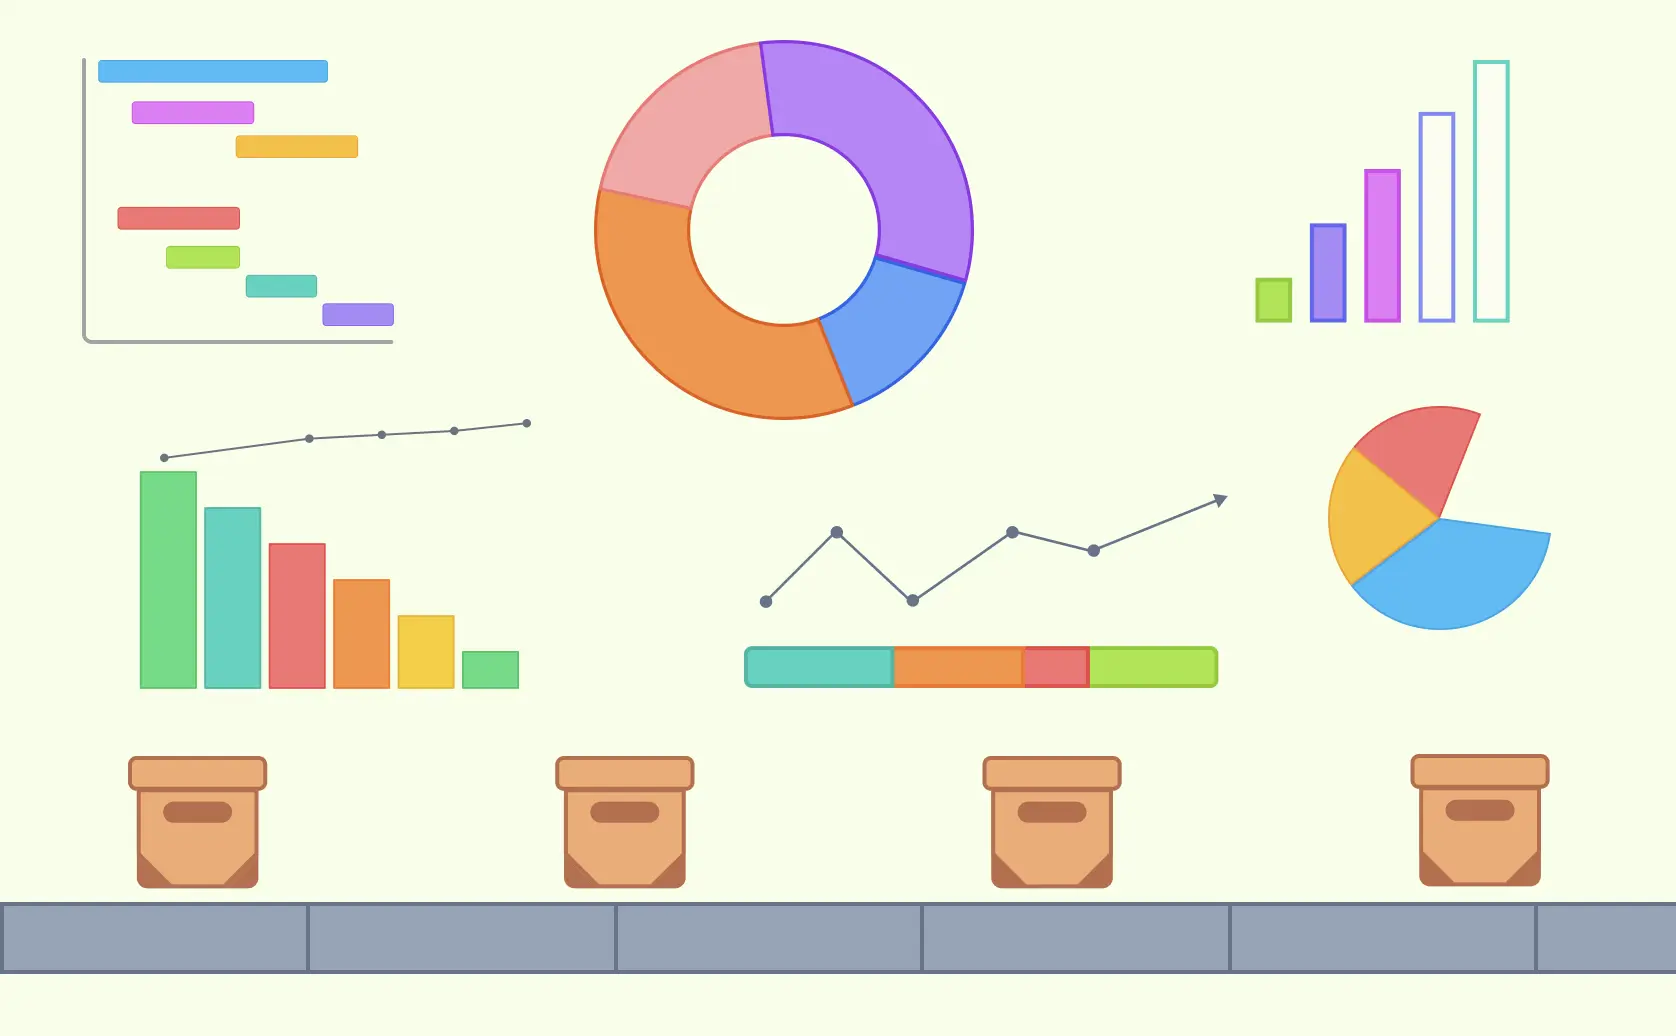
Supply chain visualization uses diagrams, maps, charts, and dashboards to make complex networks easier to understand. These visuals can show how products, information, money, and responsibilities move from suppliers through production and distribution to customers. When they are based on reliable operational data, they help teams investigate bottlenecks, dependencies, risks, and performance trends. This guide explains the main visualization techniques, what each one is suited to, and how teams can use them to support supply chain decisions.
What Is Supply Chain Visualization?
Supply chain visualization is the practice of representing supply chain structures, flows, and performance data visually. Depending on the question, a team might map the network of suppliers, manufacturers, distributors, and retailers; document a process; plot locations; or display selected metrics. Visuals make relationships and handoffs easier to discuss, but their accuracy and usefulness depend on the scope, source data, and update process behind them.
Supply chain diagrams provide a snapshot of stages such as procurement, production, distribution, and delivery. They help supply chain managers and logistics professionals locate dependencies and areas that warrant further investigation. A diagram alone does not diagnose a cause or prove that a proposed change will improve performance; teams should review it alongside operational records and stakeholder input.


Why Supply Chain Visualization Matters
Supply chains span multiple organizations, systems, locations, and handoffs, so it can be difficult to understand how a disruption in one area affects the rest. Visualization gives stakeholders a common reference for discussing those relationships. Static maps document structure and process, while dashboards can show current metrics only when they are connected to reliable, sufficiently up-to-date data. Used together with analysis and operational expertise, these views support risk reviews, inventory discussions, supplier assessment, and cross-functional planning.
1. Identify Bottlenecks
Delays can occur because of capacity constraints, resource shortages, process design, or unexpected disruptions. A process map or performance view can help teams locate where slowdowns appear, but further analysis is needed to determine the cause. For example, supplier lead-time data may reveal a recurring delay that procurement teams can investigate before deciding how to respond.
2. Enhance Collaboration
Clear, well-structured diagrams give procurement, production, logistics, and other stakeholders a shared view of the supply chain. Teams can clarify responsibilities, examine handoffs, and record assumptions or exceptions in context. The visual does not create alignment by itself, but it gives participants a common artifact to review and maintain.
3. Streamline Processes
Mapping the supply chain allows teams to examine steps from sourcing materials to delivering products. The map may reveal duplicated activity, unclear decision points, or repeated handoffs that deserve analysis. Teams can then assess proposed changes against cost, service, control, and risk requirements instead of assuming that removing a visible step will improve the overall process.
4. Improve Forecasting
Charts and dashboards can make historical demand, seasonality, inventory, and forecast outputs easier to interpret. Forecast accuracy, however, comes from the underlying data, assumptions, and forecasting method rather than the visualization itself. A useful view should distinguish actuals from forecasts and show the time period, units, and source so planners can interpret patterns responsibly.
5. Logistics Design
Geographic maps and network diagrams can show facilities, lanes, transport modes, and delivery regions. They help teams compare route options and identify dependencies, but traffic-aware routing, vehicle-capacity planning, and route optimization require appropriate logistics data and specialist planning tools. The visualization should communicate the selected design and the constraints behind it rather than imply that a diagram calculates the optimal route.
Supply chain visualization is most useful when each view is tied to a clear decision and maintained by an accountable owner. It can support bottleneck analysis, collaboration, process review, forecasting discussions, and logistics planning, while the underlying systems and subject-matter experts provide the operational evidence.
How Simple Tools Enhance Supply Chain Visualization
Using tools like process flow maps and other diagramming techniques, teams can visualize complex supply chain systems clearly and intuitively. Here’s how these tools, which can be created on platforms like Creately, aid in supply chain visualization:
1. Process Flow Maps
Process flow maps break down the steps in the supply chain, helping teams see how materials progress through production, storage, and distribution to the end customer. With Creately, teams can map steps, decisions, owners, systems, and handoffs in one visual context. The map helps participants locate potential delays or duplication for investigation; it does not automatically determine which activity should change.
2. Network Diagrams
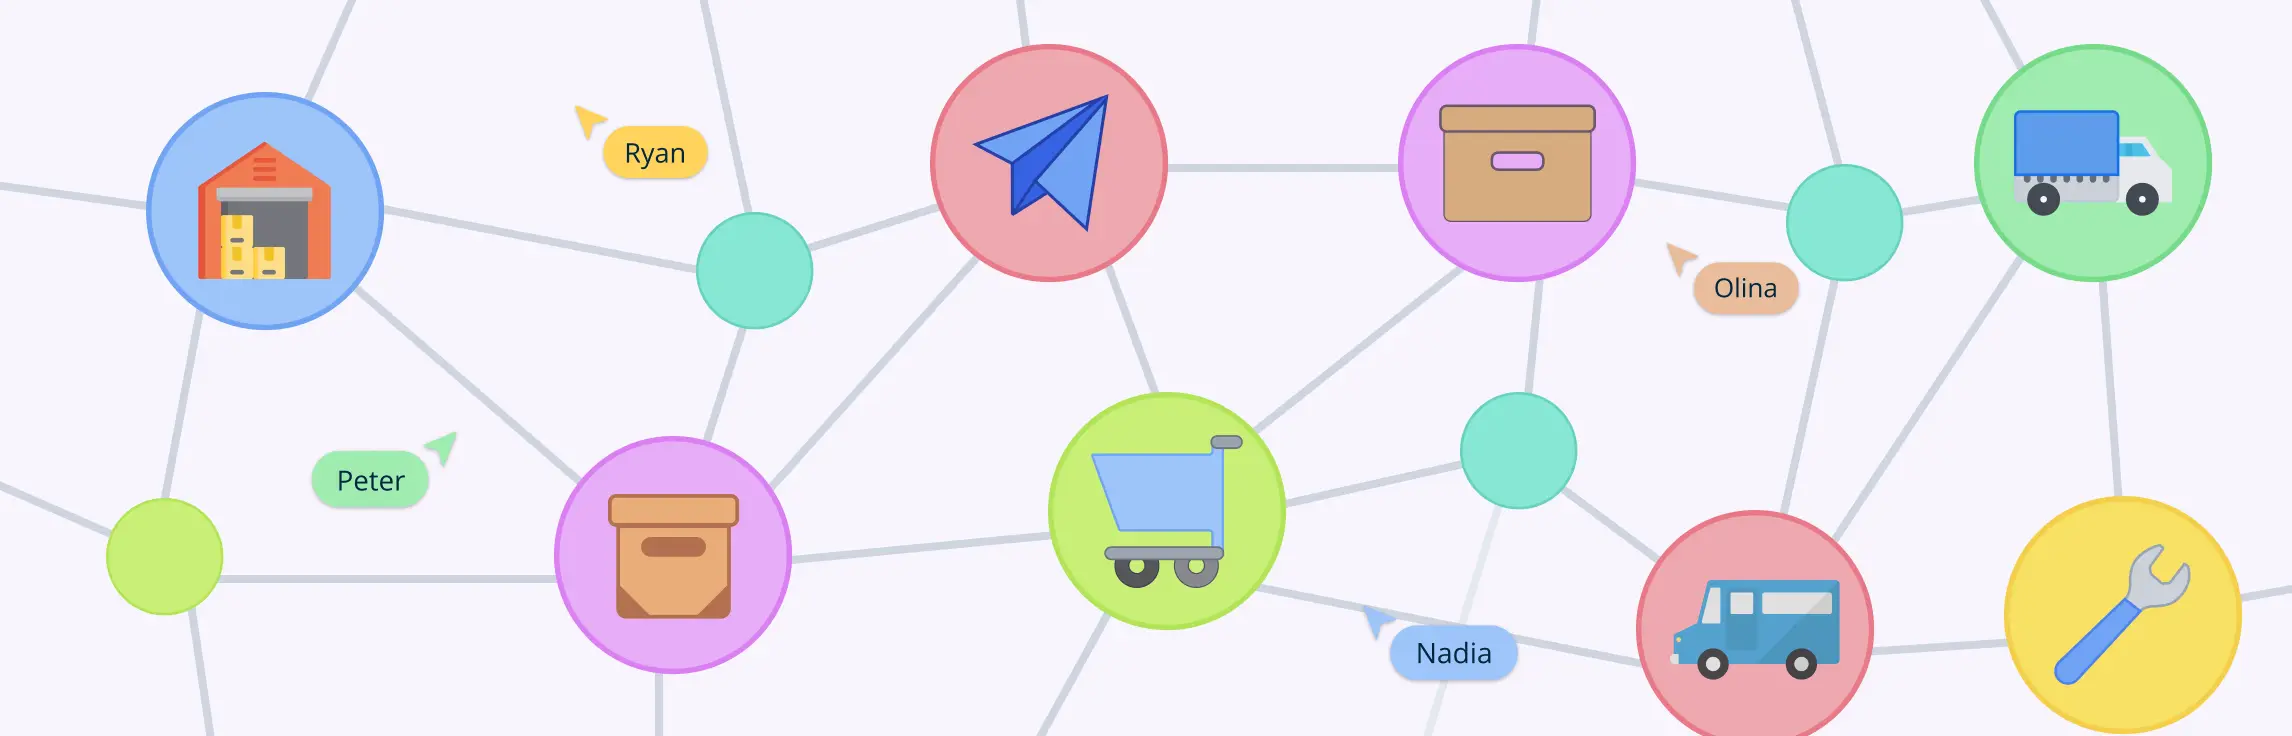
Network diagrams visualize relationships between suppliers, manufacturers, distribution centers, and other participants. Mapping these connections helps teams identify dependencies and discuss how a supplier change or disruption could affect connected nodes. Scenario assumptions and impact assessments should be recorded and validated rather than inferred from the network structure alone.
3. Heat Maps
Heat maps use color to represent the relative intensity of a selected measure, such as demand, cost, capacity utilization, or delivery time. They help teams compare areas and identify outliers for investigation. Always include a legend, time period, units, and source because color without context can be misleading.
4. Geographic Maps
Geographic maps show supplier locations, warehouses, distribution centers, routes, and regions. They help planners understand geographic coverage and identify areas that may be exposed to delay or disruption. Route optimization and inventory balancing still require relevant travel, capacity, demand, and service-level data.
5. Sequence Diagrams
Sequence diagrams show time-ordered interactions between participants or systems. They can be useful when the question concerns messages between an ordering system, warehouse system, carrier, and customer. For operational activities and decisions, a process map or swimlane diagram is usually clearer; use a sequence diagram when message order is the main focus.

6. Dashboards
Dashboards consolidate selected key performance indicators (KPIs), such as order-fulfillment rate, lead time, and inventory level. Their freshness depends on how the underlying data is supplied and updated. Creately can organize visual context and supporting information in a shared workspace, but it should not be described as a live operational dashboard unless the required data connection and refresh behavior have been verified for that use case.
7. Sankey Diagrams
Sankey diagrams show flows whose width is proportional to a quantity, such as material, energy, or cost. They help viewers compare where resources enter, move through, or leave a system. The diagram can highlight large losses or concentrations for investigation, provided the quantities use consistent units and a clearly defined boundary.

8. Control Charts
Control charts plot process data over time against a center line and statistically calculated control limits. In a supply chain context, they can help distinguish common-cause variation from signals that warrant investigation in measures such as delivery time or production output. Control limits are not the same as specification limits, and an out-of-control signal should prompt analysis rather than an automatic corrective action.

9. Gantt Charts
Gantt charts are time-based tools for planning and tracking project activities such as a supplier transition, facility launch, or distribution-network change. They show task dates, durations, dependencies, milestones, and owners, helping teams identify schedule overlap and critical coordination points. They support project planning but do not represent continuous material flow or guarantee on-time completion.

10. Critical Path Analysis
Critical path analysis (CPA) identifies the longest-duration path through a network of dependent project activities and, given the stated estimates and dependencies, the earliest possible project completion time. It helps teams locate tasks with no scheduling flexibility and assess the effect of delay. CPA is useful for supply chain projects, but it is not a method for analyzing the ongoing performance of the supply chain itself.

Applications of Supply Chain Visualization
Supply chain visualization is a versatile tool that can be applied across various stages of the supply chain, providing organizations with valuable insights and improving operational efficiency. Here are some key applications of supply chain visualization:
1. Mapping the Supply Chain Network
One application is mapping the supply chain network at a level appropriate to the decision. A map can show the flow of materials, information, and money among suppliers, manufacturers, logistics providers, and customers. It helps teams identify important nodes, dependencies, and potential vulnerabilities for further assessment. Large networks may need separate high-level and detailed views rather than a single diagram claiming complete coverage.

2. Inventory Management
Inventory visualizations can compare stock levels, movement, turnover, or coverage across locations when current data is available. Planners can use those views alongside forecasts, lead times, service targets, and replenishment rules when making inventory decisions. A visual does not itself rebalance stock or prevent shortages and excess; those outcomes depend on the quality of the data and the actions taken.

3. Performance Monitoring and Reporting
Visualizations can present KPIs such as order-fulfillment rate, lead time, transportation cost, and supplier performance in a consistent format. Decision-makers can use trends and exceptions to decide where deeper analysis is needed. Documenting metric definitions, owners, sources, and refresh dates makes recurring reporting more transparent and accountable.
4. Risk Management
Supply chain maps can support risk assessment by showing where natural hazards, supplier failures, geopolitical events, or other disruptions may affect nodes and flows. Teams can connect identified risks with assumptions, owners, and contingency information, then review them as conditions change. The map supports preparedness but cannot predict disruptions or quantify their impact without appropriate risk data and analysis.

5. Scenario Planning and Simulation
Teams can create separate current-state and scenario views to compare possible changes in supplier location, production capacity, or transportation routes. These diagrams communicate assumptions and dependencies; they are not simulations unless a separate analytical model calculates the outcomes. Record the inputs and decision criteria for each scenario so reviewers understand what the comparison does and does not show.

6. Collaboration and Communication
A shared visualization gives suppliers, manufacturers, distributors, retailers, and internal teams a common reference for discussing the supply chain. Stakeholders can comment on assumptions and handoffs, while an accountable owner incorporates agreed updates. When sharing a map with external partners, apply the appropriate access controls and avoid exposing commercially sensitive information.
7. Customer Experience Enhancement
Supply chain visualization can help internal teams understand where order-status, availability, or delivery information originates and where communication handoffs occur. This may support better customer updates when it is paired with accurate operational data and service processes. Internal supply chain diagrams should not be treated as customer-facing tracking systems unless that experience has been designed and connected separately.
These applications serve different purposes, from documenting process and network structure to communicating metrics, risks, and project schedules. Choose the visual based on the decision, define its source data and owner, and review it often enough to keep the context reliable.
Helpful Resources
Use mind map online to visualize ideas and concepts for collaborative brainstorming, creative thinking, problem-solving, and so much more.
Create timelines for any event; track and analyze your team’s projects and tasks from start to finish with Creately’s Gantt chart maker.
Model your supply and demand data to anticipate future trends. Pinpoint inefficiencies and costs in processes on a single easily shareable workspace.
This Gantt chart tutorial will help you master the art of creating visual timelines for tasks and milestones
Supply Chain Visualization with Creately
With Creately’s supply chain mapping workspace, teams can build process maps, network diagrams, timelines, and other views on a shared canvas. They can use separate high-level and detailed diagrams to keep a complex network understandable rather than forcing every supplier, flow, and exception into one view.
Creately supports real-time collaboration and contextual comments so stakeholders can examine assumptions, responsibilities, handoffs, and proposed changes together. Teams can connect notes, links, files, and structured details such as owners or status to relevant visual elements. These capabilities keep the reasoning and supporting material close to the diagram without implying that Creately monitors the underlying operation automatically.
Assigning an owner and recording the source and review date helps each visualization remain accountable. The owner can incorporate agreed changes, use version history to understand revisions, and maintain linked process context as the supply chain changes. This creates living documentation, but teams must still verify operational values against their systems of record; automatic synchronization across every supply chain view should not be assumed.
Summary
Supply chain visualization makes complex networks, processes, performance measures, and dependencies easier to examine. The value comes from selecting the right visual, grounding it in reliable data, and using it to support a defined decision. Creately provides a shared workspace for building and reviewing these views while keeping relevant process context connected.
Treat each visualization as an owned operational reference rather than a one-time diagram. Stakeholders should review assumptions and handoffs, the owner should incorporate agreed updates, and teams should validate data against the appropriate source systems. This maintenance workflow helps the documentation stay useful as suppliers, routes, capacities, and service requirements change.
FAQs About Supply Chain Visualization
What is supply chain visualization, and how does it work?
Why is supply chain visualization important for businesses?
What are the key benefits of implementing supply chain visualization tools?
How can supply chain visualization improve inventory management?
What types of supply chain visualization techniques are commonly used?
Resources:
Basole, R.C., Bellamy, M.A. and Park, H. (2016). Visualization of Innovation in Global Supply Chain Networks. Decision Sciences, 48(2), pp.288–306. doi:www.doi.org/10.1111/deci.12213.
Khakpour, A., Colomo-Palacios, R. and Martini, A. (2021). Visual Analytics for Decision Support: A Supply Chain Perspective. IEEE Access, 9, pp.81326–81344. doi:www.doi.org/10.1109/access.2021.3085496.
Lou, C.X., Alessio Bonti, Prokofieva, M., Abdelrazek, M. and Kari (2020). Literature Review on Visualization in Supply Chain & Decision Making. 2020 24th International Conference Information Visualisation (IV), [online] 6, pp.746–750. doi:www.doi.org/10.1109/iv51561.2020.00019.