Yashodhara KeerthisenaTechnical Communication Specialist
Yashodhara Keerthisena is a Technical Communication Specialist at Creately, focusing on diagramming frameworks, technical diagramming, business workflow, and visual collaboration best practices. With a deep interest in structured thinking and process design, she turns complex concepts into actionable insights for teams and knowledge workers. She has 5+ years of experience in crafting content for various fields including SAAS, technology and marketing.
If you’ve ever tried to plan a department’s growth using three different spreadsheets, a stale slide deck, and a prayer, you know the frustration of “disconnected data.” It’s nearly impossible to make fast, confident decisions when your people strategy is buried in rows of text that don’t reflect your actual capacity. Read More
Ask any HR leader about “Audit Season,” and you’ll likely hear a story involving frantic spreadsheet reconciliations, broken reporting lines, and the sinking realization that last month’s org chart is already a relic. When your workforce is in constant motion, a static diagram isn’t just a nuisance—it’s a liability. This guide cuts through the noise to evaluate the best tools for HR audit org charts, focusing on platforms that transform your organizational data into a dynamic and secure HR audit org chart. Read More
The “audit panic” is a feeling every HR professional knows too well: that sudden, high-stakes request for a “clean” reporting structure, only for you to realize your current charts are scattered across outdated, broken spreadsheets. An effective HR audit org chart must serve as a living, data-rich system of record that proves your organizational governance is airtight. Read More
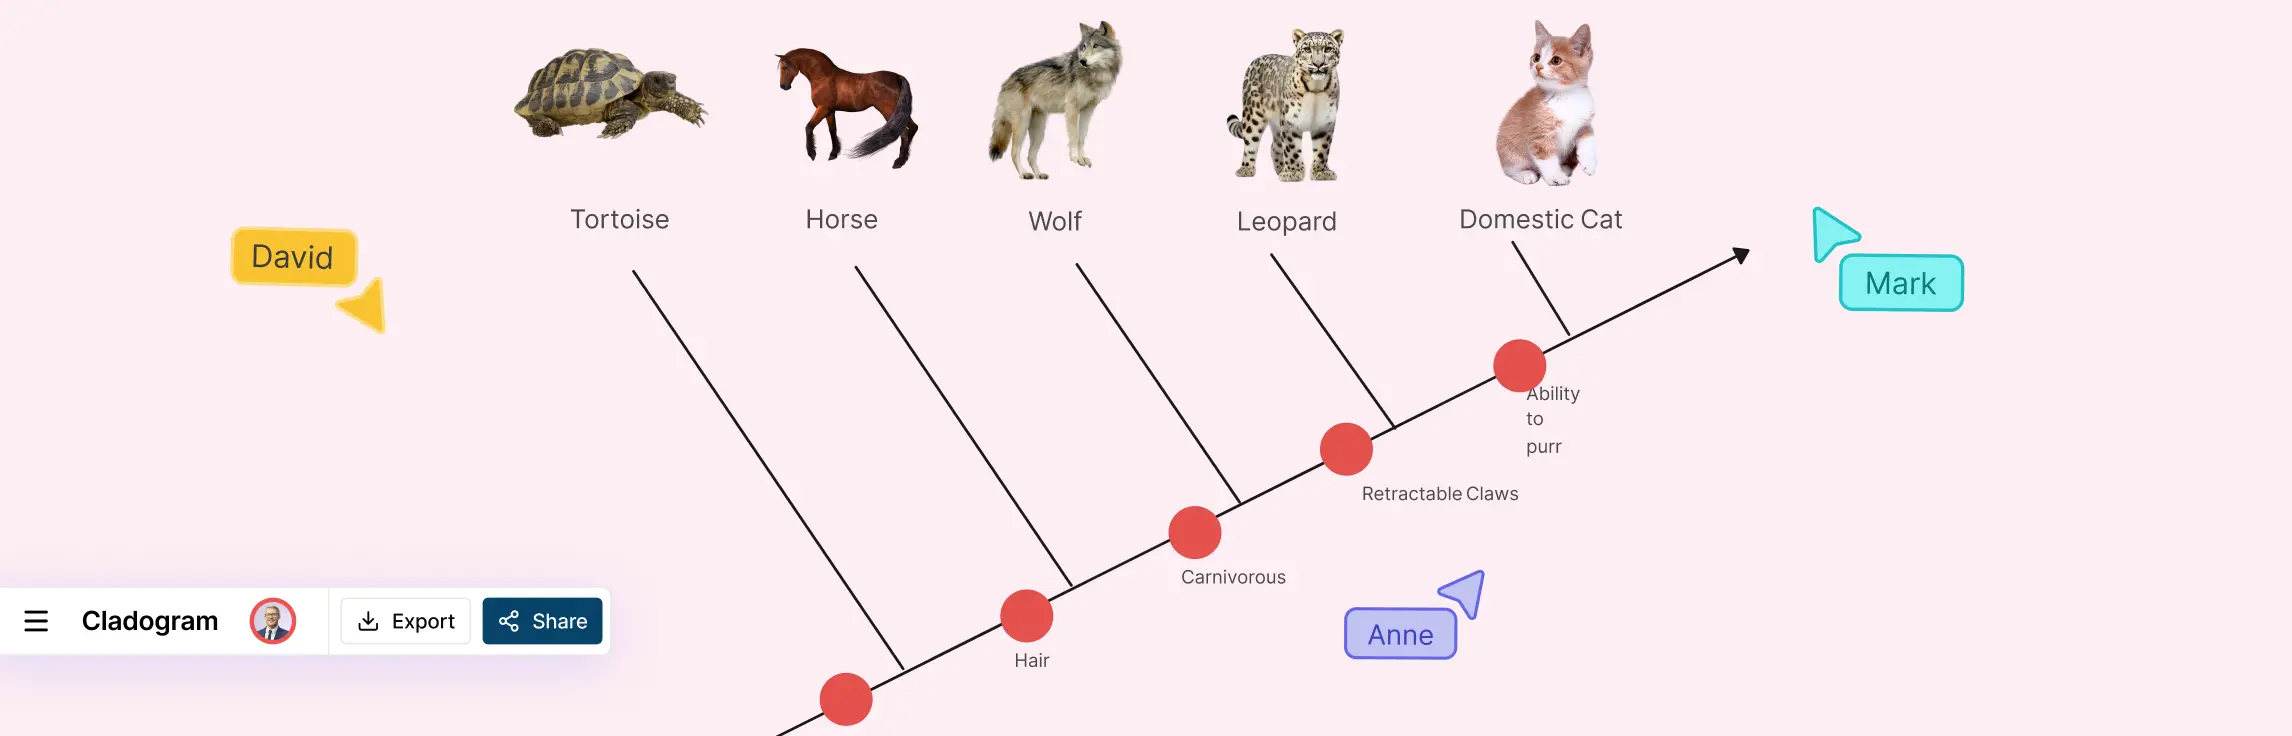
Struggling to turn scattered evolutionary data into a clear, professional visual? You aren’t alone. Our guide simplifies how to create a cladogram using a logical, step-by-step framework. From building character tables to using collaborative templates, discover how to move from messy notes to visual clarity by mapping complex evolutionary relationships with speed and precision. Read More
Most workforce plans suffer from a “data-visualization gap.” HR teams spend weeks meticulously updating headcount numbers in complex spreadsheets, only for those plans to be disconnected from the actual organizational structure. Read More
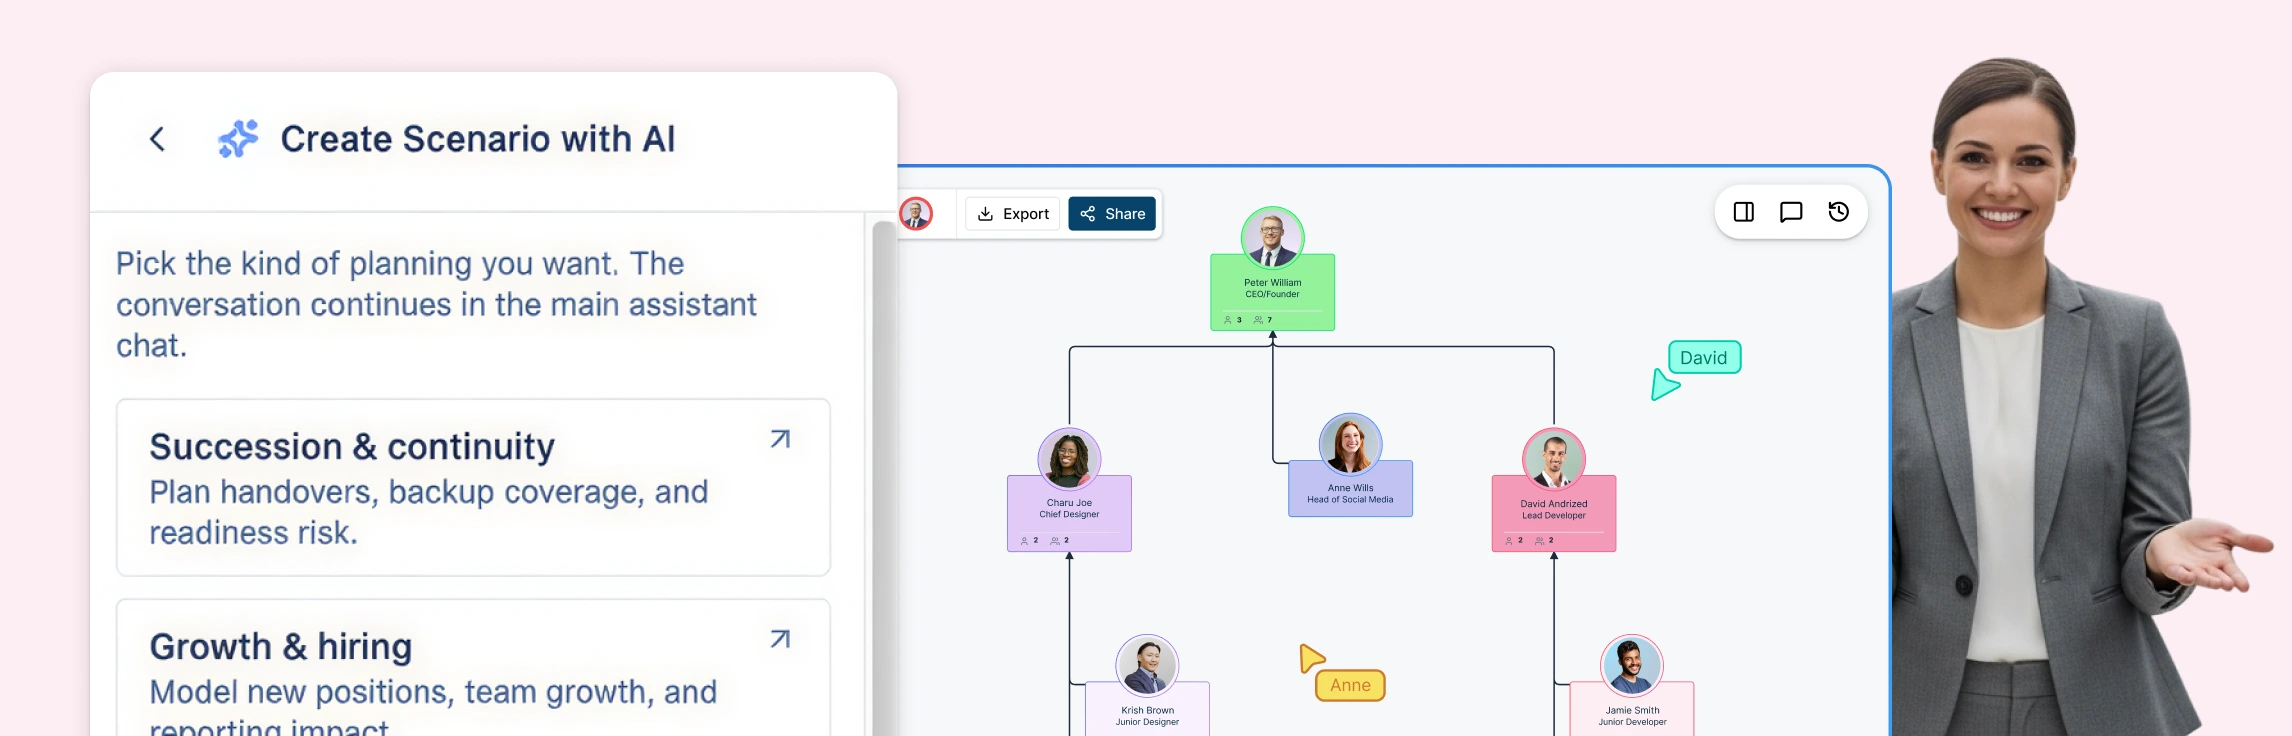
Most organizational design decisions are made in the dark, trapped between static slide decks that hide real impact and live HRIS systems where a single accidental “save” can trigger company-wide panic. This “risk gap” forces leadership teams to choose between committing to a restructure too early or debating endlessly over spreadsheets that can’t visualize reporting depth or span of control. This guide explores how scenario planning replaces guesswork with a “digital twin” of your company—allowing you to model complex reorg planning, visualize structural “deltas,” and test every “what-if” in a secure sandbox before making a single official change. Read More
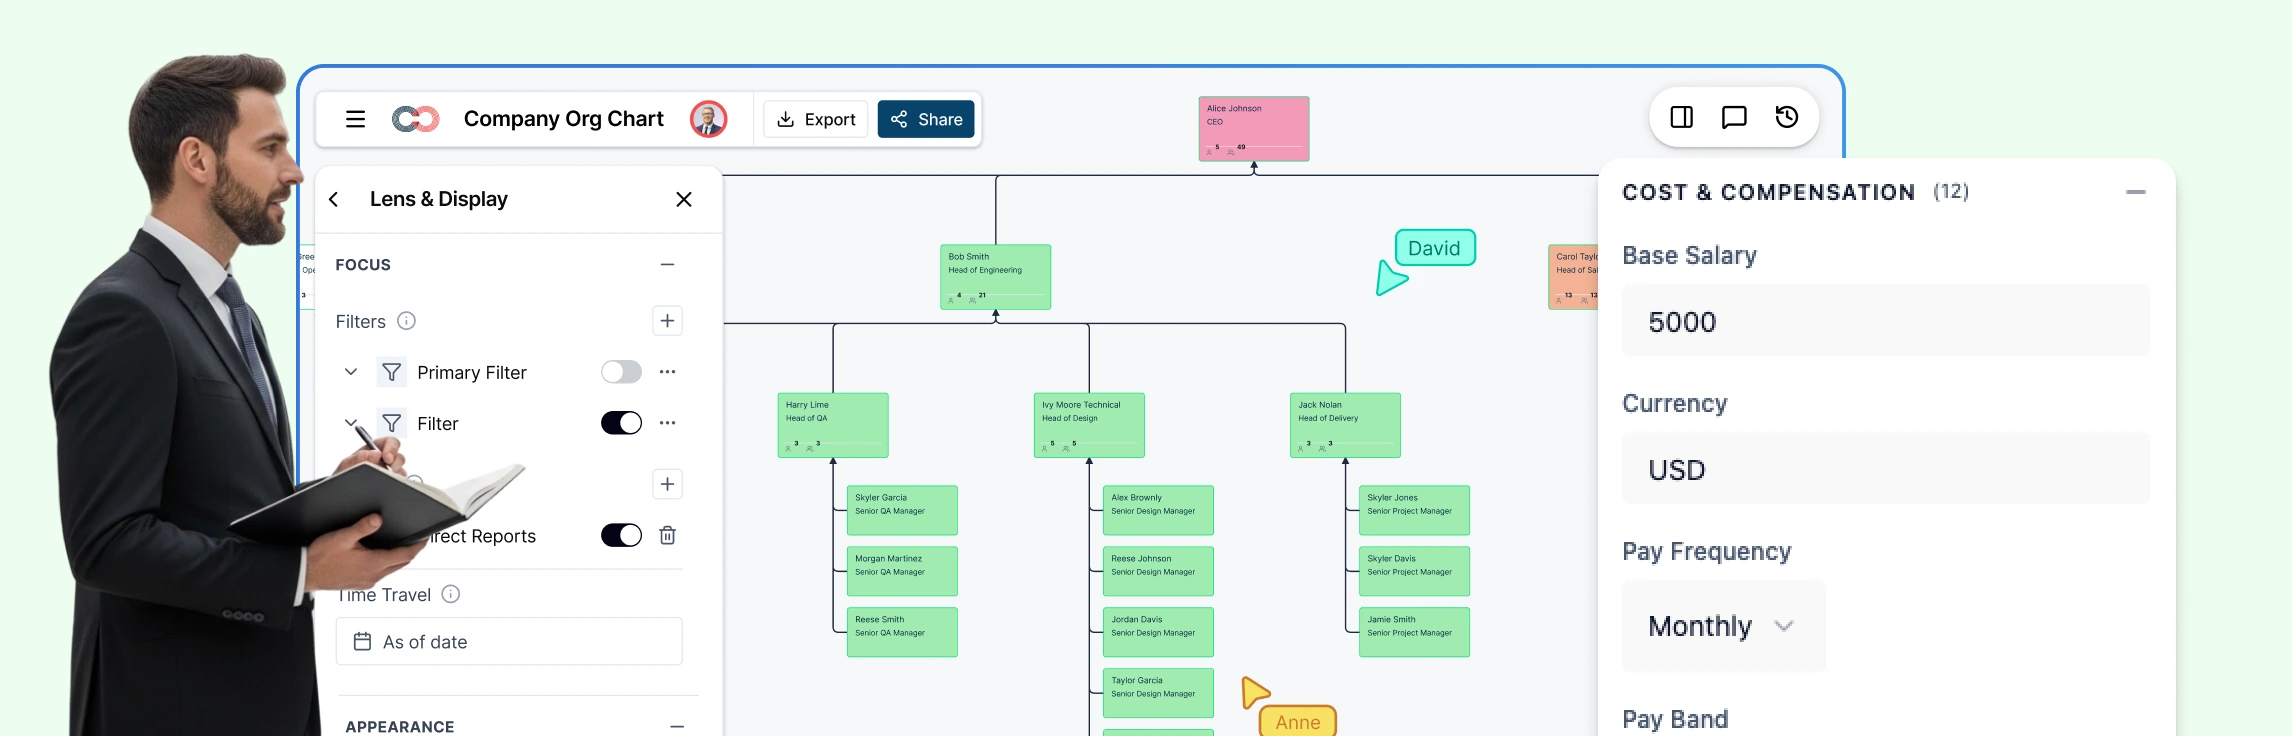
Compensation decisions carry significant weight, yet the information needed to make them is often fragmented across spreadsheets, reports, and disconnected systems. When pay data lacks organizational context, identifying inequities, inconsistencies, or misalignment with market benchmarks becomes time‑consuming and error‑prone. This guide explores how compensation analysis can be made more effective by connecting pay data directly to org charts—providing a clearer view of how compensation is distributed across roles, teams, and reporting lines, and enabling faster, more confident decision‑making. Read More
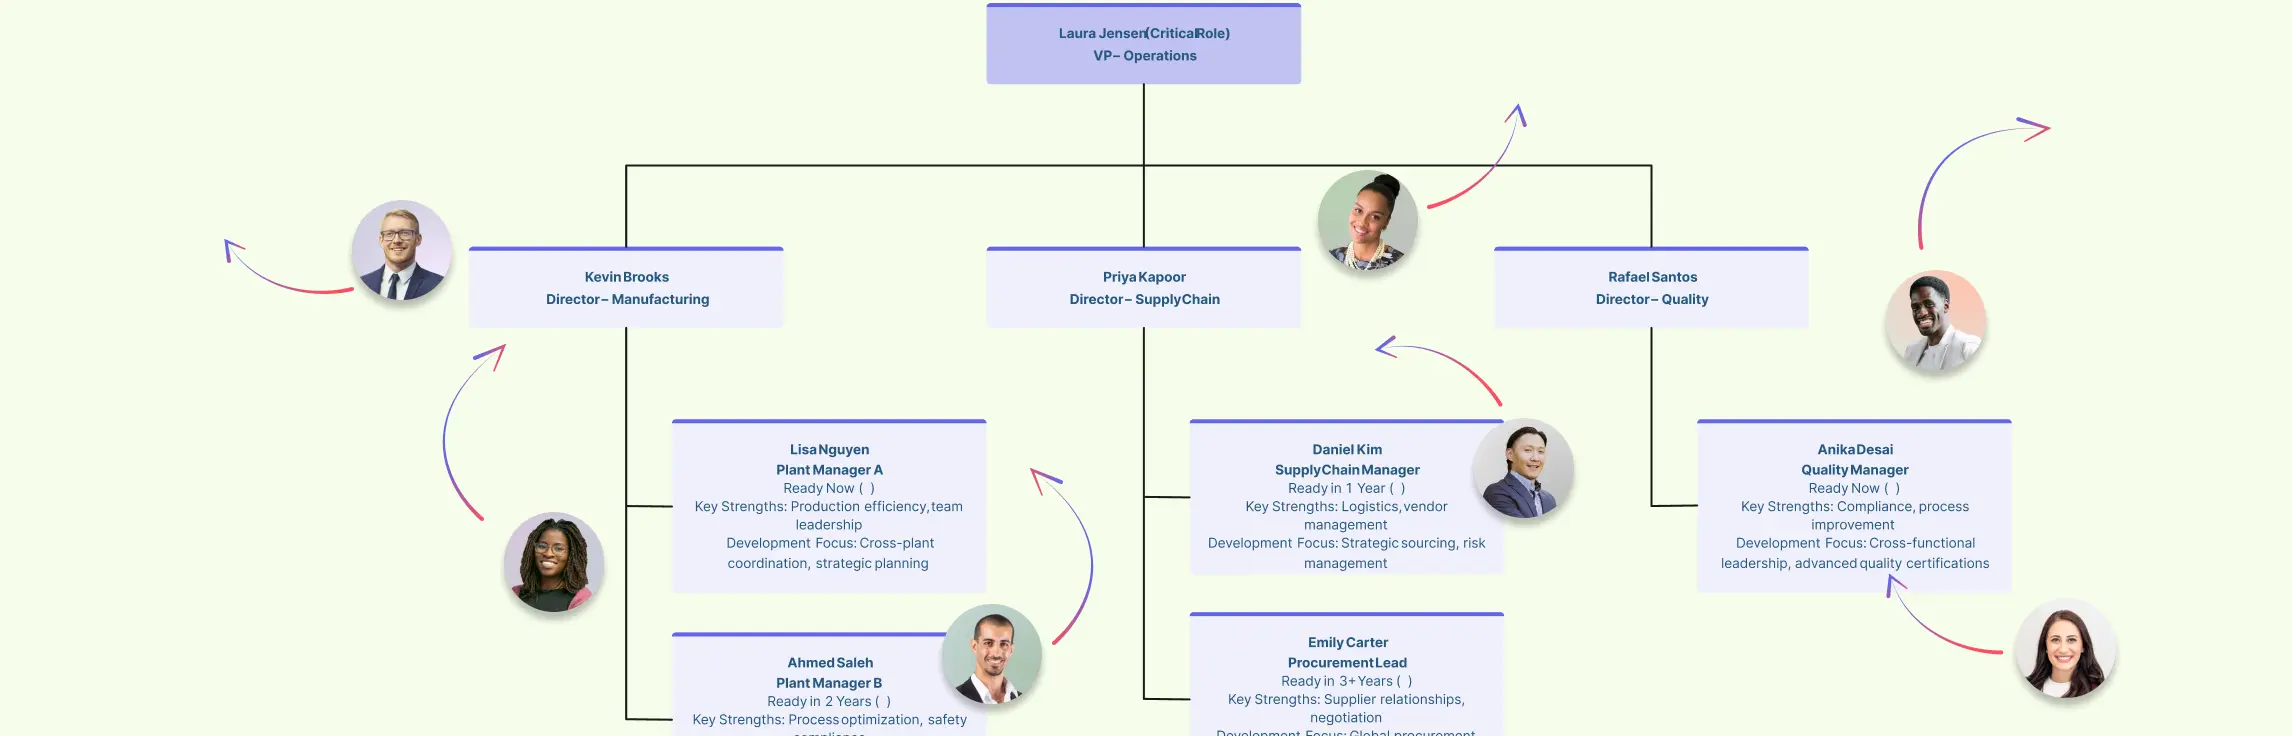
When a senior leader leaves, spreadsheets and talent notes are not enough. You need clear succession planning metrics that show who is ready, where the gaps are, and which roles carry the most risk. Read More
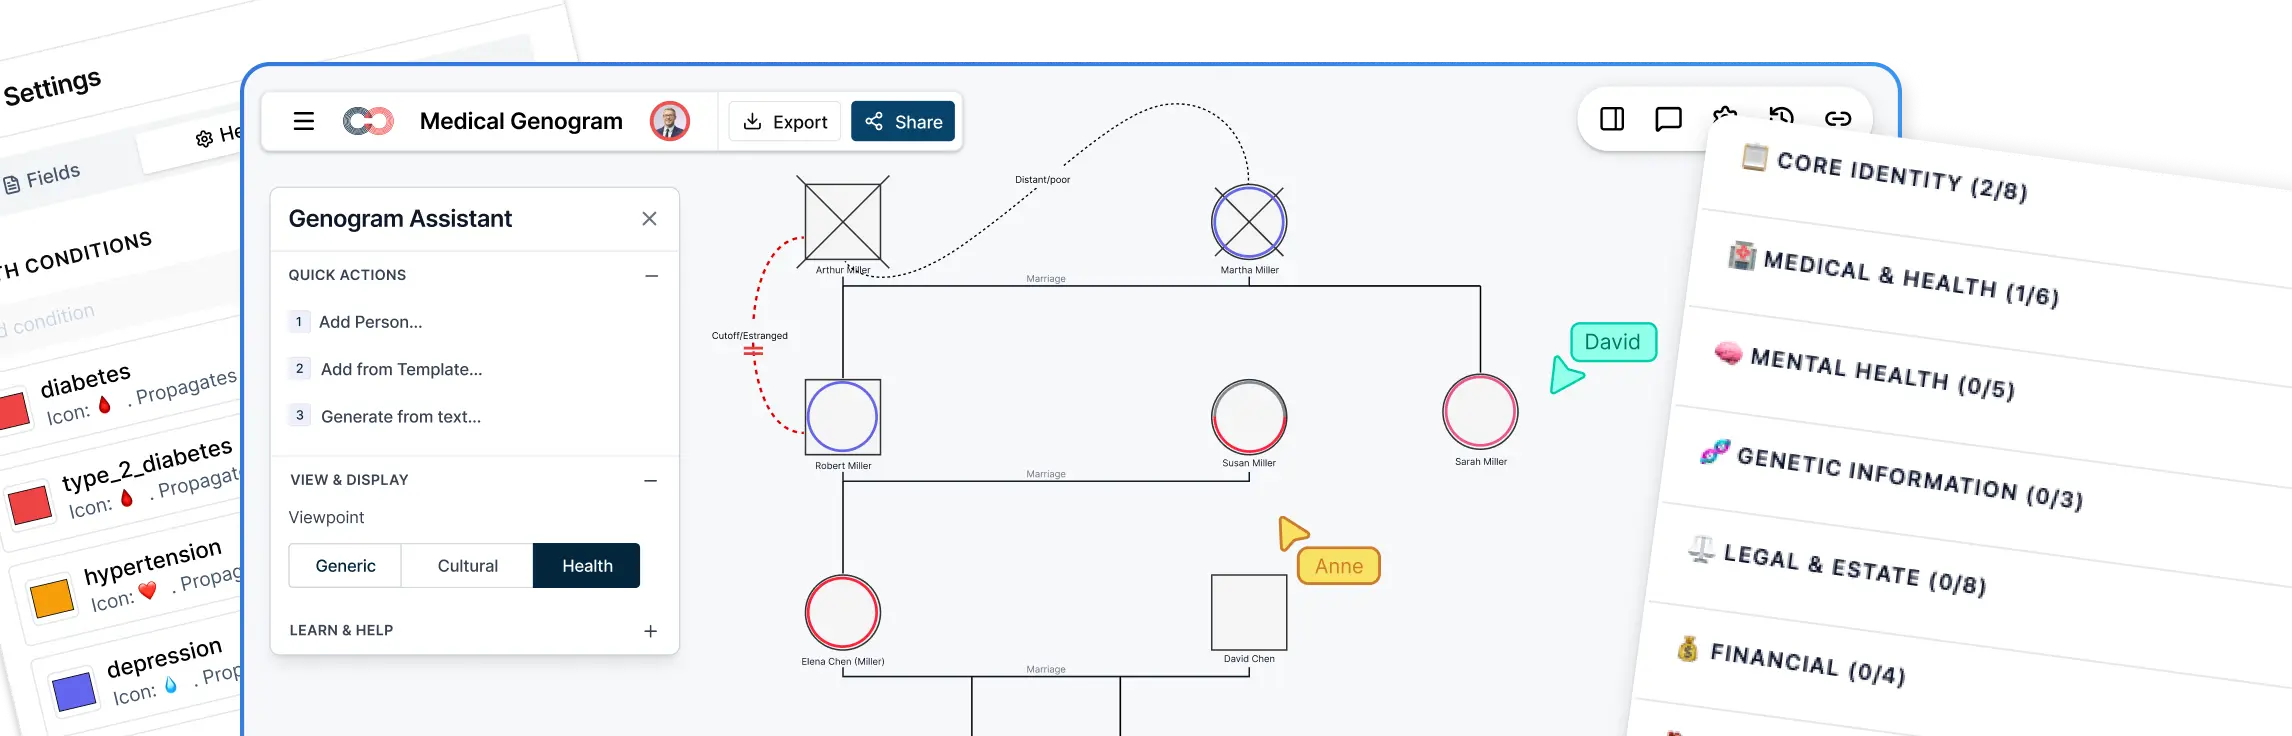
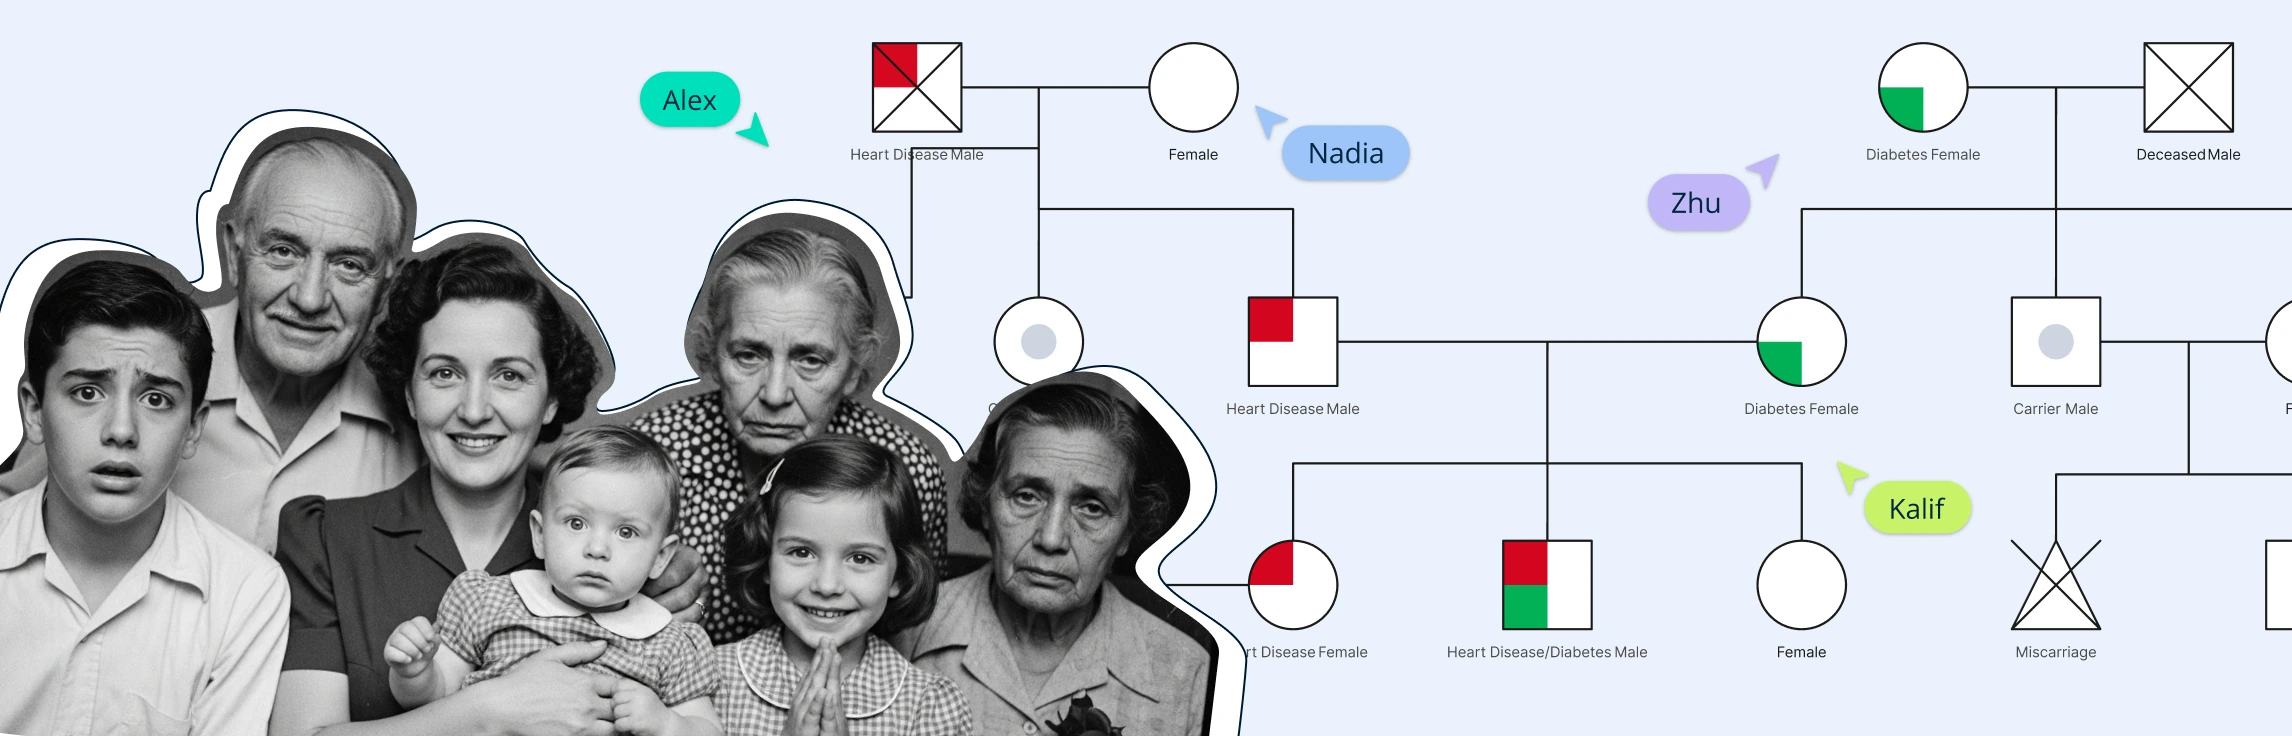
Genetic counselors rely on family history to assess hereditary disease risk, but scattered intake forms and handwritten sketches often make it difficult to identify patterns. A genetic counseling genogram–also called a clinical pedigree–solves this by transforming complex history into a clear visual map. By moving to digital tools, counselors can build an accurate three-generation pedigree during the consultation, revealing inheritance patterns that might otherwise be missed. This guide explores how to move beyond manual drafting to prioritize clinical insight and patient care. Read More
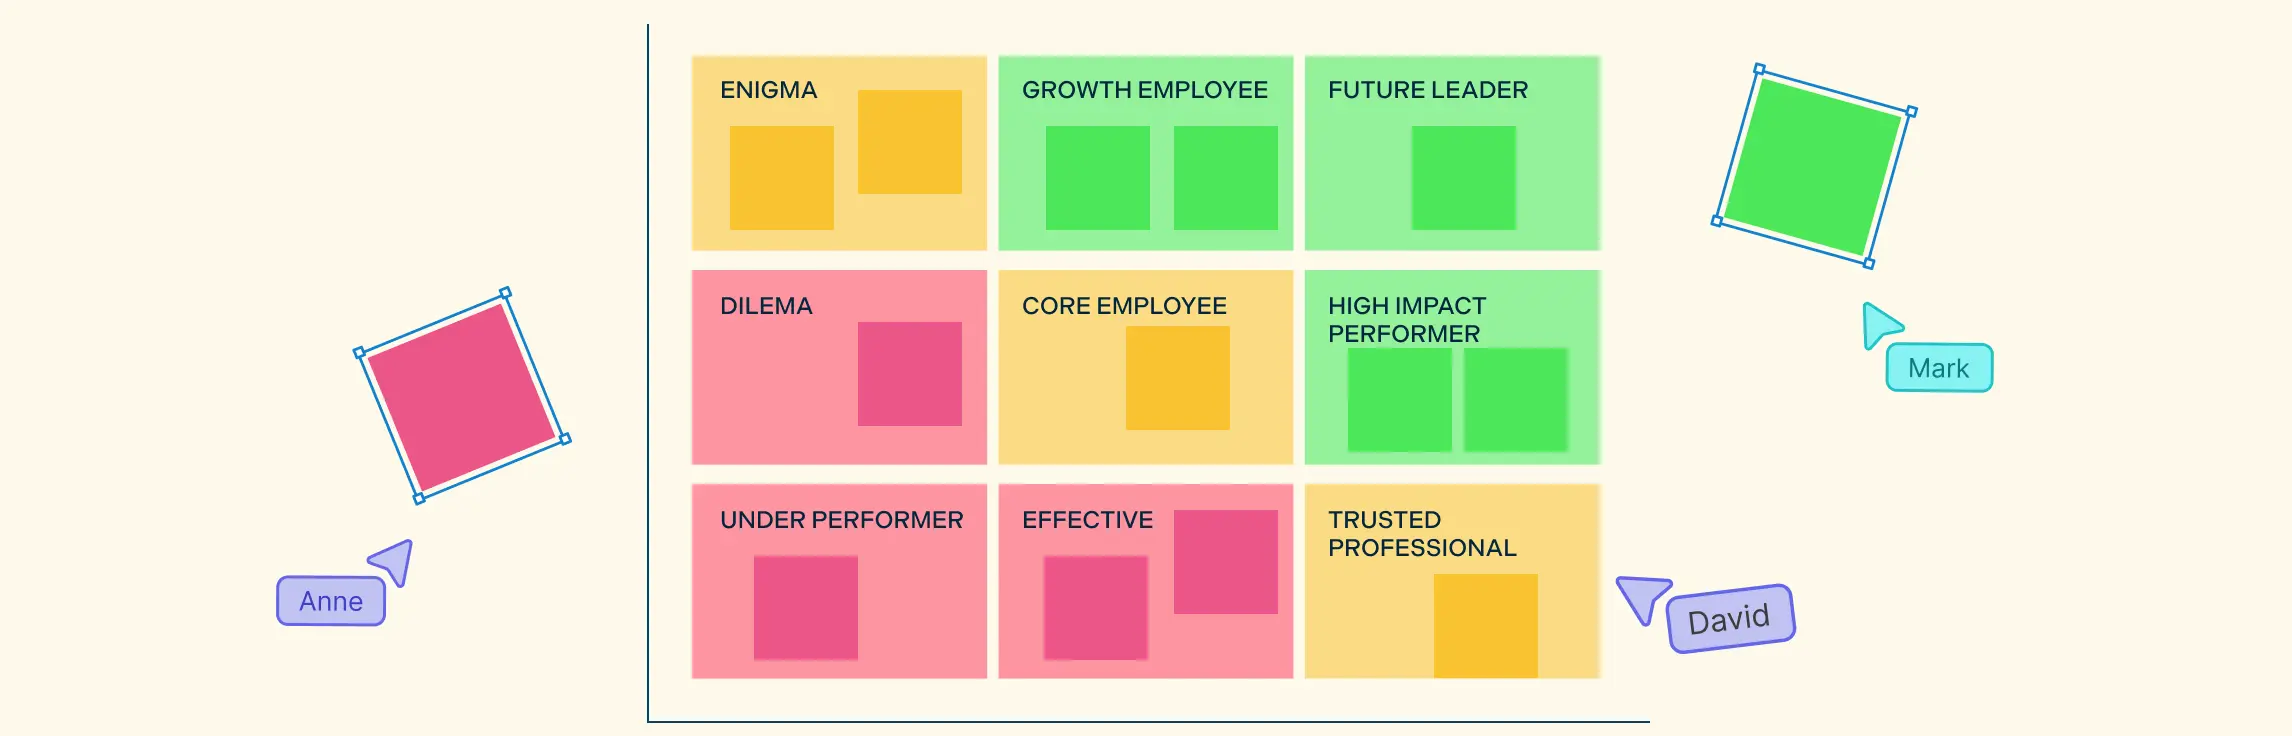
Every team faces the crisis of the leadership pipeline. This guide will show you how to execute a high-impact, strategic 9 box talent review for succession planning. We will explore how to bridge the gap between talent calibration and active pipeline management, ensuring your review process yields a tangible, visual roadmap for your company’s future leaders. Read More
The sudden departure of a key leader shouldn’t feel like a localized earthquake that brings your entire workflow to a halt. If you’re tired of the “single point of failure” anxiety, this guide moves past dry theory to provide concrete succession planning examples and visual roadmaps that actually work for modern teams. Read More
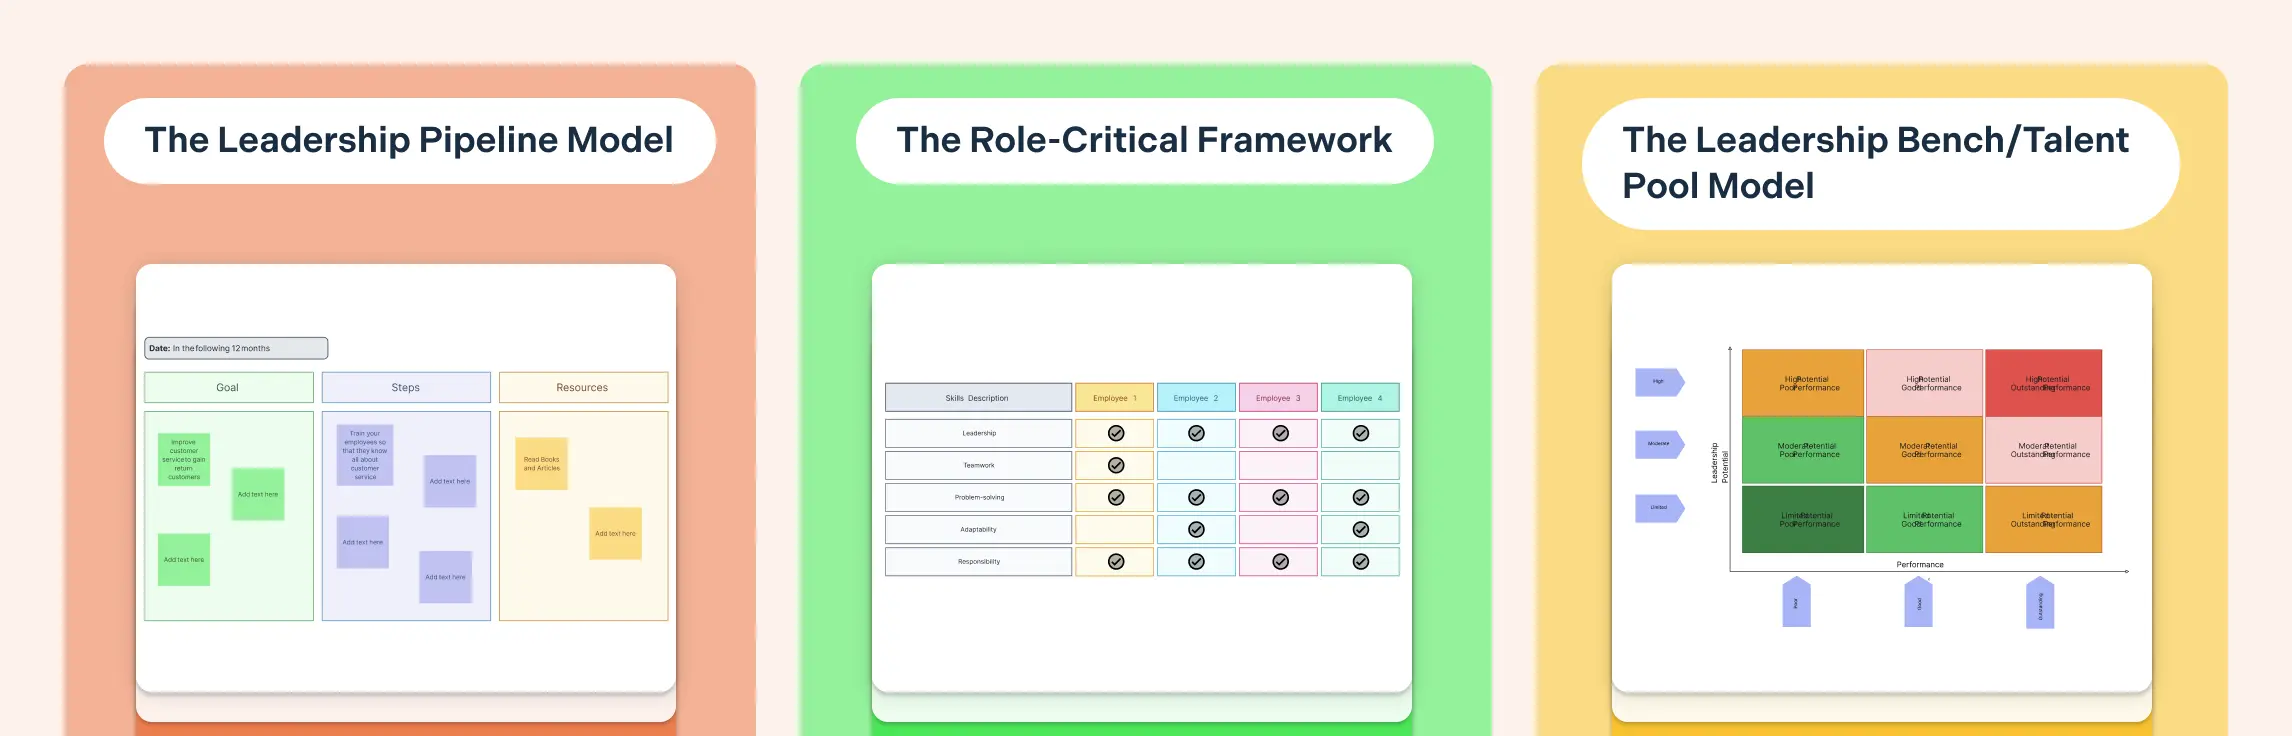
For many teams, the “panic-hire” reality is a result of scattered workflows and a lack of structural clarity. This guide explores the succession planning framework as the structural “bones” of your leadership strategy, comparing the big three succession planning models—Pipeline, Role-Critical, and Talent Pool—to find the one that “just works” for your organization. Read More
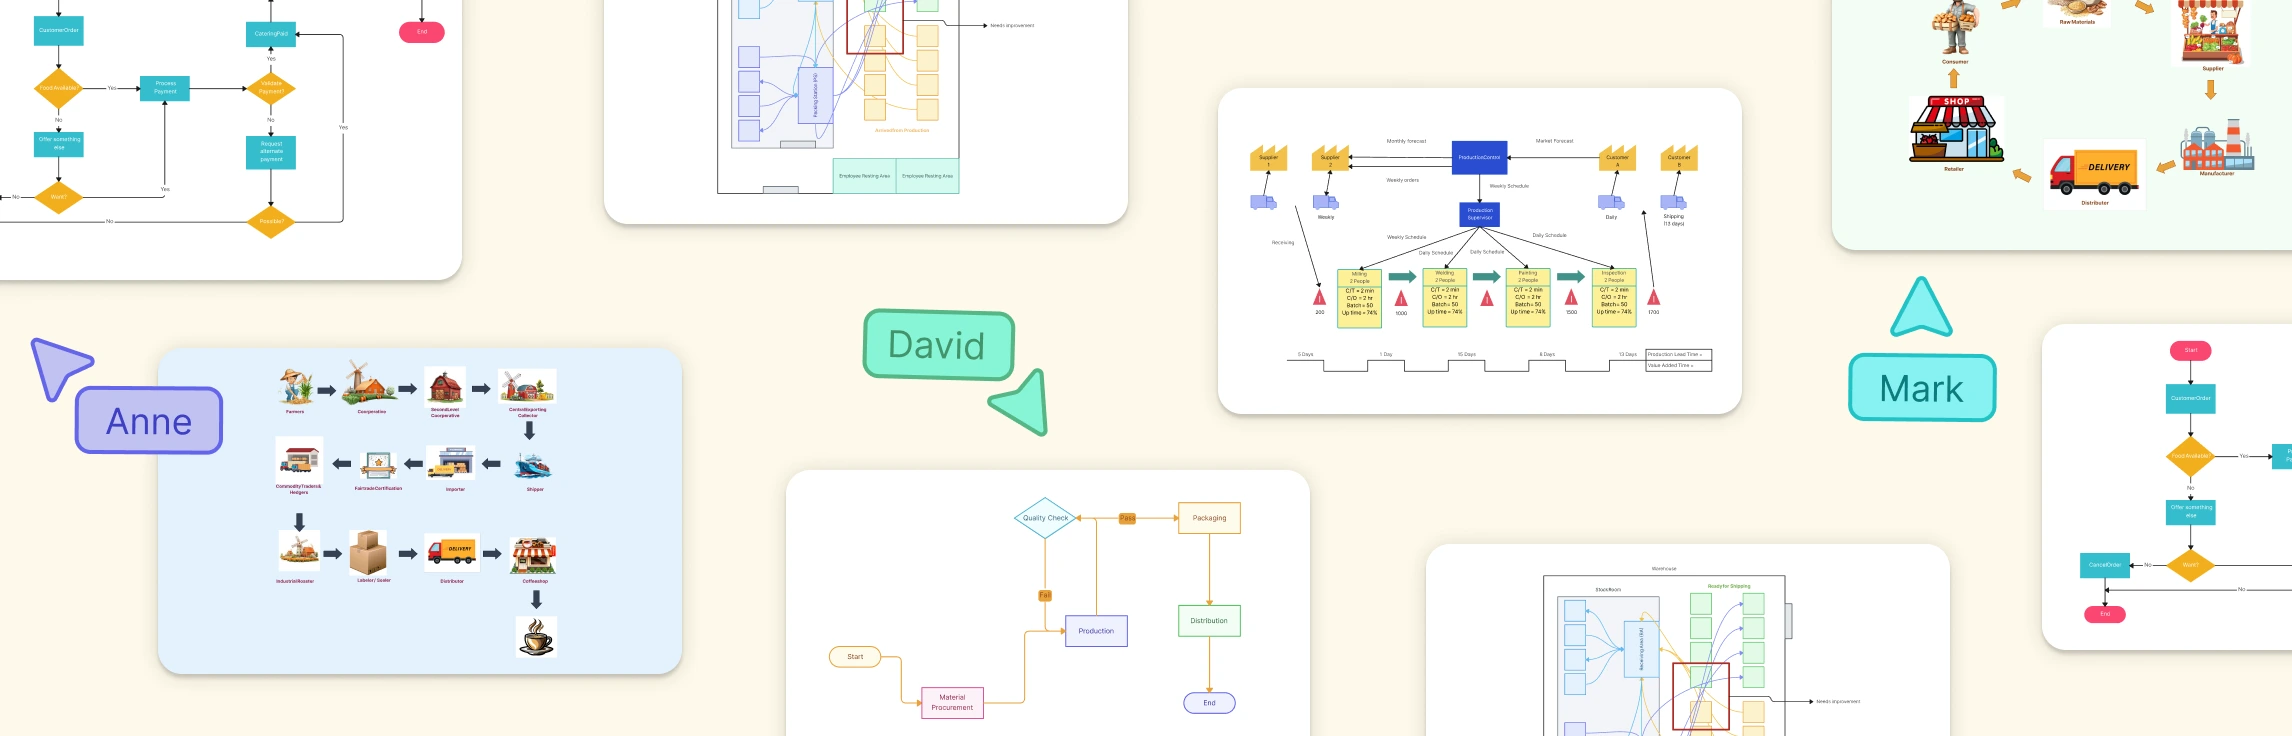
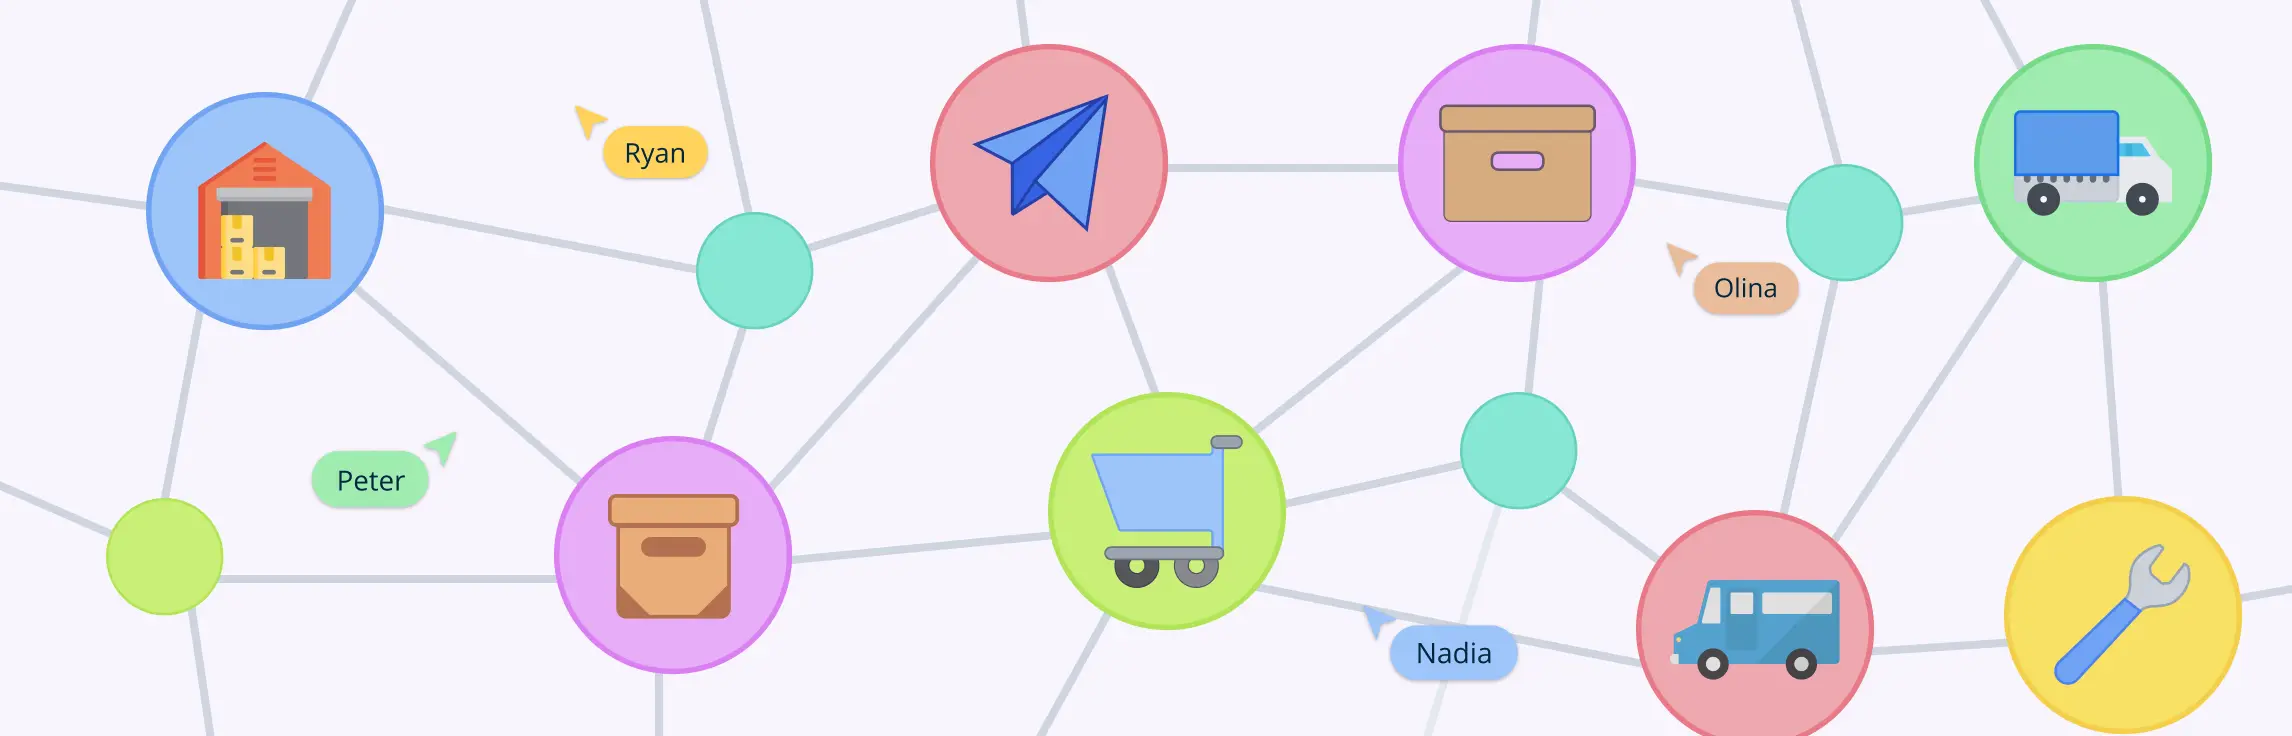
Supply chain diagram examples show how materials, information, money and responsibilities flow from suppliers to end customers; they turn complex networks into a visual model teams can reason about. According to authoritative supply‑chain guidance, diagrams capture product, information, and capital movement across organizations. Read More
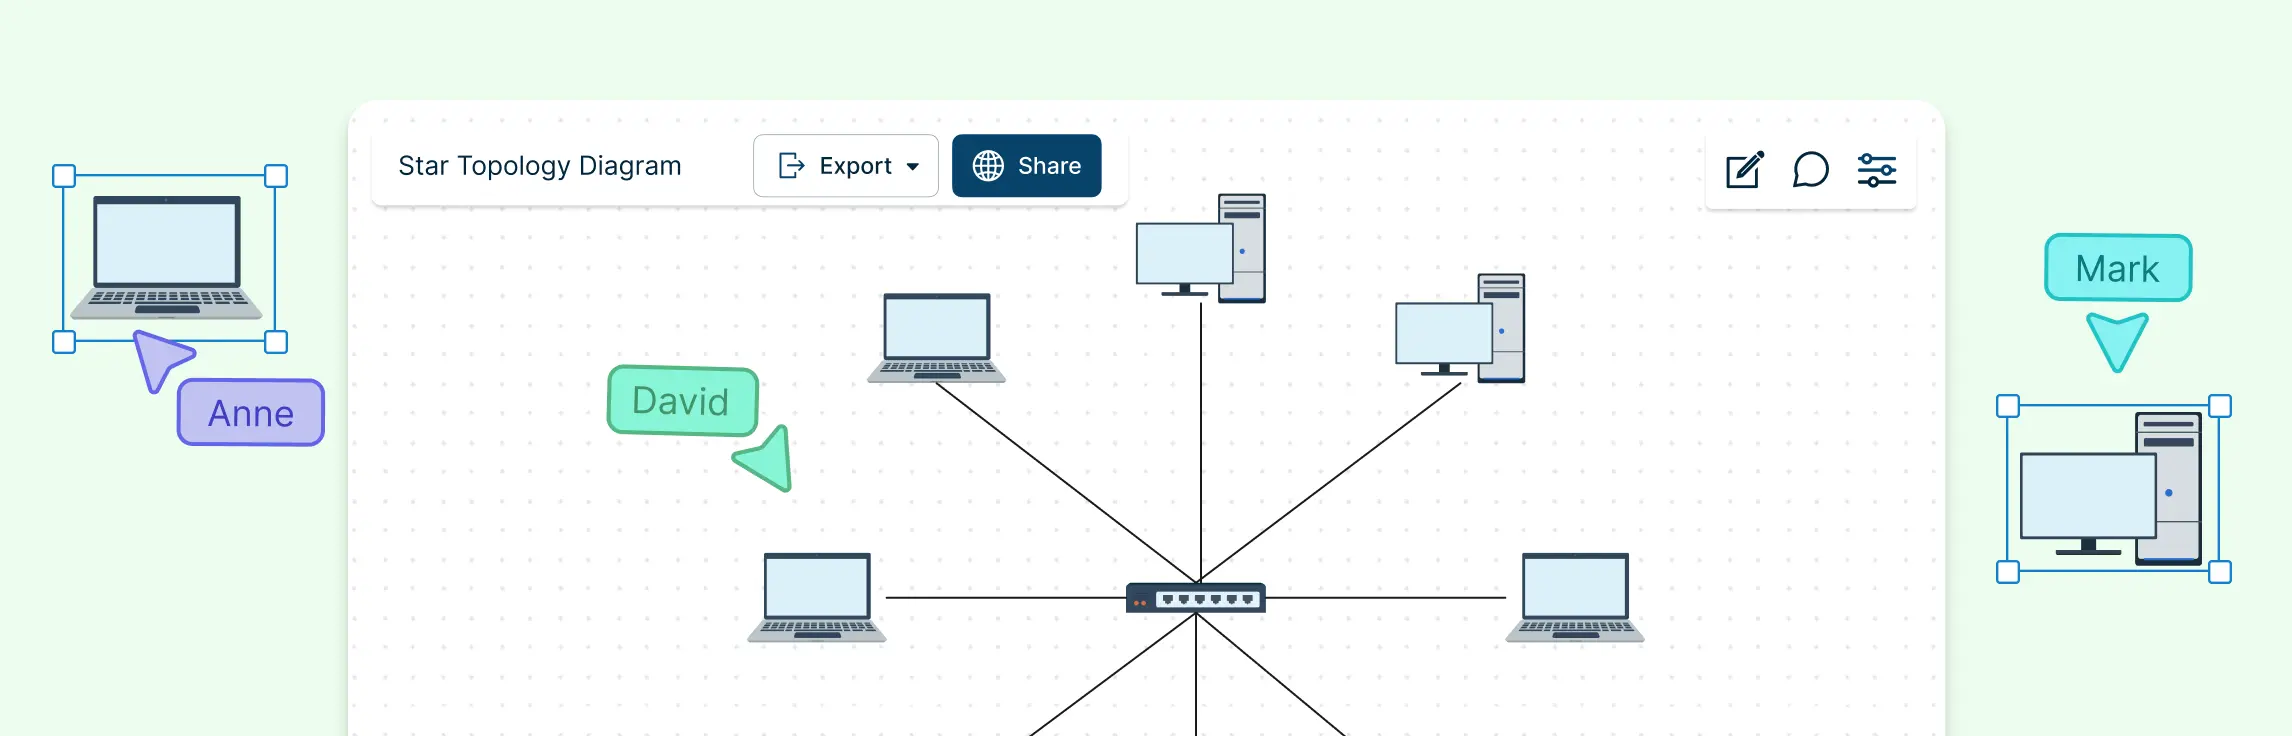
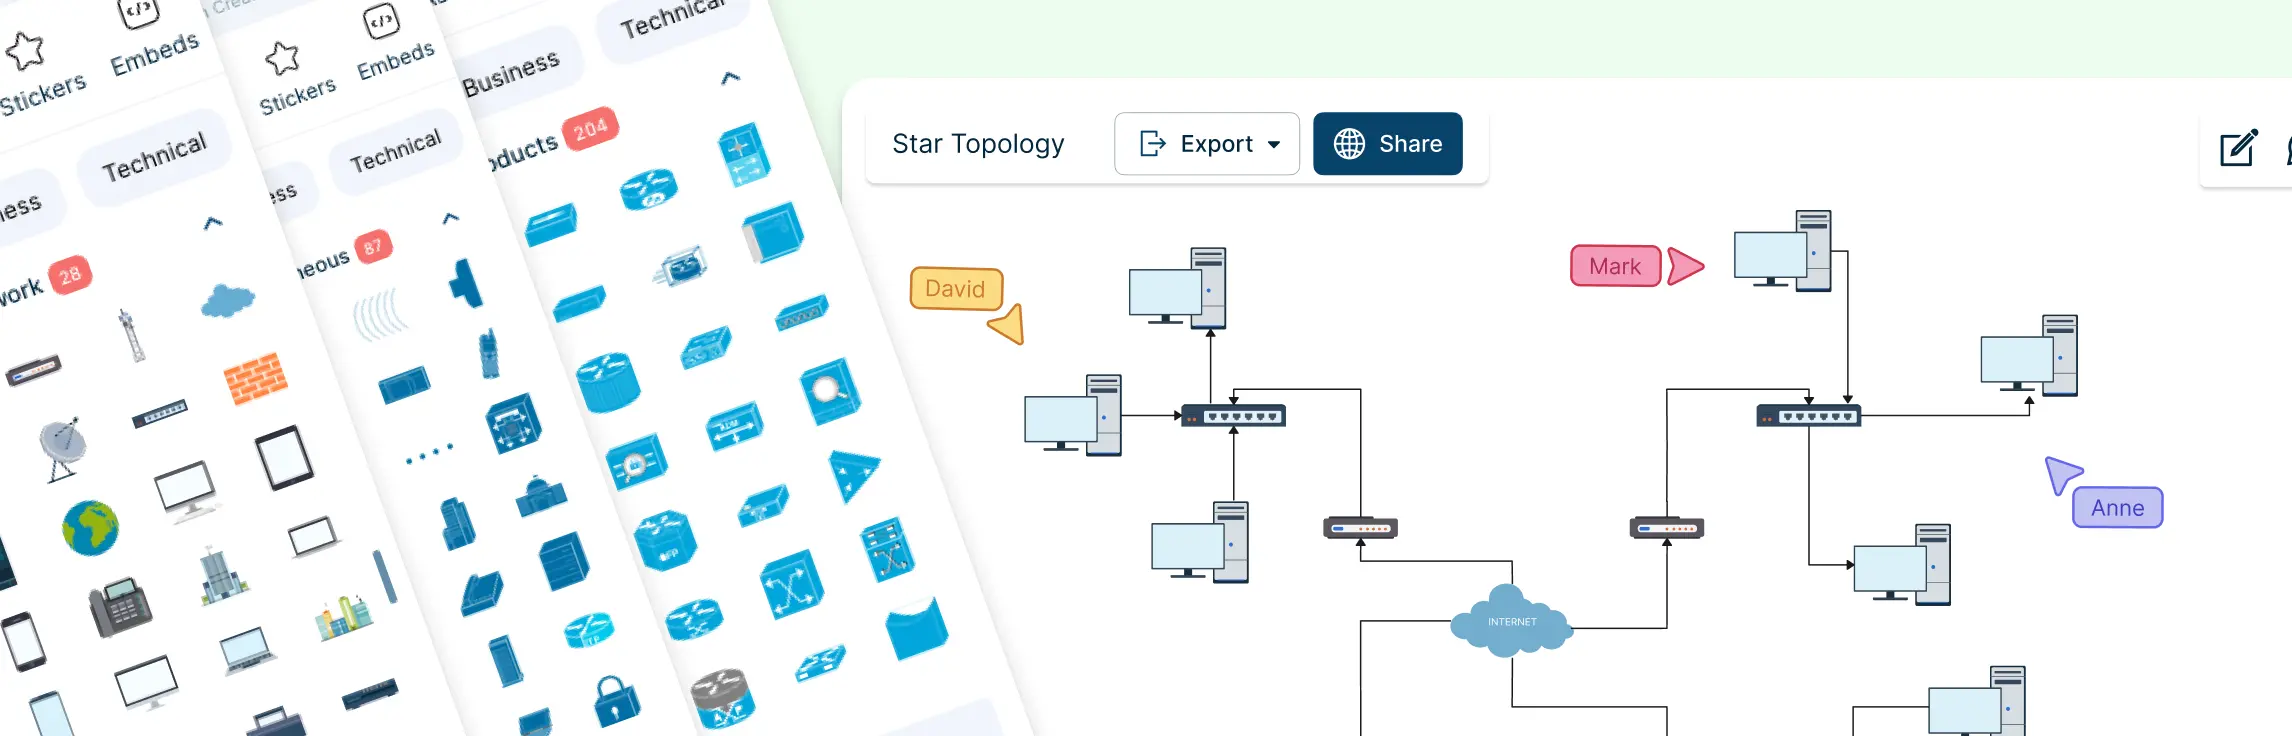
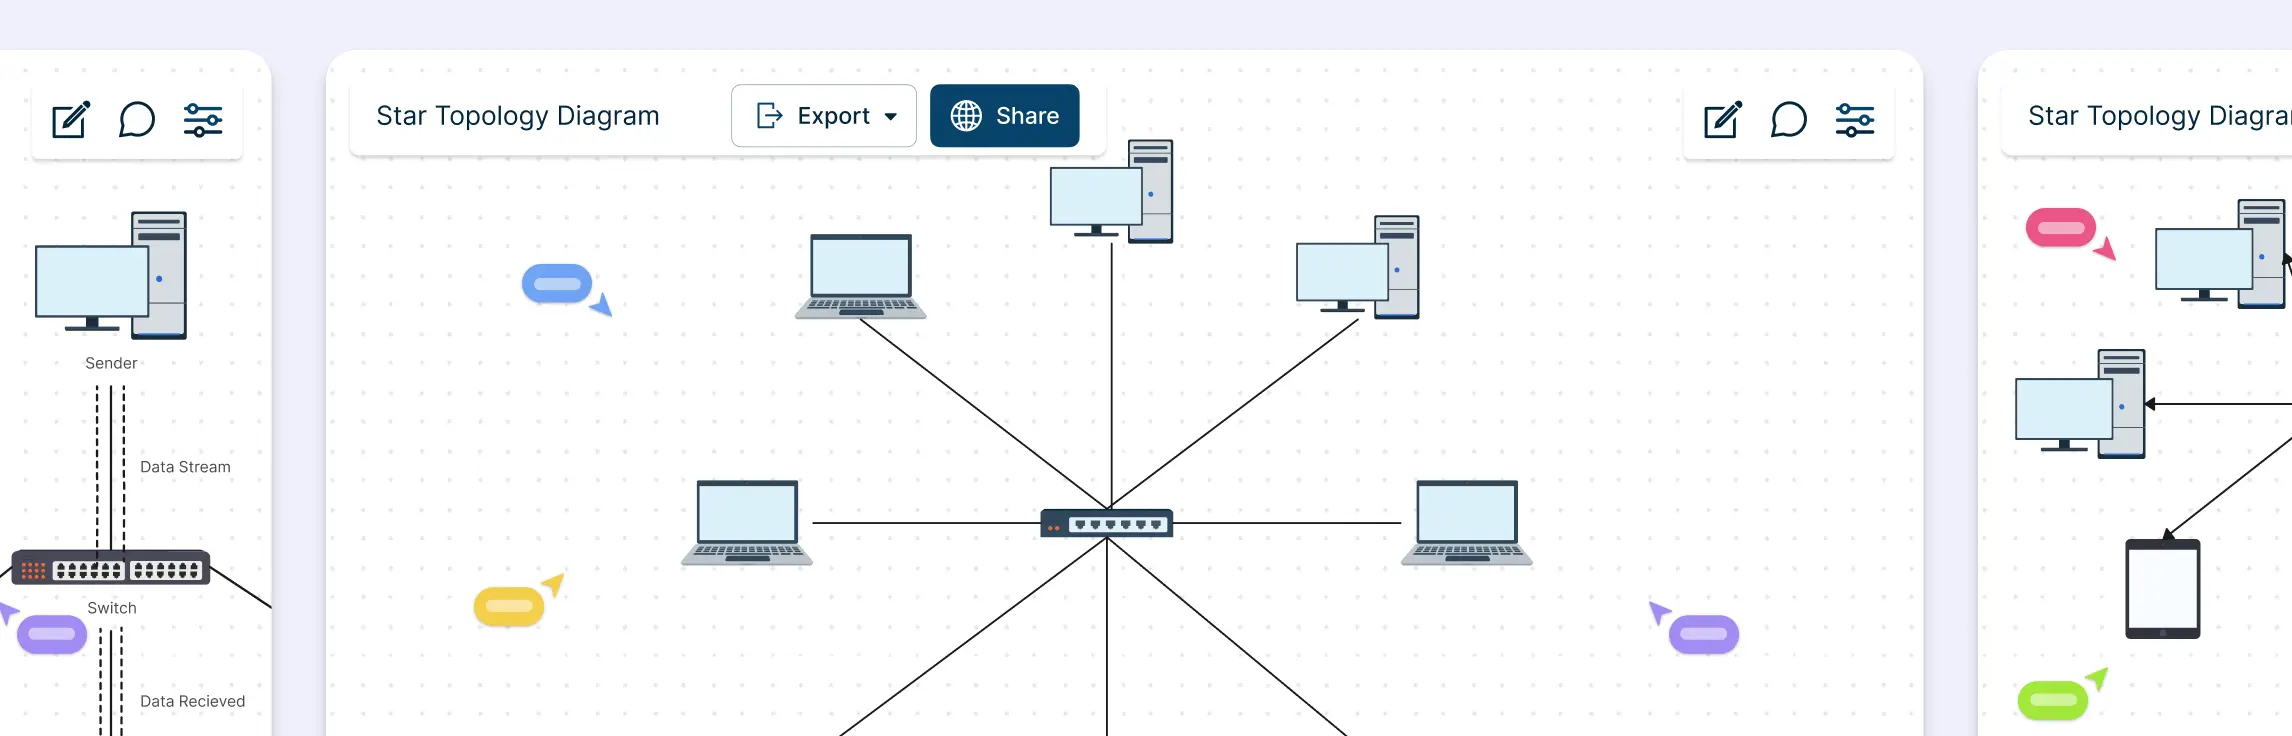
Ever stared at a messy network diagram and felt your head spin? Many teams struggle with scattered connections, confusing layouts, and endless troubleshooting, especially when networks grow beyond a few devices. That’s where a star topology comes in: a simple, organized way to connect devices with a central hub, making your network clear, manageable, and scalable. In this guide, we’ll discuss the different types of star topologies and 10 practical star topology examples that you can explore. Read More
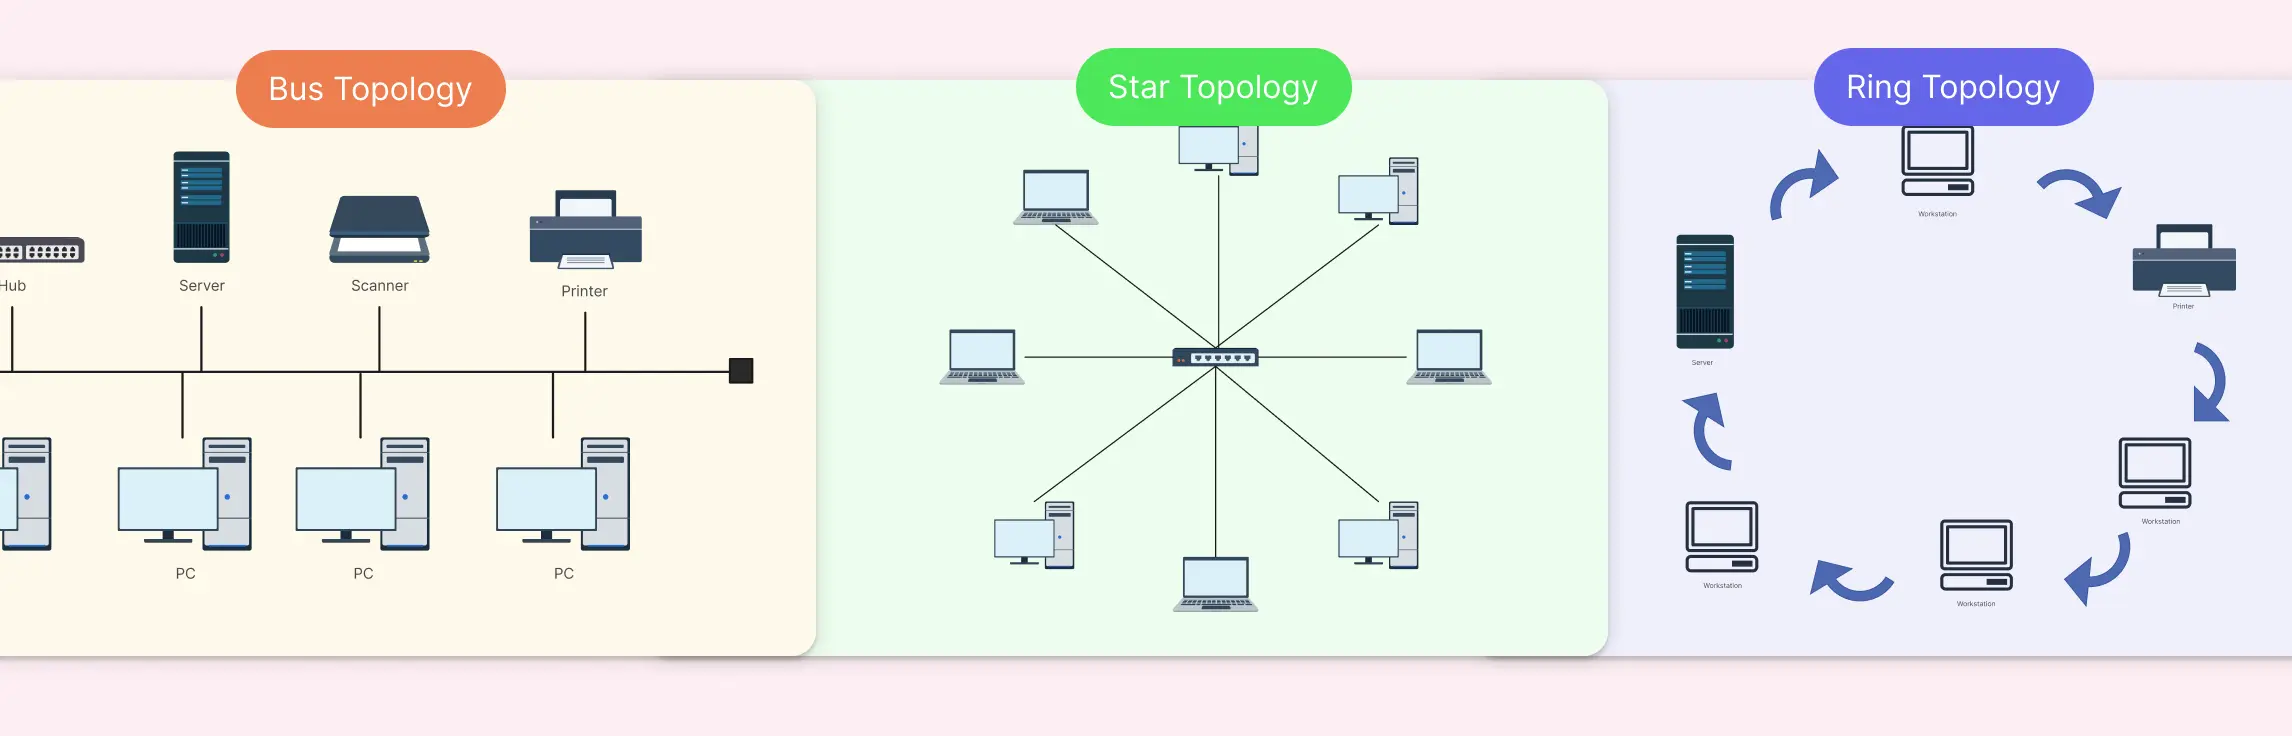
Choosing the right network topology can feel like navigating a maze; one wrong decision, and you’re stuck with slow data flow, troubleshooting headaches, and scattered team workflows. That’s exactly why comparing Bus, Star, and Ring Topology upfront can save hours of frustration and keep your network running smoothly. In this guide, we’ll break down each topology, highlight the differences, and show you practical ways to visualize your network with ready-to-use templates. Read More
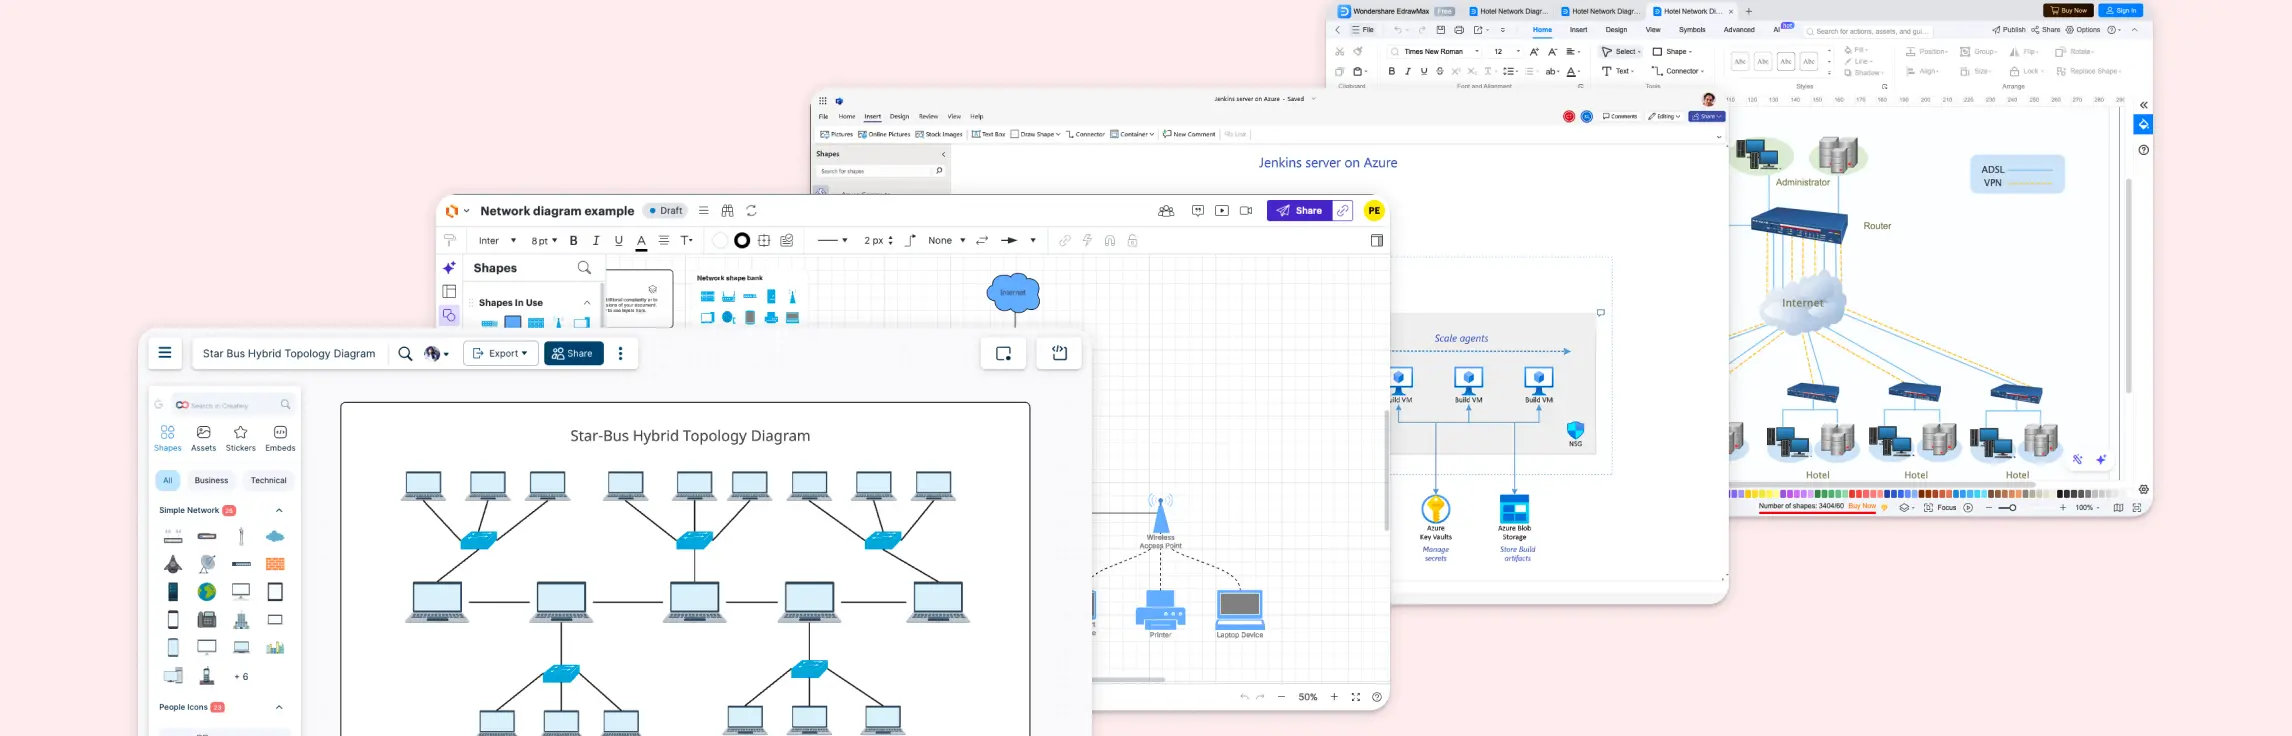
Ever stared at a diagram full of tangled notes trying to make sense of your network setup? The right network diagram software can turn that chaos into clarity. In this guide, we’ll walk you through the best network diagram software, so you can pick the solution that brings structure, speed, and visual clarity to your workflow. Read More
Ever stared at a tangle of cables or a messy network diagram and thought, “There has to be a better way”? That’s where the extended star topology comes in: a structured, scalable network design that keeps communication smooth, devices organized, and troubleshooting a breeze. Read More
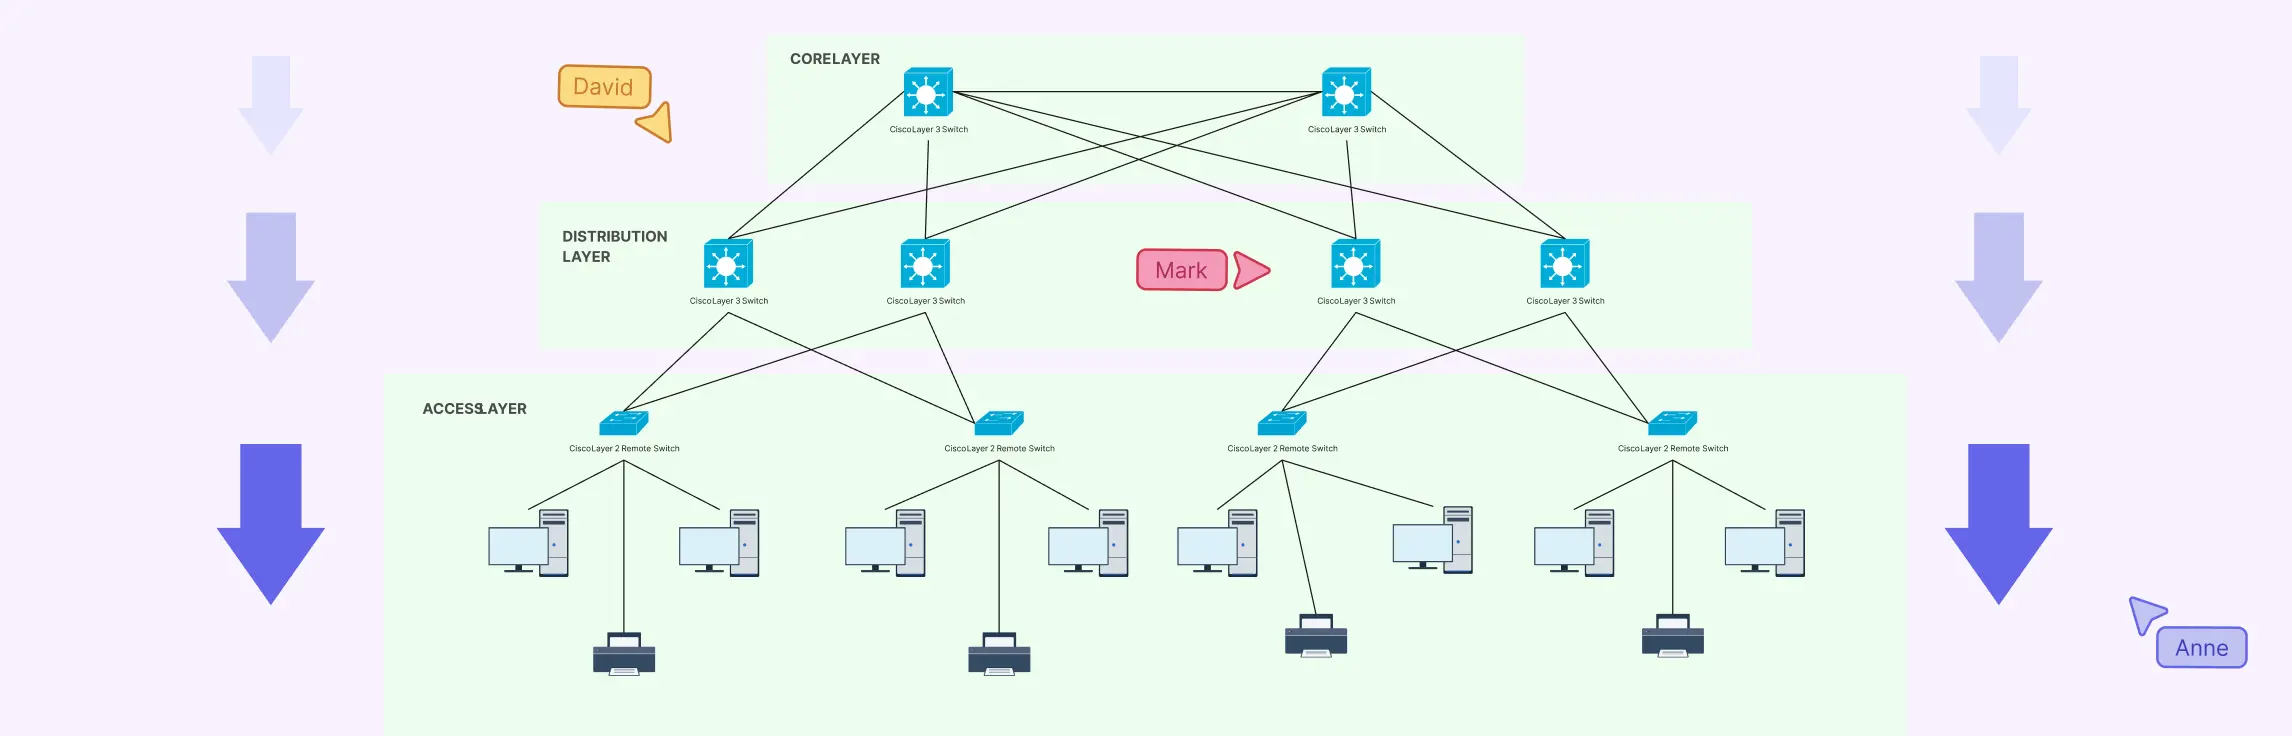
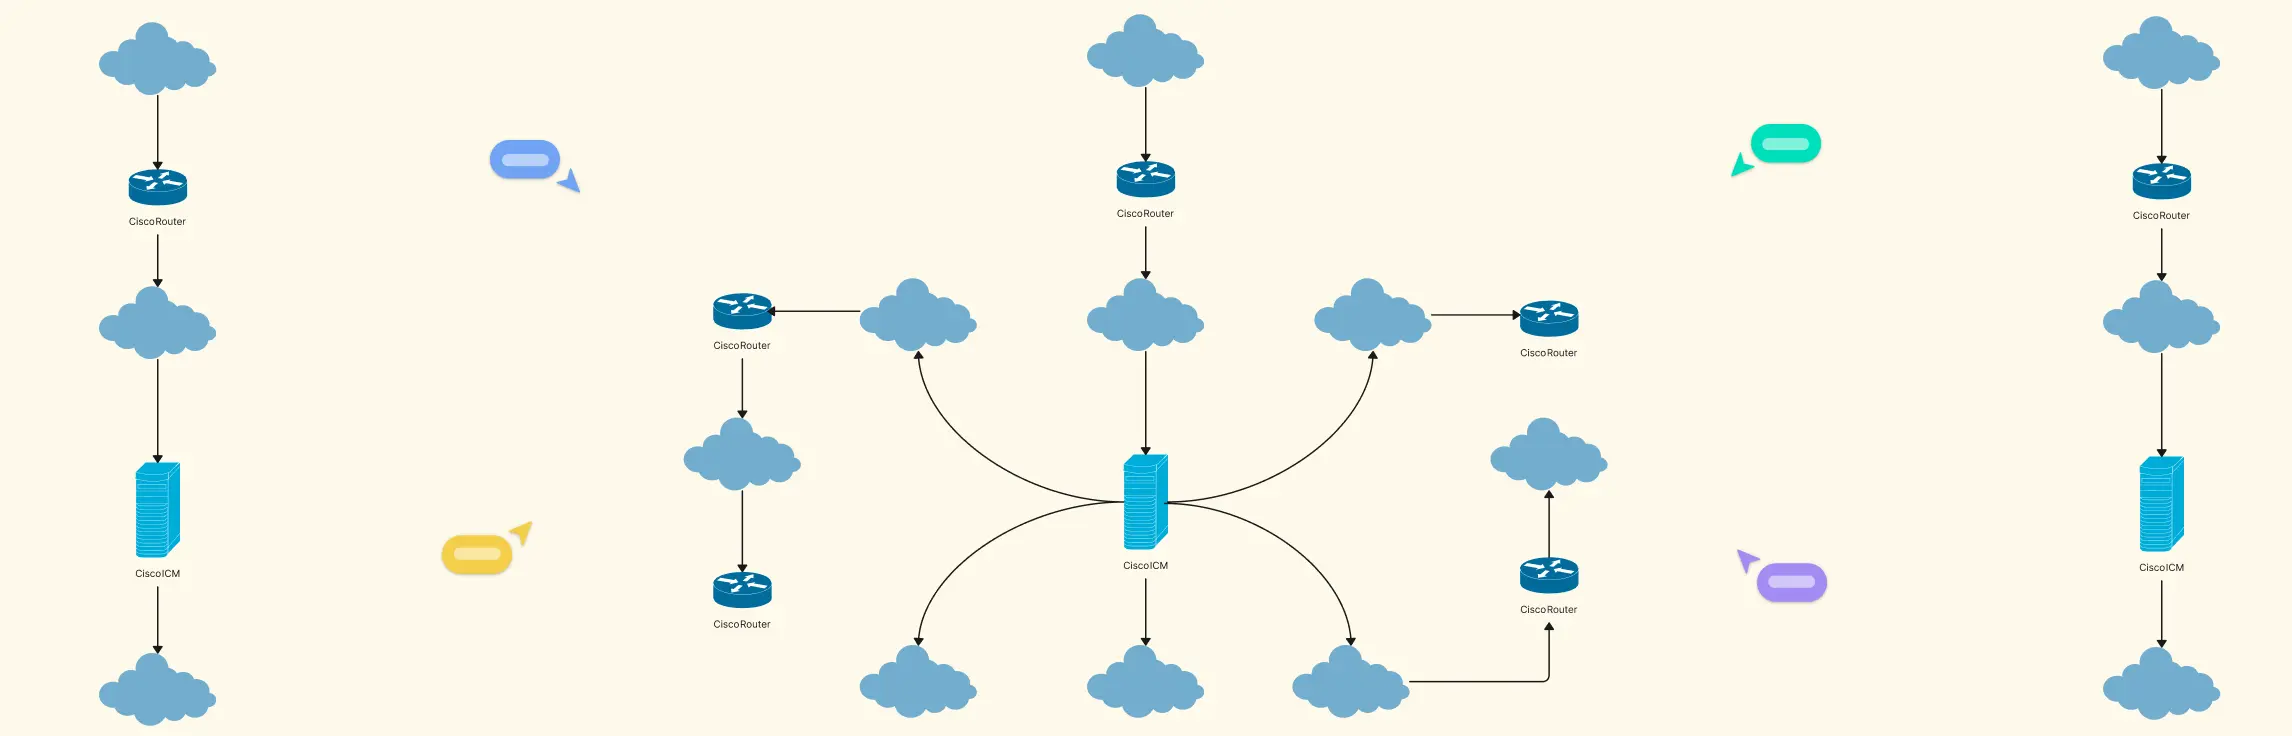
Designing a network can feel like trying to untangle a massive ball of wires, confusing, frustrating, and time-consuming. That’s where a hierarchical network topology comes in. In this guide, we’ll break down what a hierarchical topology is, explore its core layers, show real-world examples, and weigh its advantages and disadvantages. Read More
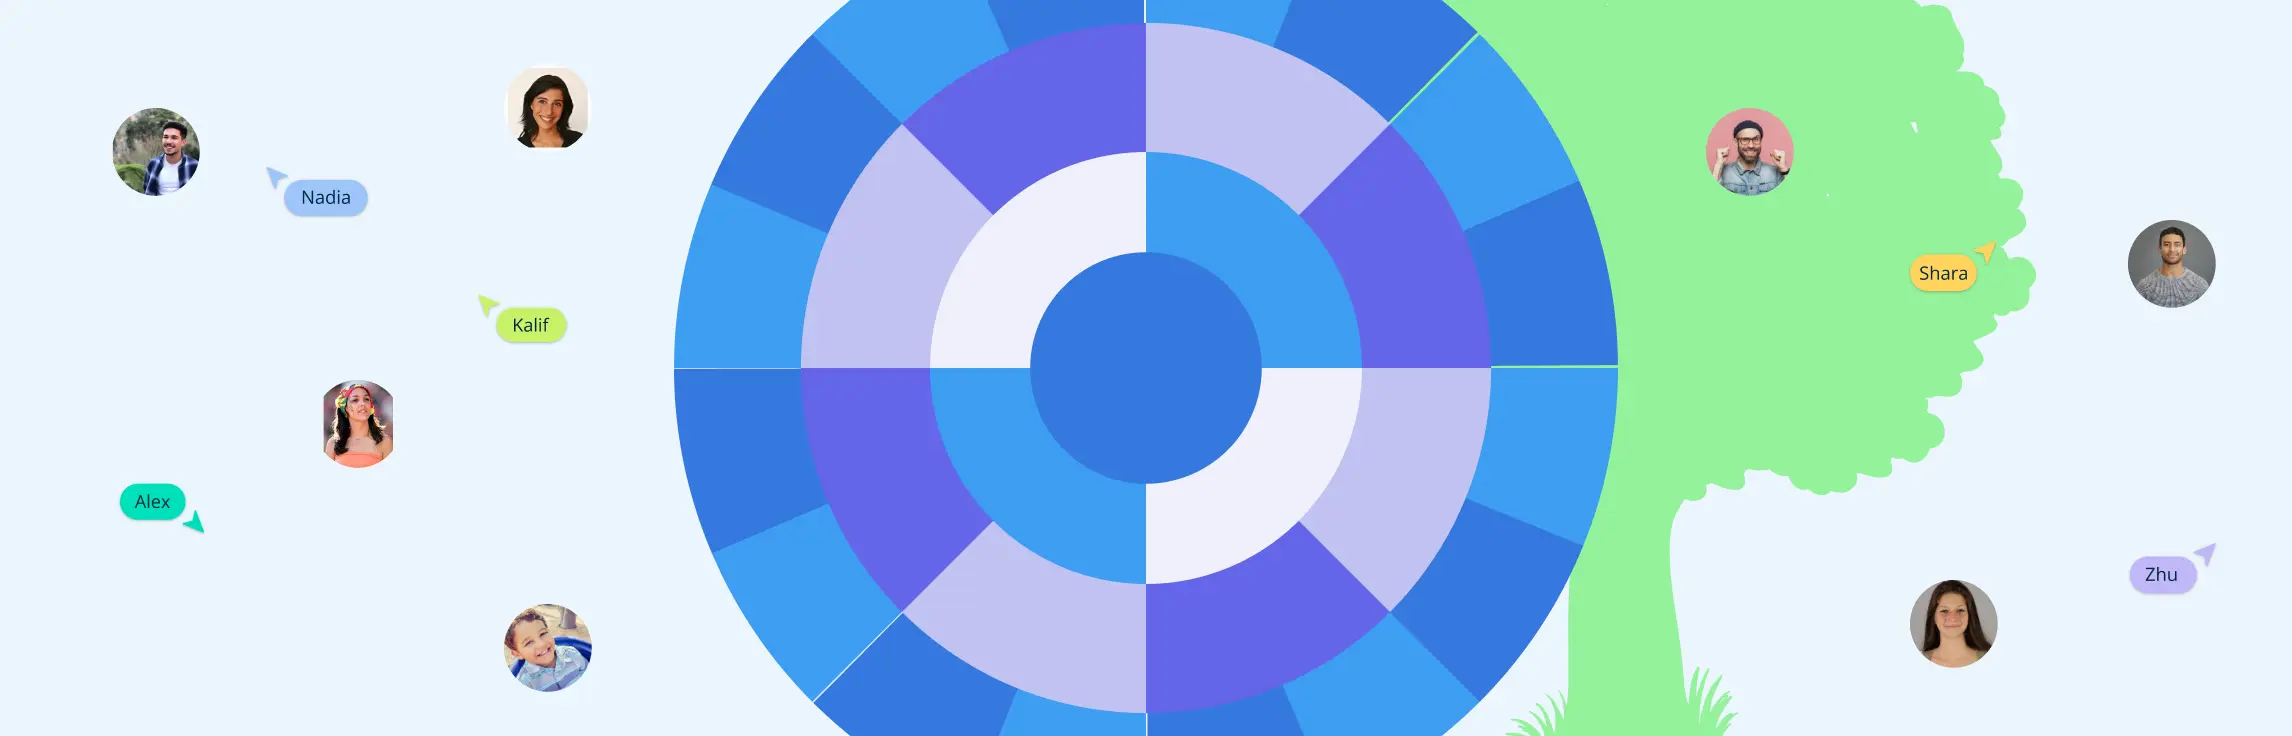
Tracking your family history can quickly become overwhelming. Traditional family trees often stretch endlessly, with branches crossing over each other and names getting lost in the clutter. If you’ve ever felt frustrated trying to make sense of a sprawling ancestry chart, you’re not alone. That’s where a circular family tree comes in. By arranging generations in concentric rings around a central person, this layout offers clarity, visual balance, and an intuitive way to explore your lineage. In this guide, we’ll show you what a circular family chart is, how it works, the best free and customizable templates available, and tips to make your chart both beautiful and easy to read—all while helping you bring your family story to life effortlessly. Read More
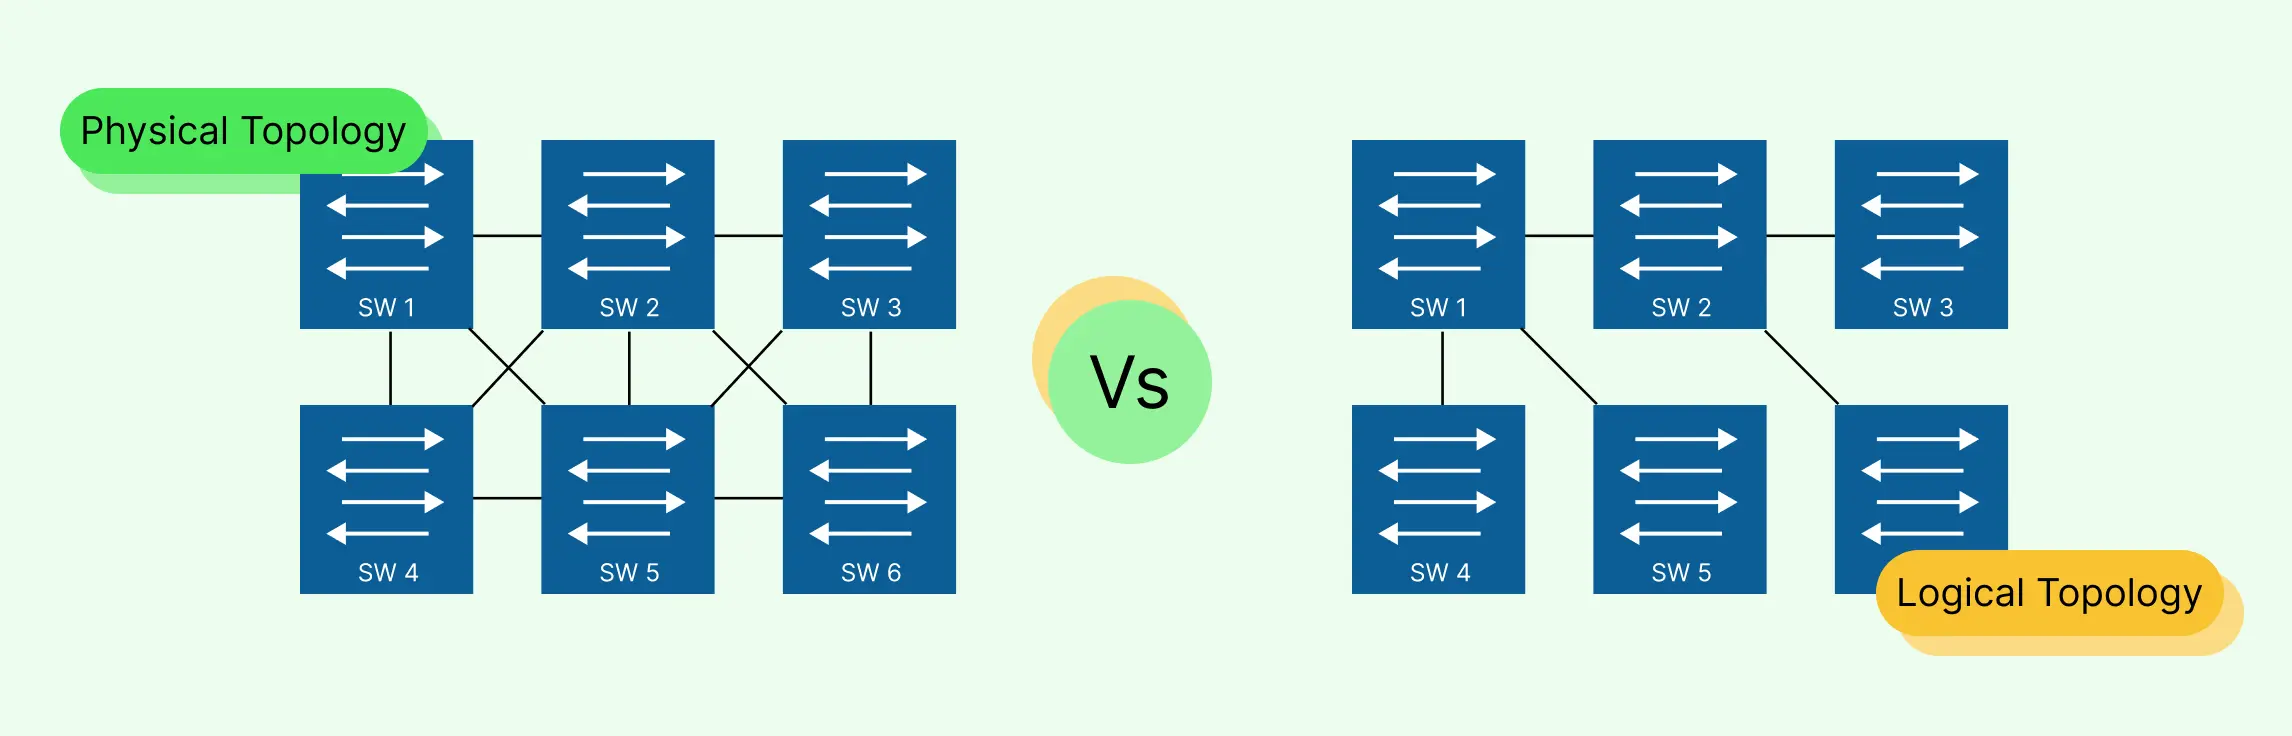
Designing and managing a network can quickly become overwhelming, cables everywhere, unclear data paths, and confusing layouts can leave even experienced IT teams frustrated. That’s why understanding the difference between logical topology vs physical topology is essential. In this guide, we’ll break down physical and logical topologies, explain how they differ, and show you how to create clear, accurate diagrams that save time, reduce errors, and make collaboration effortless. Plus, you’ll discover ready-to-use templates that let you map networks visually without the stress of starting from scratch. Read More
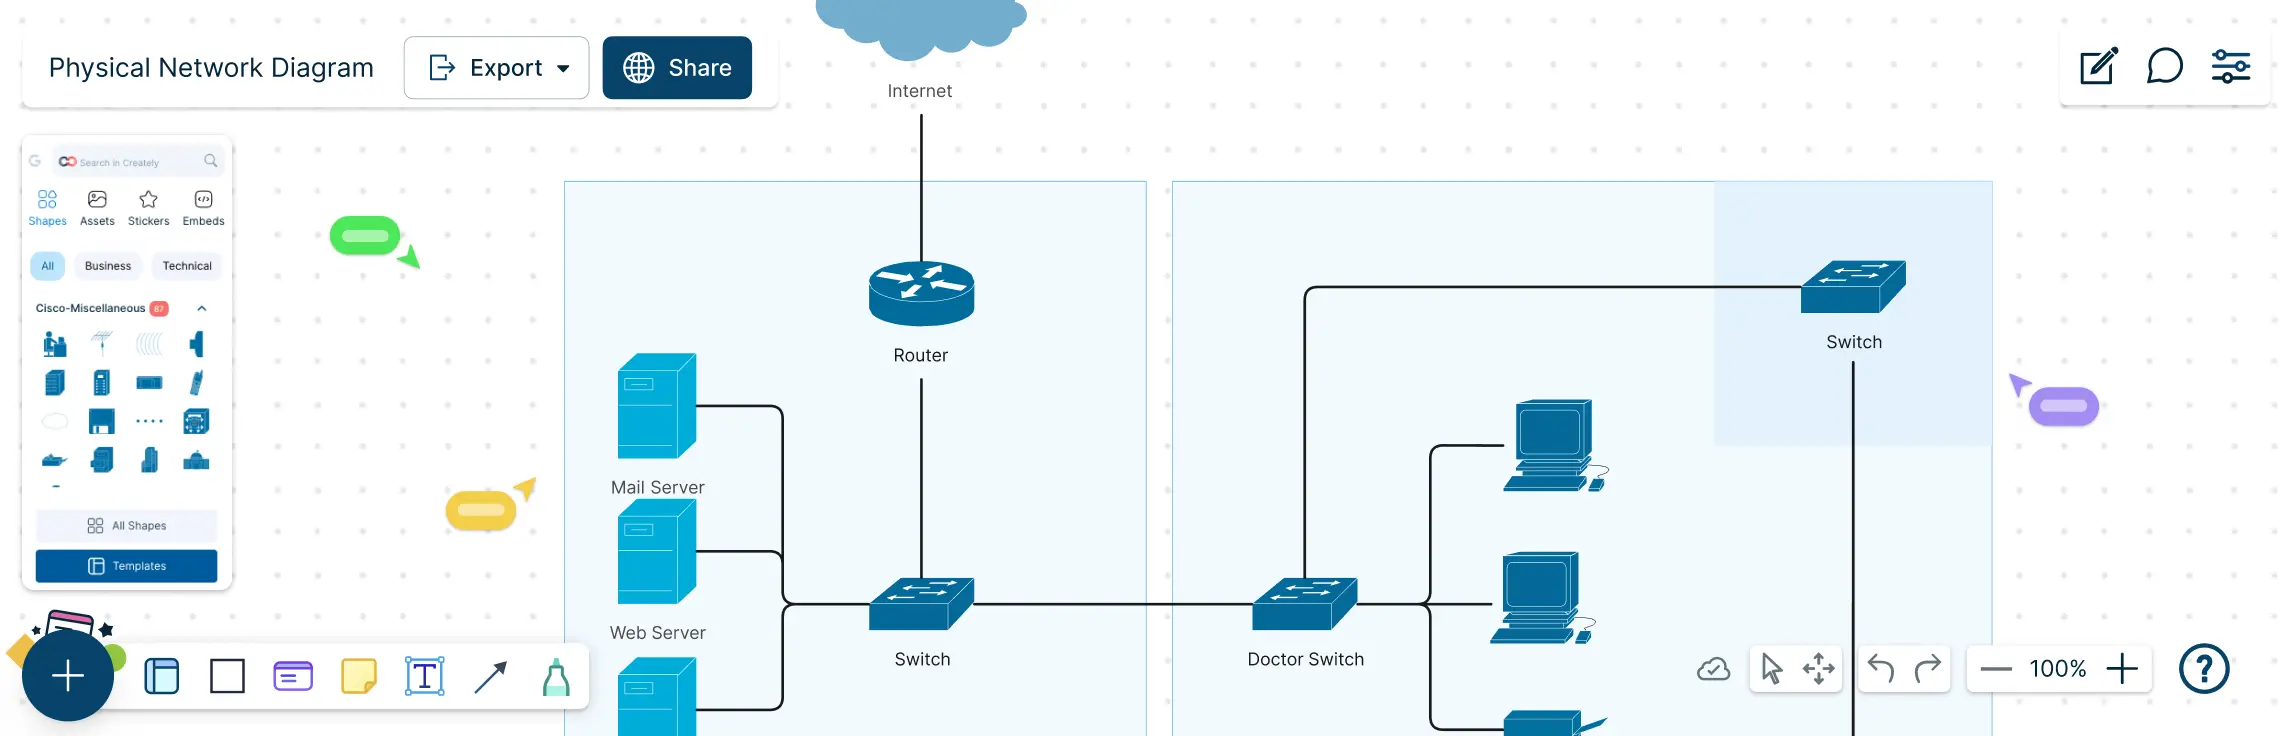
Managing a network without a clear map can feel like navigating a maze blindfolded. Cables tangled, devices misplaced, and troubleshooting taking hours instead of minutes. That’s where a physical network diagram comes in. This guide will show you exactly what a physical network diagram is, why it matters, and how to create one step by step. You’ll also learn about its key components, common topologies, best practices, and ready-to-use templates that make diagramming fast, accurate, and visually intuitive. Read More
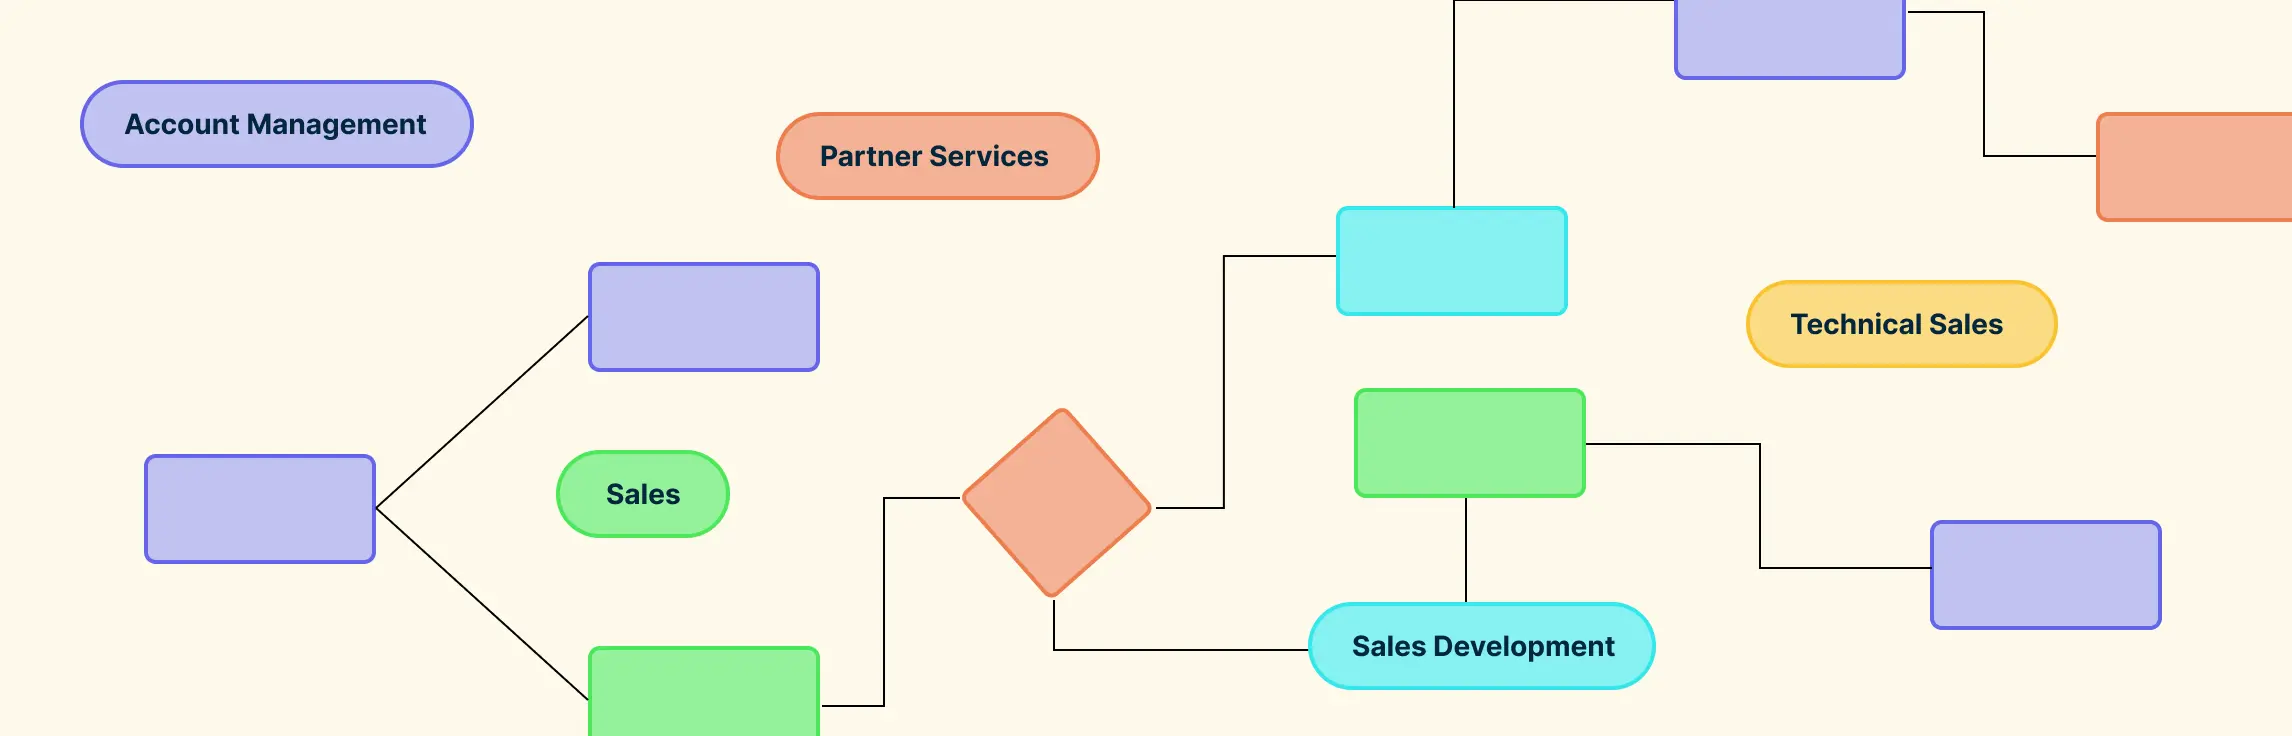
If your sales team feels like it’s constantly chasing leads, juggling scattered workflows, or struggling with slow deal cycles, you’re not alone. Many teams lose valuable time and revenue simply because there’s no clear, shared roadmap for the sales process. That’s where sales process mapping comes in. By visually outlining every step—from lead generation to closing—you can eliminate confusion, align your team, and make your sales workflows faster, clearer, and more effective. In this guide, we’ll walk you through what sales process mapping is, its key components, practical examples, ready-to-use templates, and actionable tips to optimize your sales process for maximum results. Read More
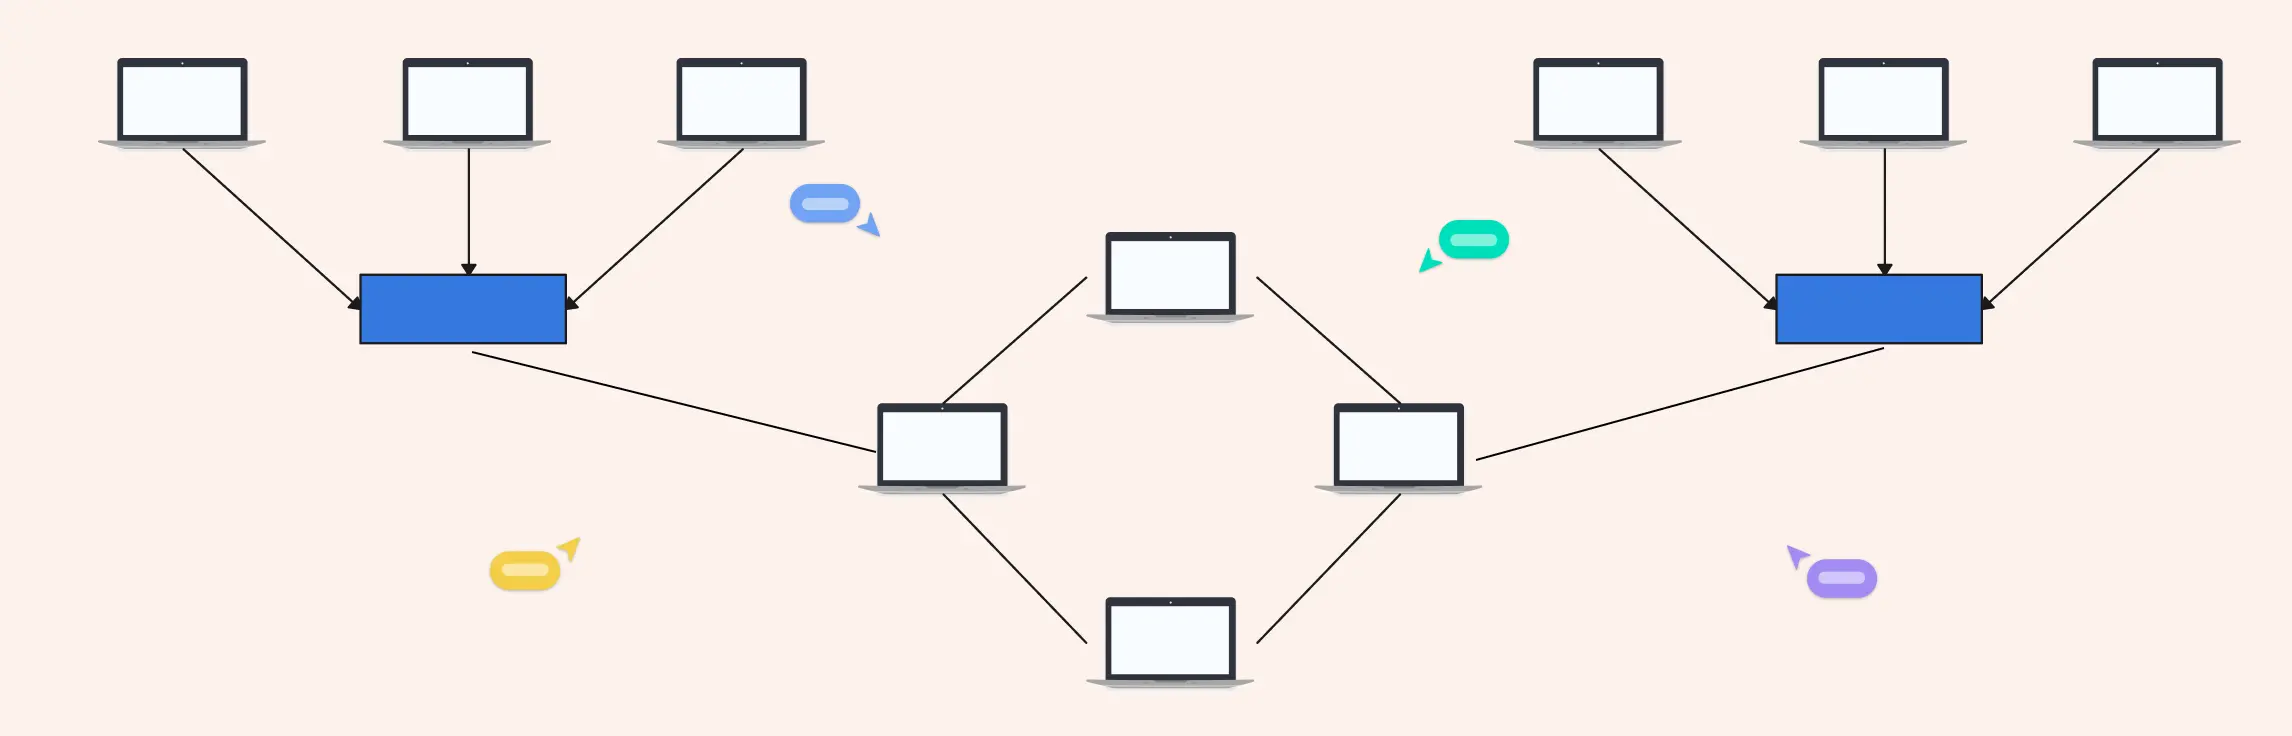
Network topology can feel unnecessarily complex, especially when you’re juggling performance issues, scaling needs, and team alignment at the same time. This guide breaks down star and ring topology in a simple, practical way, without the jargon overload. You’ll learn how each topology works, see real-world examples, understand the difference between star and ring topology, and explore how a star–ring hybrid topology combines the best of both worlds. Read More
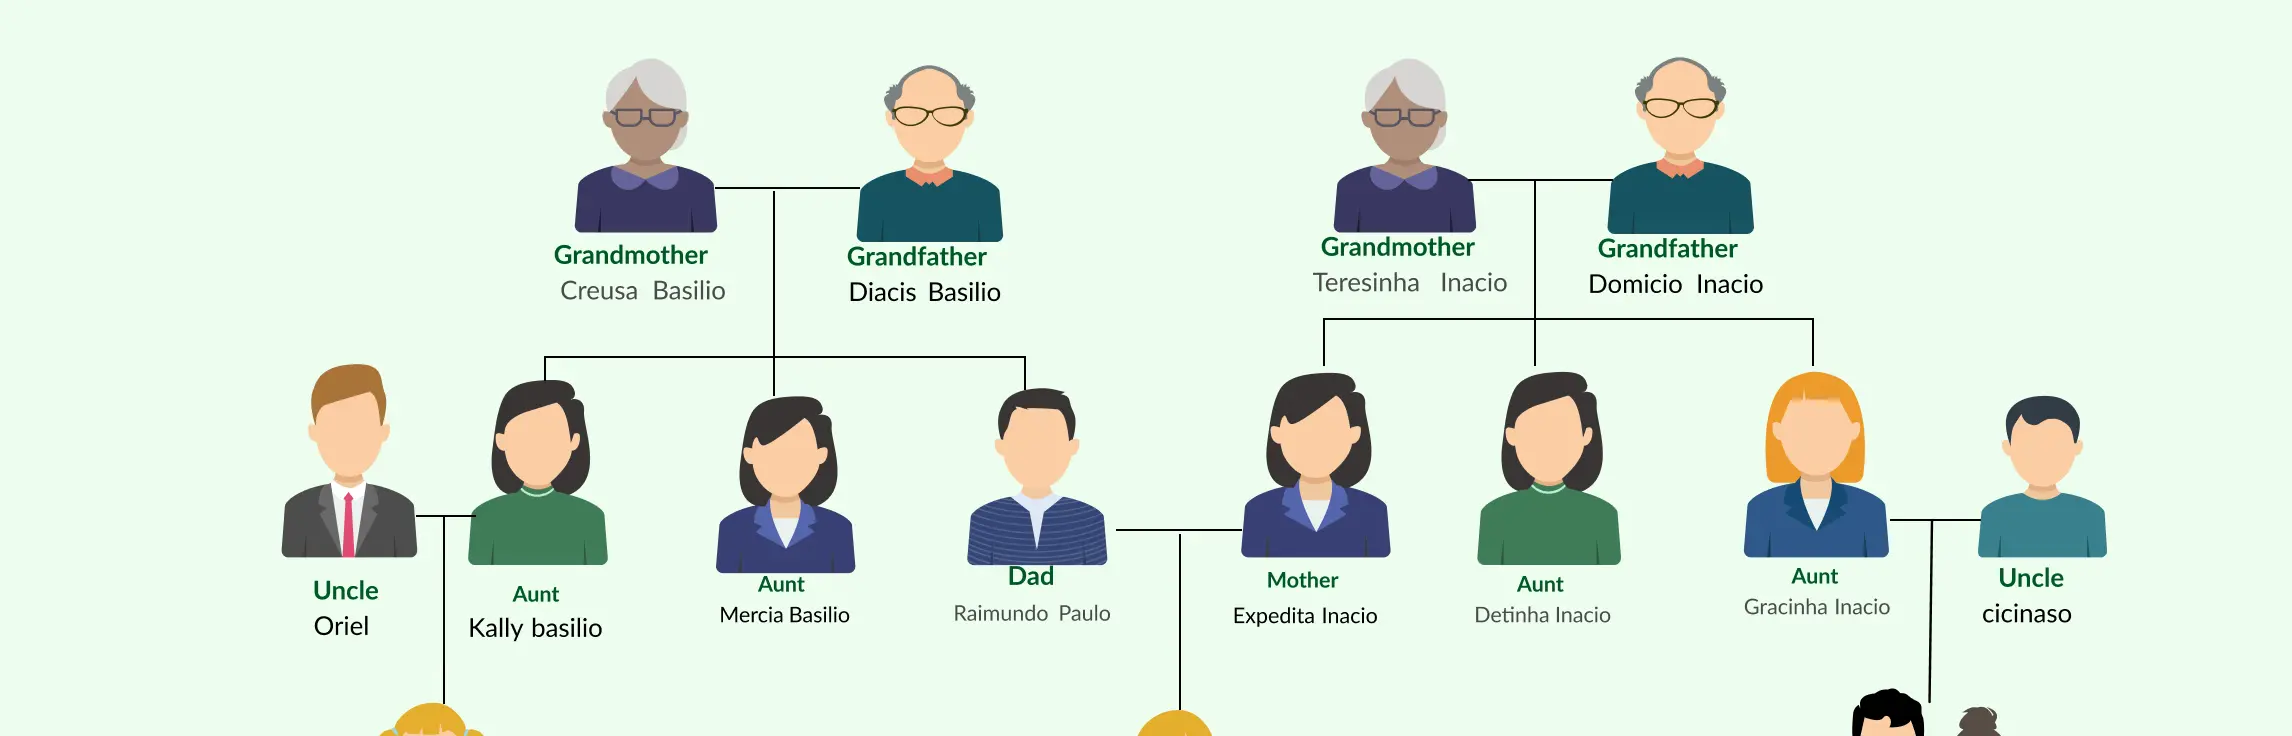
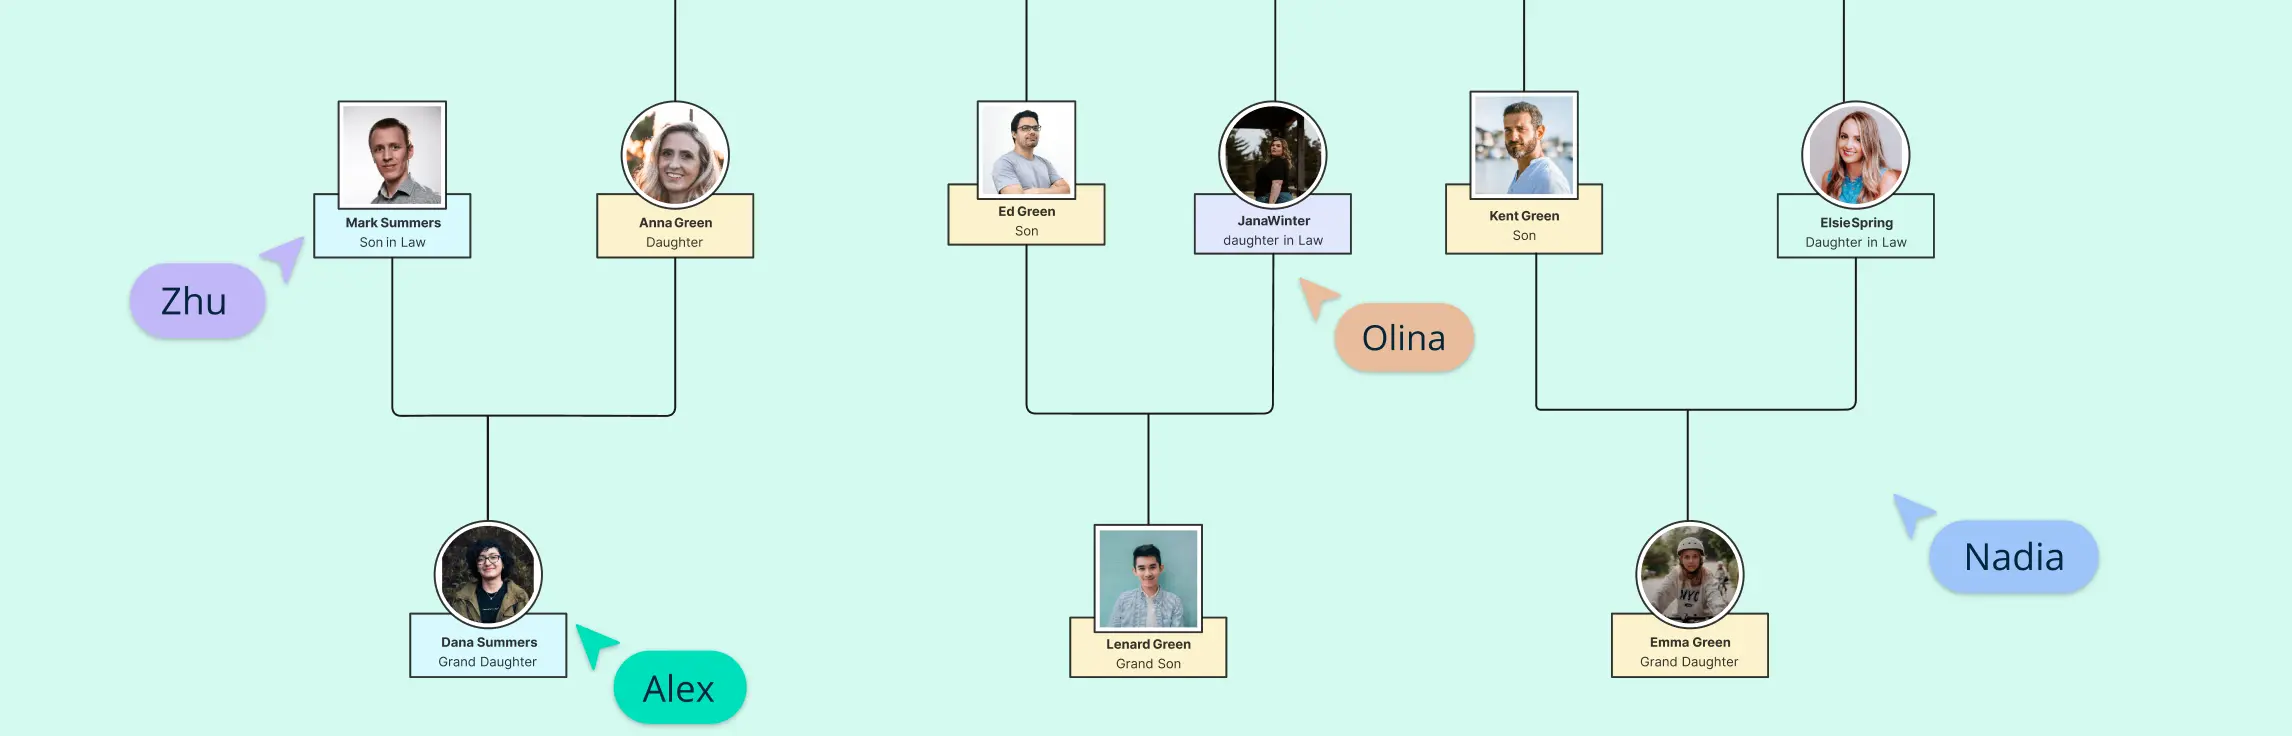
Keeping track of family connections can be confusing; names, relationships, generations, and stories often get scattered across notebooks, emails, or old photo albums. That’s where family trees come in: they turn complicated family histories into a clear, visual map that’s easy to understand. In this guide, we’ll explore the different types of family trees, why each format exists, and how to choose the right one for your purpose. Read More
Managing a network that spans multiple departments, locations, or devices can feel like juggling puzzle pieces in the dark. That’s where a hybrid topology diagram comes in. By visually mapping how different network topologies connect and work together, you can turn chaos into clarity. This guide will walk you through what hybrid topology diagrams are, explore the types and examples, highlight advantages and disadvantages, provide a step-by-step creation process, and share best practices to make your diagrams clear, scalable, and actionable. Read More
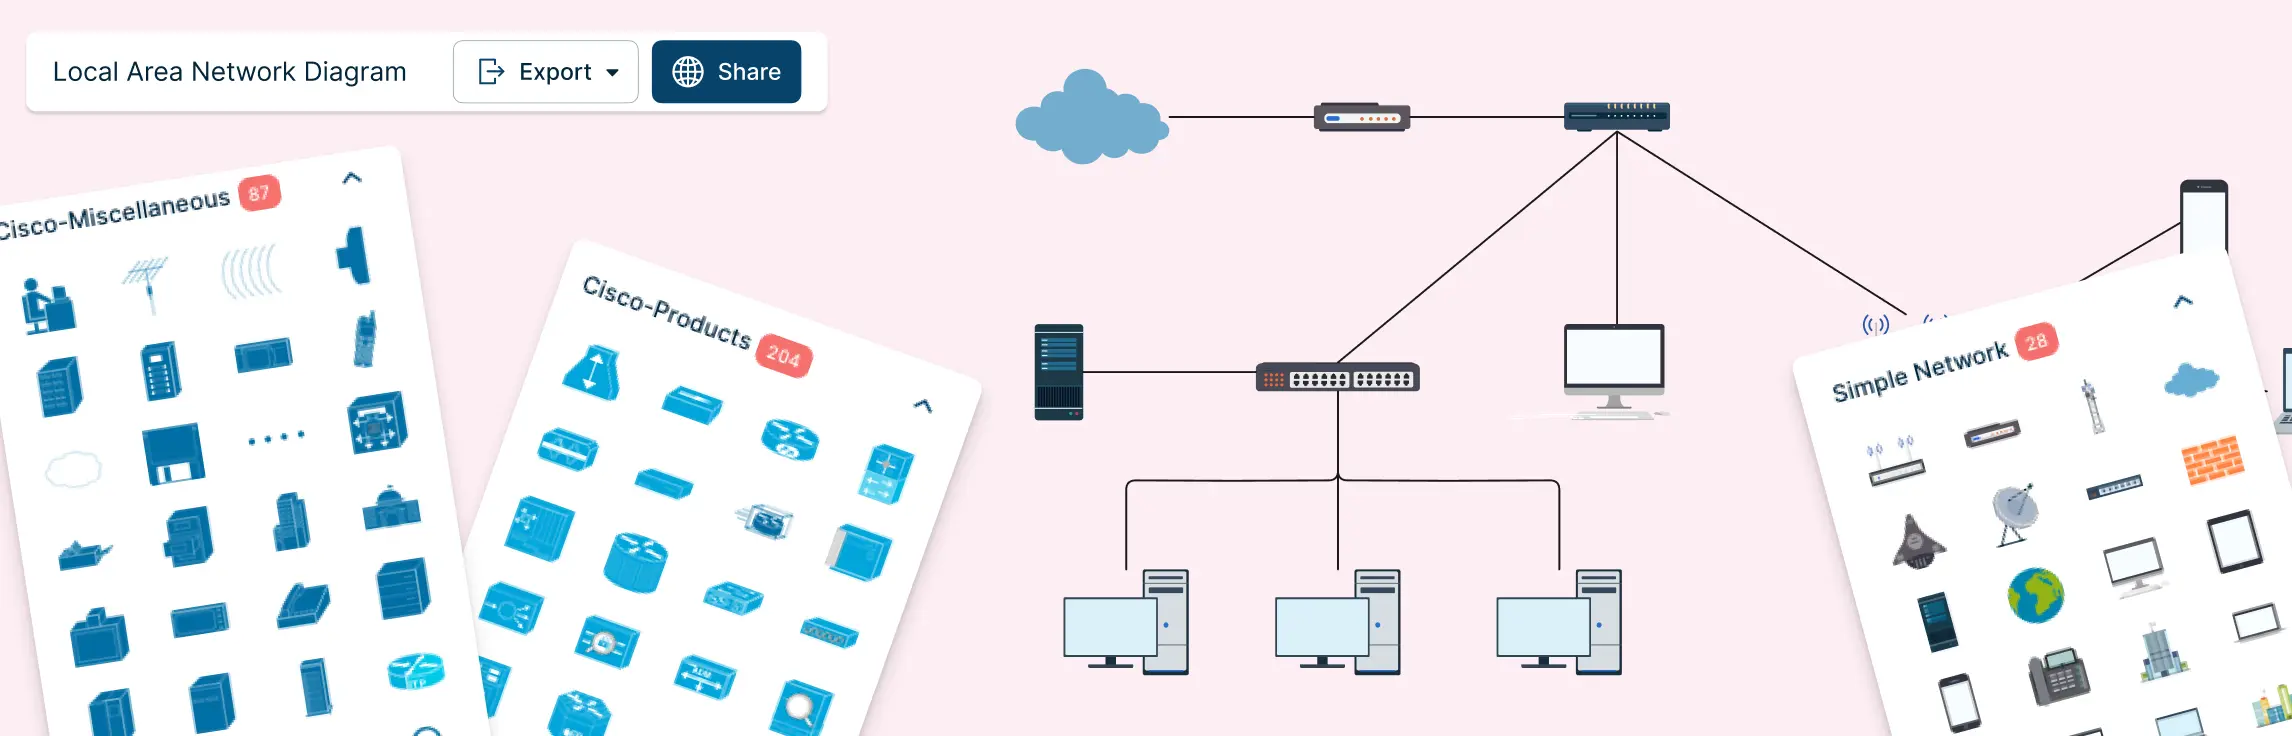
If you’ve ever tried to understand a network setup by staring at a jumble of cables, spreadsheets, or half-erased whiteboard sketches, you know the frustration. Devices are connected, something breaks, and suddenly no one knows what connects to what—or why. That’s exactly where a local area network diagram makes all the difference. Read More
Ever stared at a tangled web of network devices, cables, and subnets and thought, “How does any of this actually work?” Managing a network without a clear visual plan can be frustrating, time-consuming, and prone to costly errors. That’s why a logical network diagram is a game-changer. In this guide, we’ll cover what a logical network diagram is, how it differs from a physical network diagram, why it’s useful, and how to create one, including ready-to-use templates and best practices to streamline your workflow. Read More
Ever felt like your team’s workflows are trapped in endless loops of emails, approvals, and missed connections? Traditional hierarchies can make communication slow, collaboration clunky, and decision-making frustratingly rigid. That’s where a circular organization structure comes in. By reimagining how teams and leadership connect, this model replaces rigid layers with a fluid, visual system where authority and communication flow naturally in circles. Read More
Traditional organizational hierarchies often leave teams frustrated, decisions get stuck in approval loops, responsibilities overlap, and clarity is lost across departments. Enter the holacratic structure: a modern, role-based approach that distributes authority, clarifies responsibilities, and makes decision-making faster. Read More
Ever feel like your team’s workflows are scattered across endless emails, spreadsheets, and half-finished diagrams? Enter the line and staff organization, a structure designed to bring clarity, balance authority with expertise, and make your team’s reporting lines crystal clear. Read More
Managing a large organization can sometimes feel like juggling too many balls at once, products, services, regions, and teams all pulling in different directions. When workflows get scattered, decision-making slows down, and accountability becomes murky, frustration sets in. This is where a multidivisional structure comes to the rescue. In this guide, we’ll explore what a multidivisional structure is, its key features, advantages, and challenges, and provide practical templates for visualizing your organization. Read More
Ever feel like your team is stuck in endless email chains, unclear reporting lines, and scattered workflows? Traditional hierarchies can slow decision-making, stifle collaboration, and make it hard to respond quickly to change. That’s where a network structure comes in. Designed for modern, agile teams, this organizational approach emphasizes flexibility, decentralized decision-making, and strong connections between people and functions. Read More
Feeling frustrated with scattered workflows, duplicated tasks, and unclear responsibilities? Many modern teams struggle to keep work flowing smoothly when traditional hierarchies or functional silos get in the way. By organizing your team around end-to-end workflows instead of just job titles or departments, this approach brings clarity, speed, and accountability to your operations. In this guide, we’ll explore what a process-based organizational structure is, its key features, real-world examples, and templates you can use to visualize and streamline your team’s work. Read More
Struggling with scattered workflows, unclear reporting lines, or overlapping responsibilities? Many growing organizations face the same challenge: as teams expand, keeping everyone aligned becomes a complex puzzle. A divisional structure can be the solution, breaking your company into focused, semi-independent units based on products, regions, or customer segments. In this guide, we’ll explore what a divisional structure is, its key features, practical examples, and how you can visualize your divisions with org charts using Creately, so your teams stay connected, accountable, and ready to move fast. Read More
Building an organization without a clear structure often feels like juggling a dozen balls at once, teams overlap, responsibilities blur, and important tasks slip through the cracks. That’s where a functional structure comes in. By grouping employees based on their skills and responsibilities, a functional structure creates clarity, accountability, and efficiency. This guide will break down everything you need to know about functional structures, from their key characteristics, advantages, and disadvantages to real-world examples and ready-to-use functional structure org chart templates. By the end, you’ll have the insight and tools to design a structure that keeps your teams aligned, productive, and ready to scale. Read More
Starting a family tree drawing can feel overwhelming—messy notes, missing names, and multiple scattered versions can make it hard to see the bigger picture. That’s where a family tree poster comes in: it organizes your family’s history in a clear, visual way, connecting generations and preserving heritage for years to come. In this guide, we’ll show you exactly how to make a family tree poster step by step, with practical tips, inspiring poster ideas, and ready-to-use Creately templates to help you create a beautiful, shareable family tree without the stress. Read More
Ever tried tracing your family history only to end up with a tangle of names, dates, and scattered notes that make your head spin? That’s where family tree software comes in, transforming a chaotic jumble of facts into a clear, organized, and interactive family tree that’s easy to explore and share. Read More
Family therapy can be messy. Multigenerational patterns, hidden loyalties, unspoken debts, and conflicting expectations often leave both clients and therapists feeling overwhelmed. That’s where contextual family therapy shines, it provides a structured, ethically grounded approach to understanding fairness, trust, and accountability across generations. In this guide, we’ll explore the core concepts, dimensions, and practical techniques of contextual family therapy, while showing how visual tools like genograms and family trees can help therapists map complex relationships, reduce overwhelm, and bring clarity to even the most complicated family systems. Read More
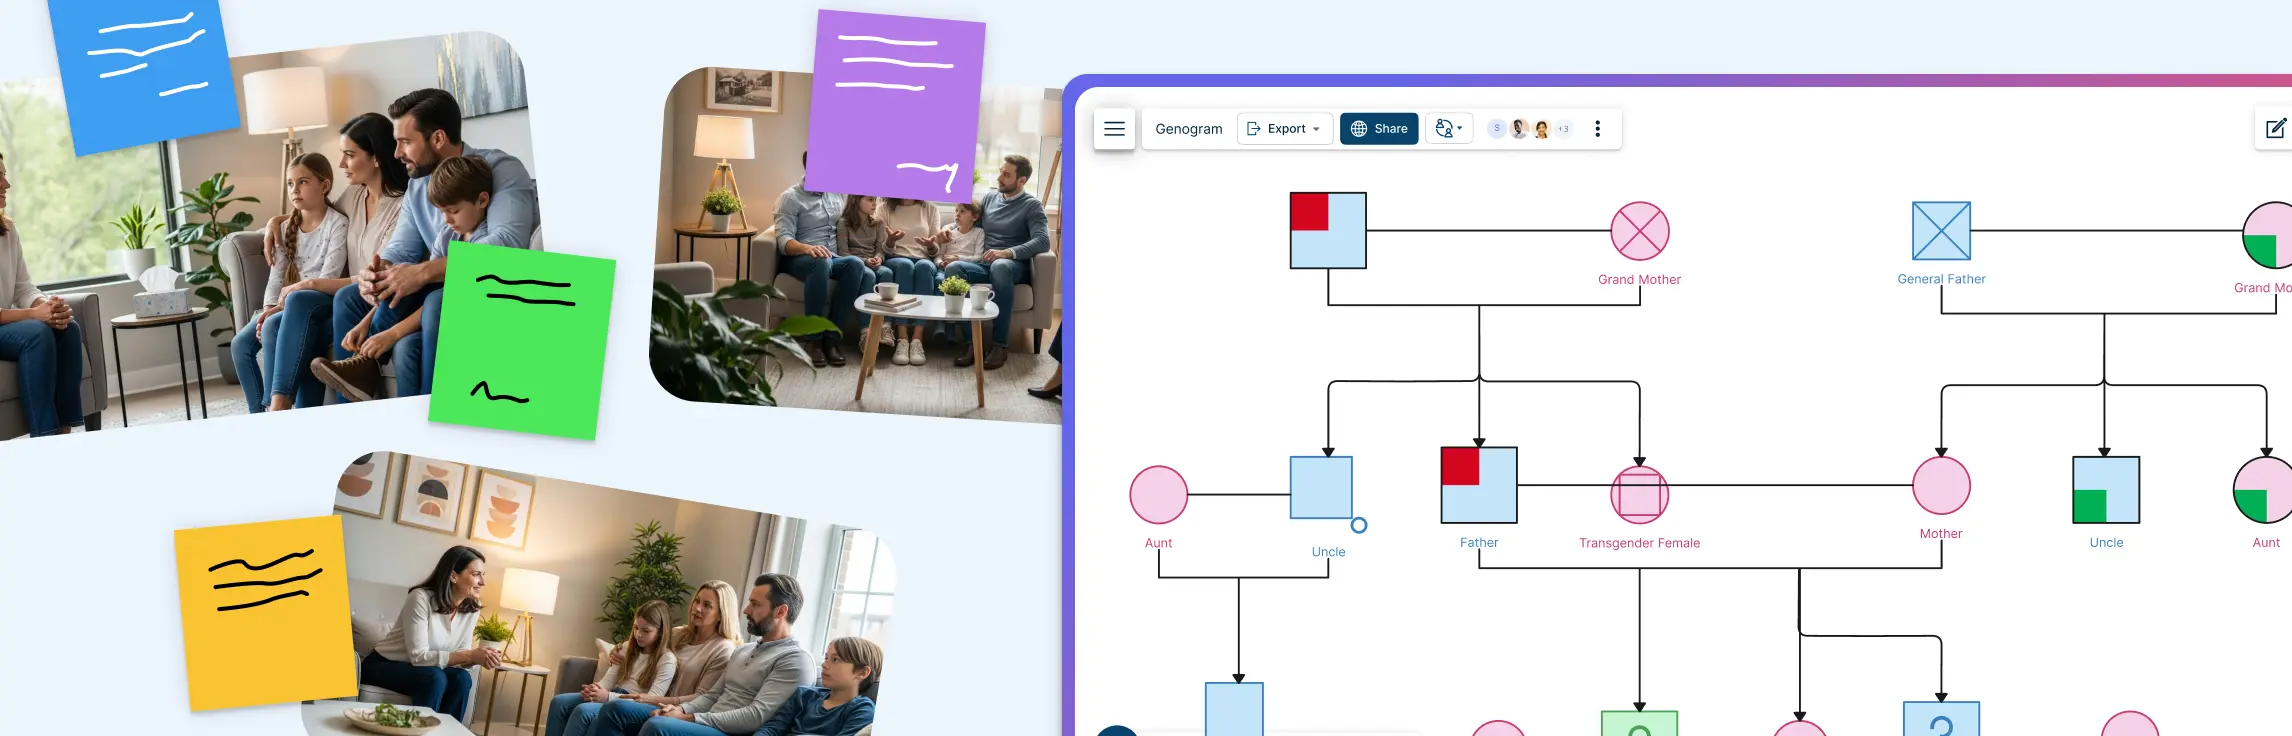
Therapy sessions can quickly become overwhelming when notes are scattered, family patterns are hard to decode, and critical context is missing. That’s where genograms in therapy come in. These visual maps go beyond traditional family trees, revealing relationships, emotional dynamics, and intergenerational patterns in a way that’s fast, intuitive, and actionable. In this guide, we’ll explore what genograms are, why they’re so useful, the key elements that make them effective, practical ways to use them in therapy sessions, and how tools like Creately simplify the process, helping therapists and clients gain clarity, insight, and meaningful breakthroughs. Read More
Juggling scattered notes, multiple therapy models, and complex family dynamics can be frustrating. Integrative family therapy streamlines this process by combining approaches like CBT, narrative, and attachment-focused methods. With visual tools such as genograms, family maps, and timelines, therapists can quickly uncover patterns, track progress, and deliver personalized care, bringing clarity, speed, and insight to every session. Read More
Therapists often struggle with scattered notes, fragmented stories, and the challenge of making sense of complex family dynamics. Narrative family therapy offers a structured, empowering approach that helps families reframe their stories, uncover patterns, and build stronger connections. By combining this approach with visual tools like genograms and eco-maps, therapy sessions become clearer, faster, and far more actionable, turning abstract problems into insights that families can see, understand, and act on. Read More
Working with families can be rewarding, but it often comes with frustrations. Scattered notes, complex family histories, and hard-to-track patterns can make therapy feel overwhelming. That’s where family therapy models come in. They provide structured approaches to understanding relationships, resolving conflicts, and promoting healthier dynamics. Read More
If you’ve ever felt overwhelmed by scattered notes, complex family stories, or the challenge of tracking relationships in therapy, you’re not alone. Many therapists, social workers, and educators struggle to make sense of intricate family dynamics without a clear visual approach. Functional Family Therapy helps improve communication, address behavioral challenges, and strengthen family dynamics, but even proven techniques are easier to apply with a clear visual approach. Genograms and family trees turn scattered notes into actionable insights, saving time, reducing frustration, and helping families build stronger, healthier connections. Read More
Therapists and students often feel overwhelmed by scattered case notes and complex family dynamics, making it hard to plan effective interventions quickly. This guide breaks down Strategic vs Structural Family Therapy in a clear, approachable way, helping you understand the purpose, techniques, and differences between the two models. You’ll also discover how visual mapping tools like genograms and family tree diagrams can simplify session prep, reveal patterns at a glance, and make your workflow faster and more organized. With Creately’s intuitive templates, creating these visual maps becomes effortless, so you can focus on what truly matters: guiding families toward healthier, functional relationships. Read More
When you’re working with complex family histories, scattered case notes and long, tangled stories can make it nearly impossible to see the bigger picture. Therapists often feel the frustration firsthand, trying to track emotional legacies, repeating roles, and intergenerational trauma without a clear visual map. Transgenerational Therapy offers a powerful way to understand how patterns move across generations, and when paired with tools like genograms, the work becomes even clearer and more actionable. This guide walks you through the core concepts, models, and patterns behind this approach, plus how modern tools make it easier to support your clients with clarity and confidence. Read More
Ever feel overwhelmed trying to make sense of a client’s family story? Between scattered notes, overlapping relationships, and complex patterns, it can feel like you’re trying to solve a puzzle without all the pieces. That’s where family mapping comes in. A family map turns messy, hard-to-track information into a clear, visual representation of relationships, behaviors, and generational patterns. With family mapping, you can see the connections at a glance, spot recurring issues, and plan your sessions with confidence, without getting lost in paperwork. Read More
Ever feel like your family keeps hitting the same communication roadblocks, no matter how many meetings or discussions you have? You’re not alone. Whether it’s repeated misunderstandings at home or scattered workflows at work, it can be frustrating when patterns keep repeating and clarity feels out of reach. Read More
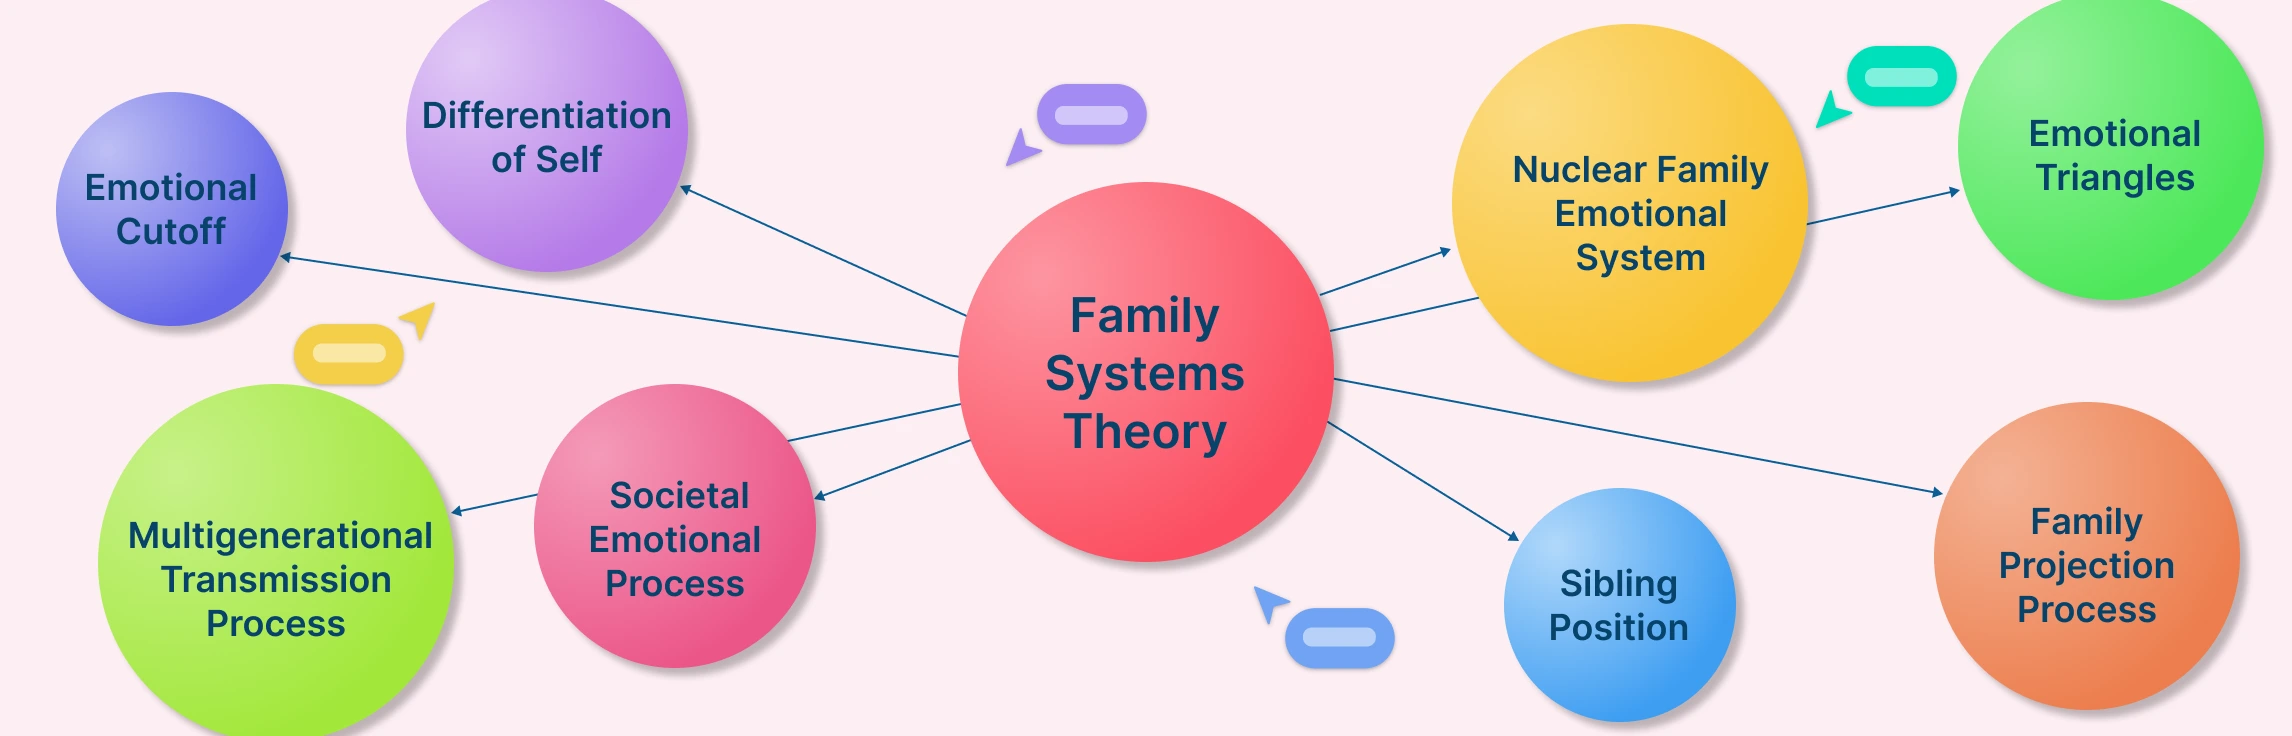
Families are complex systems where every member’s behavior can influence the whole. Yet, trying to understand patterns, roles, and intergenerational dynamics can feel overwhelming, especially without a clear visual tool. Family systems theory offers a framework to make sense of these relationships, and when combined with genograms, it becomes easier to map patterns, roles, and emotional connections across generations. Read More
Ever felt like different parts of you are constantly at odds; one side wanting change while another resists it? That inner conflict is something most people experience, and it’s exactly what internal family systems therapy (IFS therapy) seeks to heal. In this quick guide, we’ll explore what the IFS model is, how it works, its key concepts, benefits, and how tools like genograms can enhance therapy sessions for both individuals and mental health professionals. Read More
Every family has invisible patterns that shape how its members connect, communicate, and resolve conflict. Therapists often uncover these dynamics using visual tools like genograms, which map relationships, boundaries, and emotional patterns across generations. Rooted in structural family therapy, a model developed by Salvador Minuchin, this approach views the family as a living system with distinct structures and subsystems that influence behavior and well-being. By understanding these structures, therapists can identify where boundaries blur, hierarchies break, or roles overlap, leading to stress and dysfunction. Read More
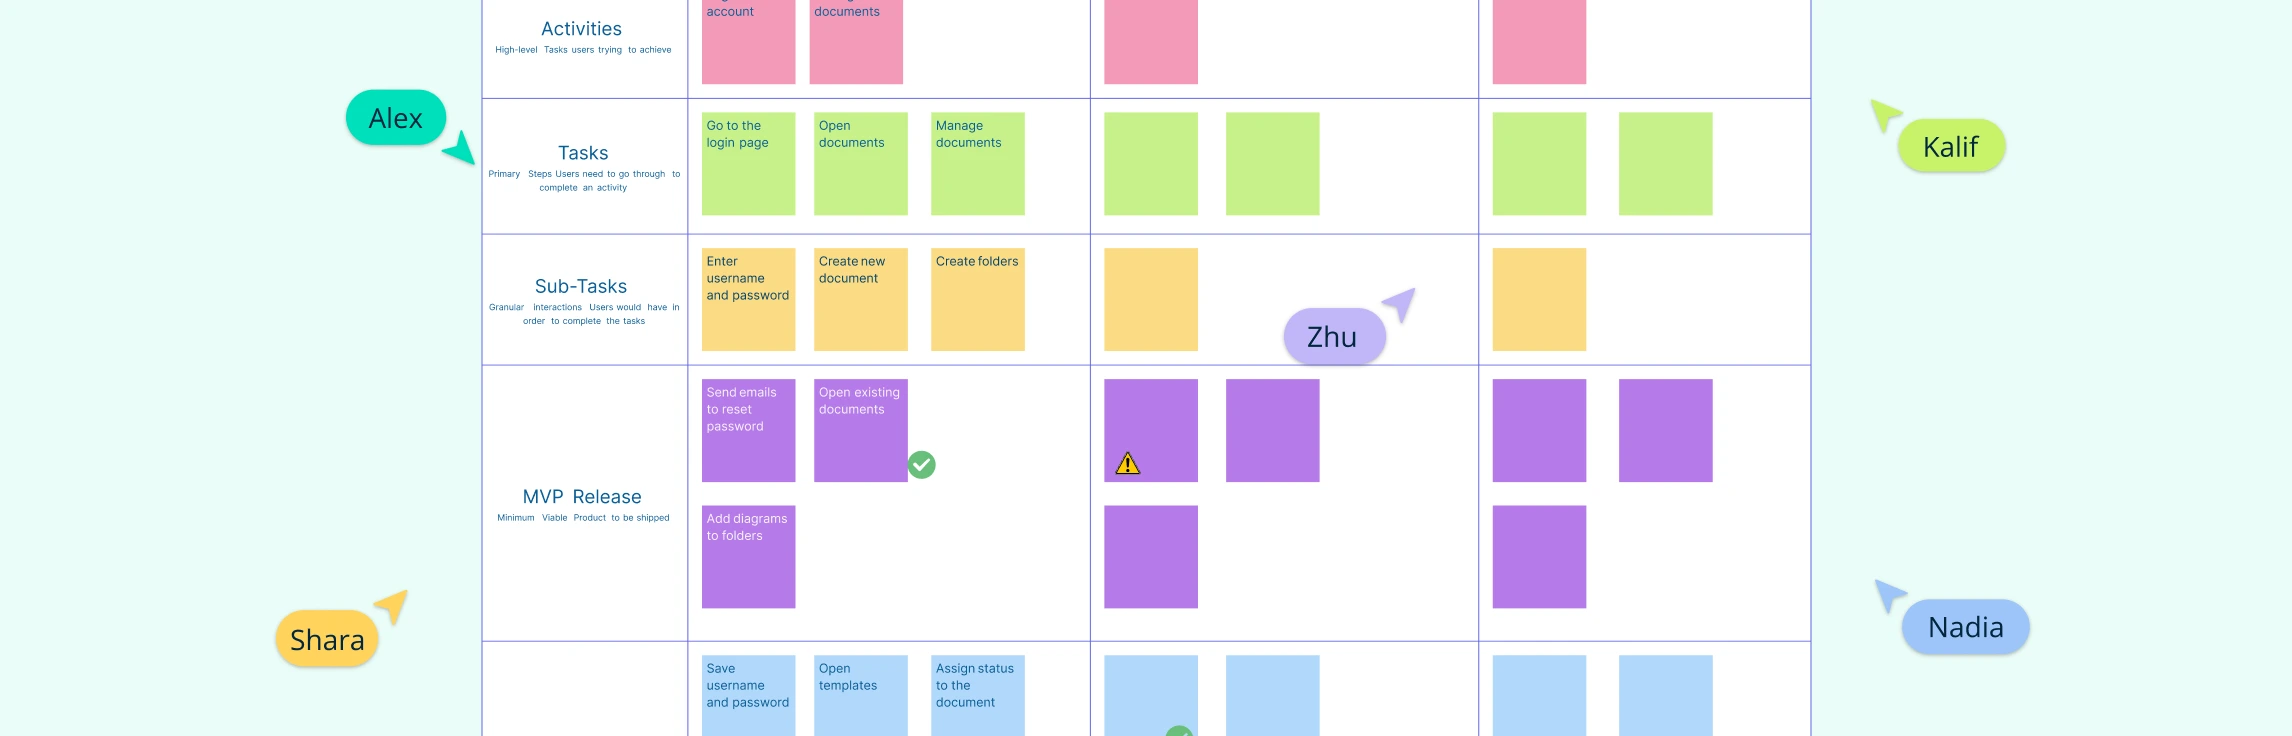
Ever felt like your sprint planning sessions turn into a maze of post-its, whiteboard sketches, and endless debates? Teams know what they want to build but struggle to see how all the pieces fit together. Product backlogs grow messy, priorities get lost, and alignment slips between design, dev, and stakeholders. Read More
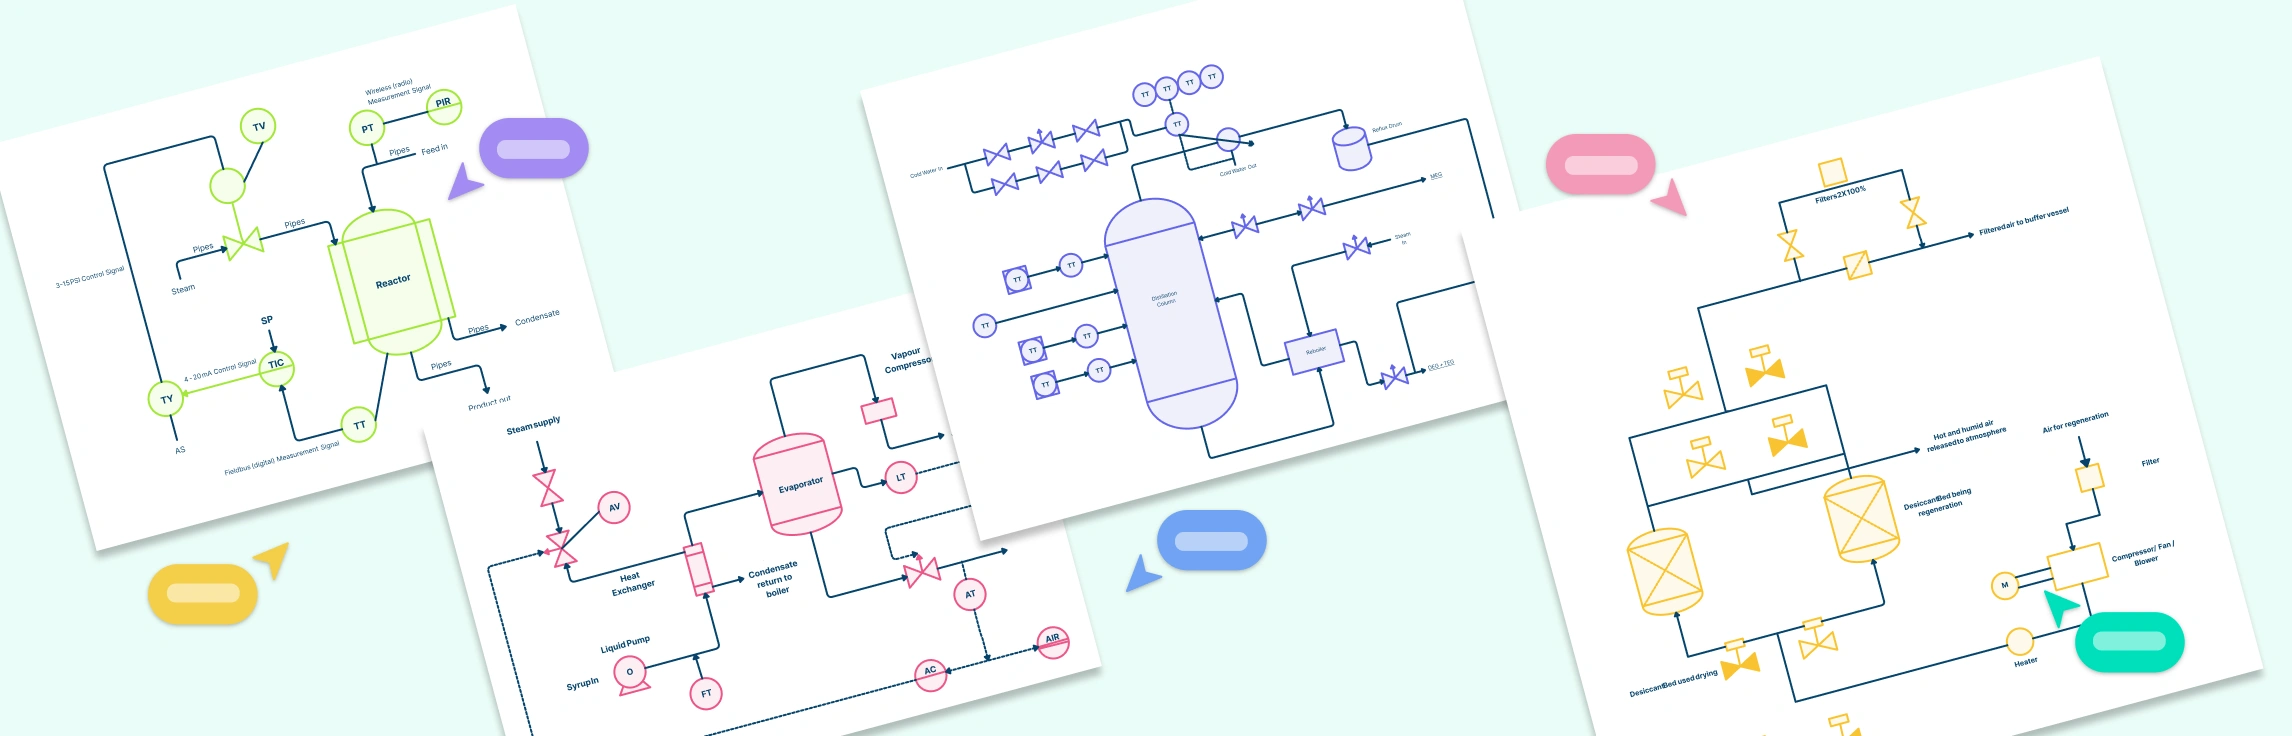
Piping and Instrumentation Diagrams (P&IDs) are essential tools in process engineering, helping professionals visualize systems, monitor controls, and optimize workflows. Whether you’re designing a chemical reactor, managing a heat exchanger, or planning large-scale production processes, having clear and accurate P&ID examples can save time and reduce errors. Read More
As your system designs grow more complex, your sequence diagrams can quickly become cluttered with repeated interactions and overlapping lifelines. If you’ve ever found yourself redrawing the same sequences across multiple diagrams or struggling to keep everything consistent, you’re not alone. That’s where the interaction occurrence in UML 2 comes in, a powerful tool that helps you simplify, reuse, and organize complex interactions effortlessly. In this guide, we’ll explore what an interaction occurrence is, how it works, and why it’s essential for creating scalable, easy-to-maintain UML models. Read More
When working on complex systems, sequence diagrams can quickly turn into a tangled web of interactions, especially when multiple components or subsystems need to communicate. If you’ve ever found yourself squinting at overlapping message lines or losing track of how data moves between diagrams, you’re not alone. That’s where sequence diagram gates come in. These clever UML elements simplify message passing between diagrams, helping you keep your models clean, modular, and easy to understand. In this guide, we’ll break down what sequence diagram gates are, how they work, and how you can use them to create clearer, more efficient UML diagrams. Read More
In today’s fast-paced digital systems, tasks rarely happen one at a time. Whether it’s an online booking system checking seat availability while processing payments, or an app updating data while sending notifications, concurrency is everywhere. Yet, many UML designers struggle to clearly represent these simultaneous operations. That’s where sequence diagram parallel tasks come in. By using the parallel combined fragment, you can model concurrent processes visually, making your system design more accurate, efficient, and easy to understand. Read More
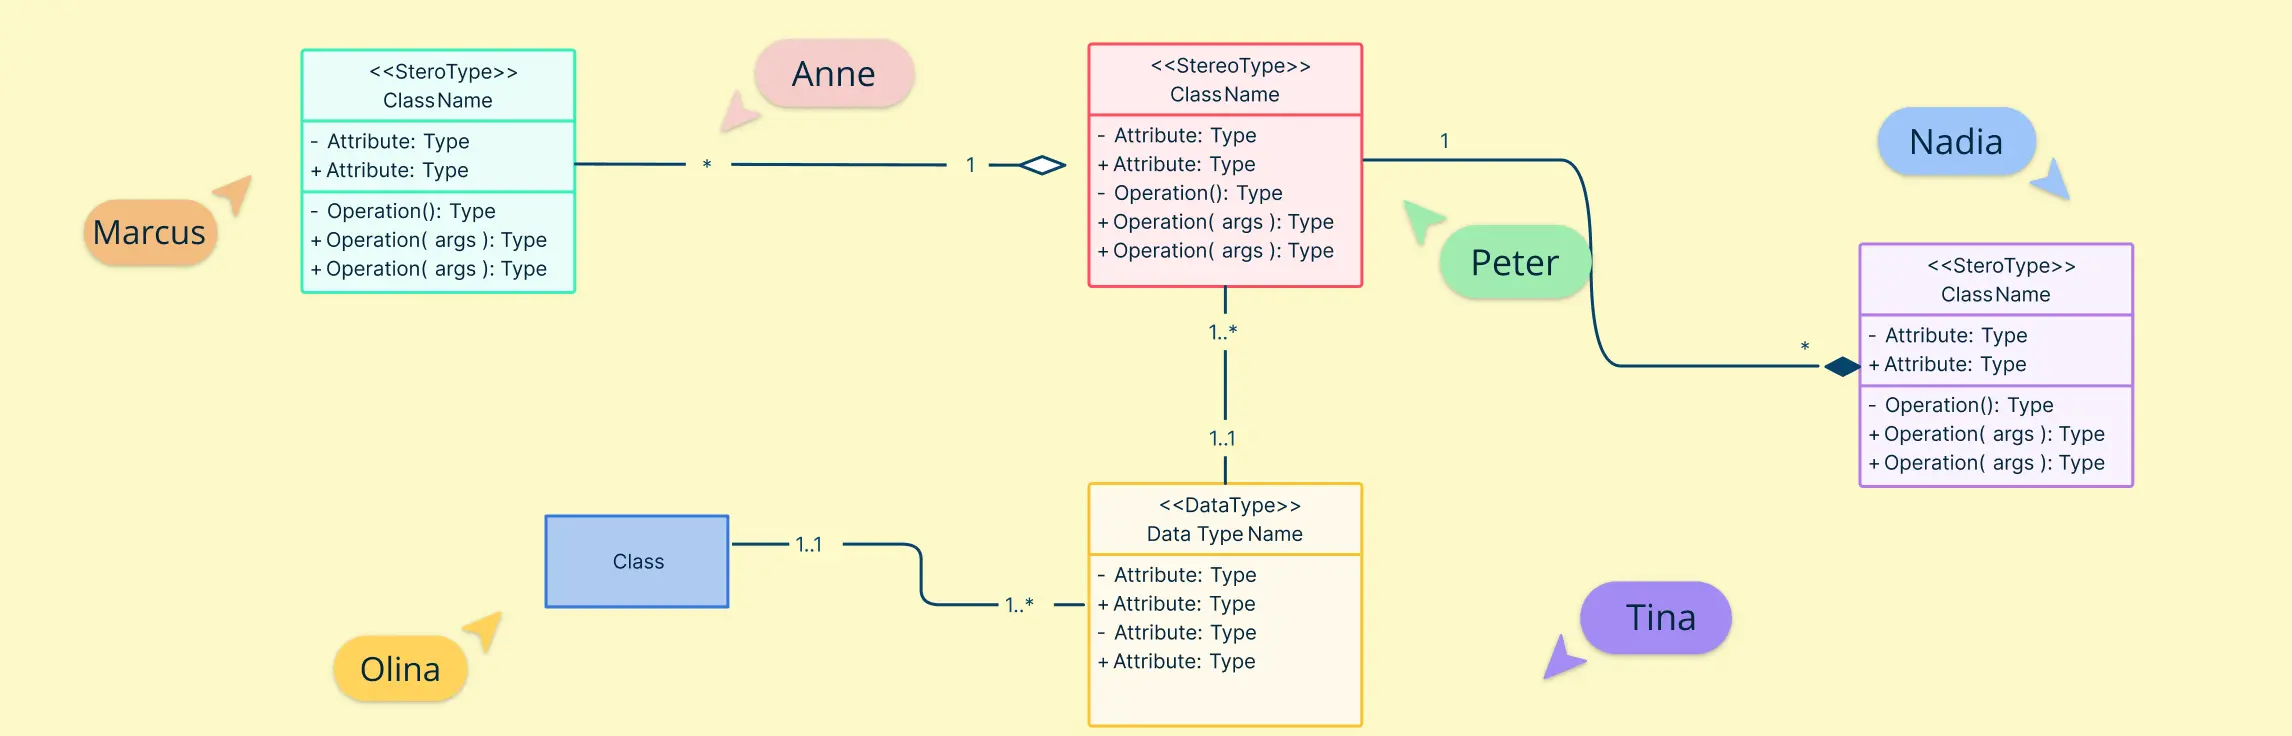
Class diagrams are a fundamental part of UML notation, used to model the static structure of a system, including classes, interfaces, relationships, inheritance, and object interactions. Whether you’re a beginner or an experienced developer, having a UML Class Diagram Cheat Sheet ensures your diagrams are clear, consistent, and easy to understand. Read More
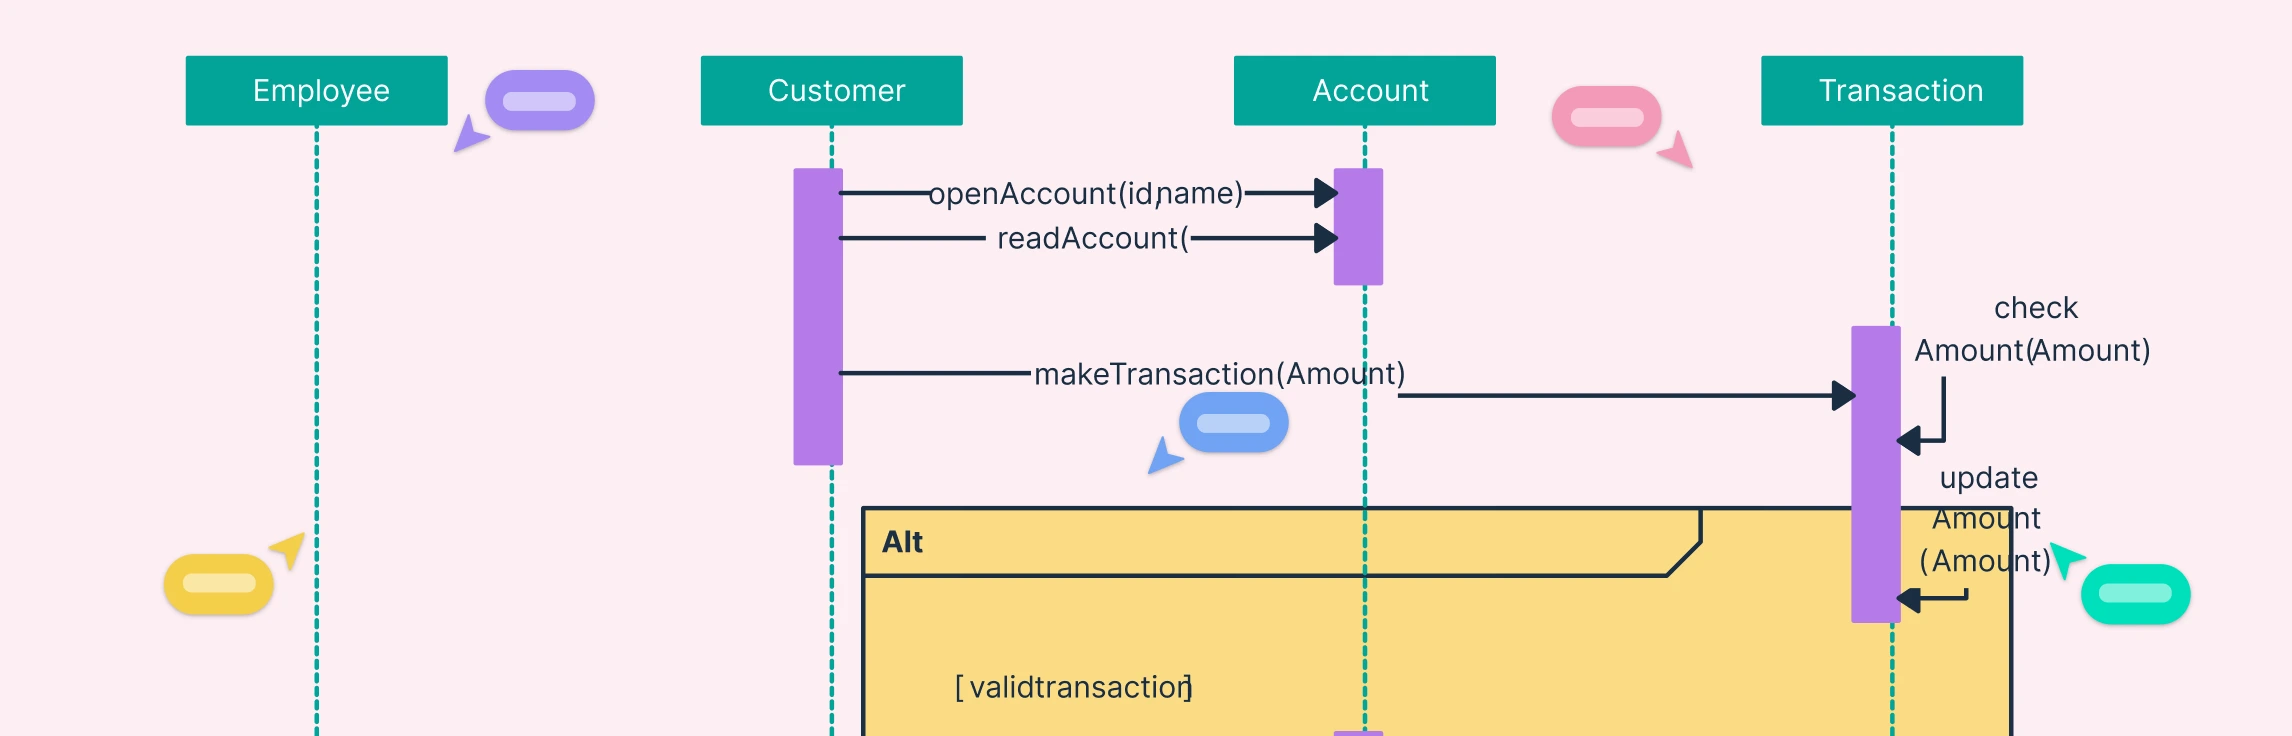
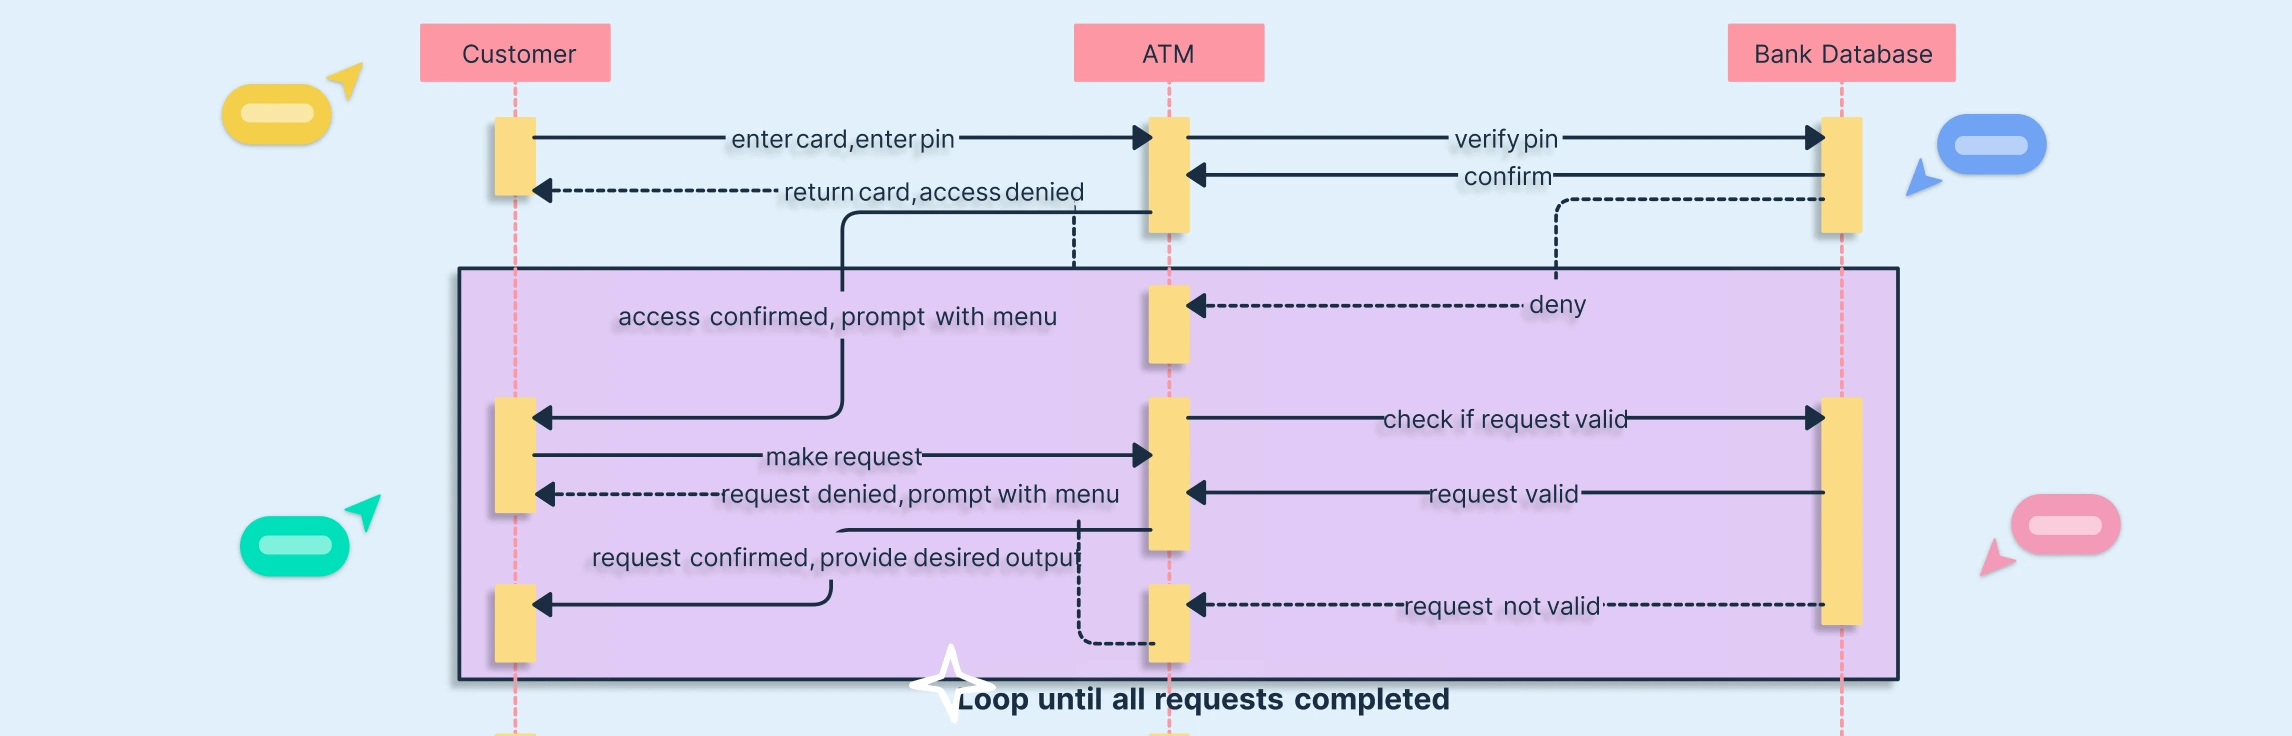
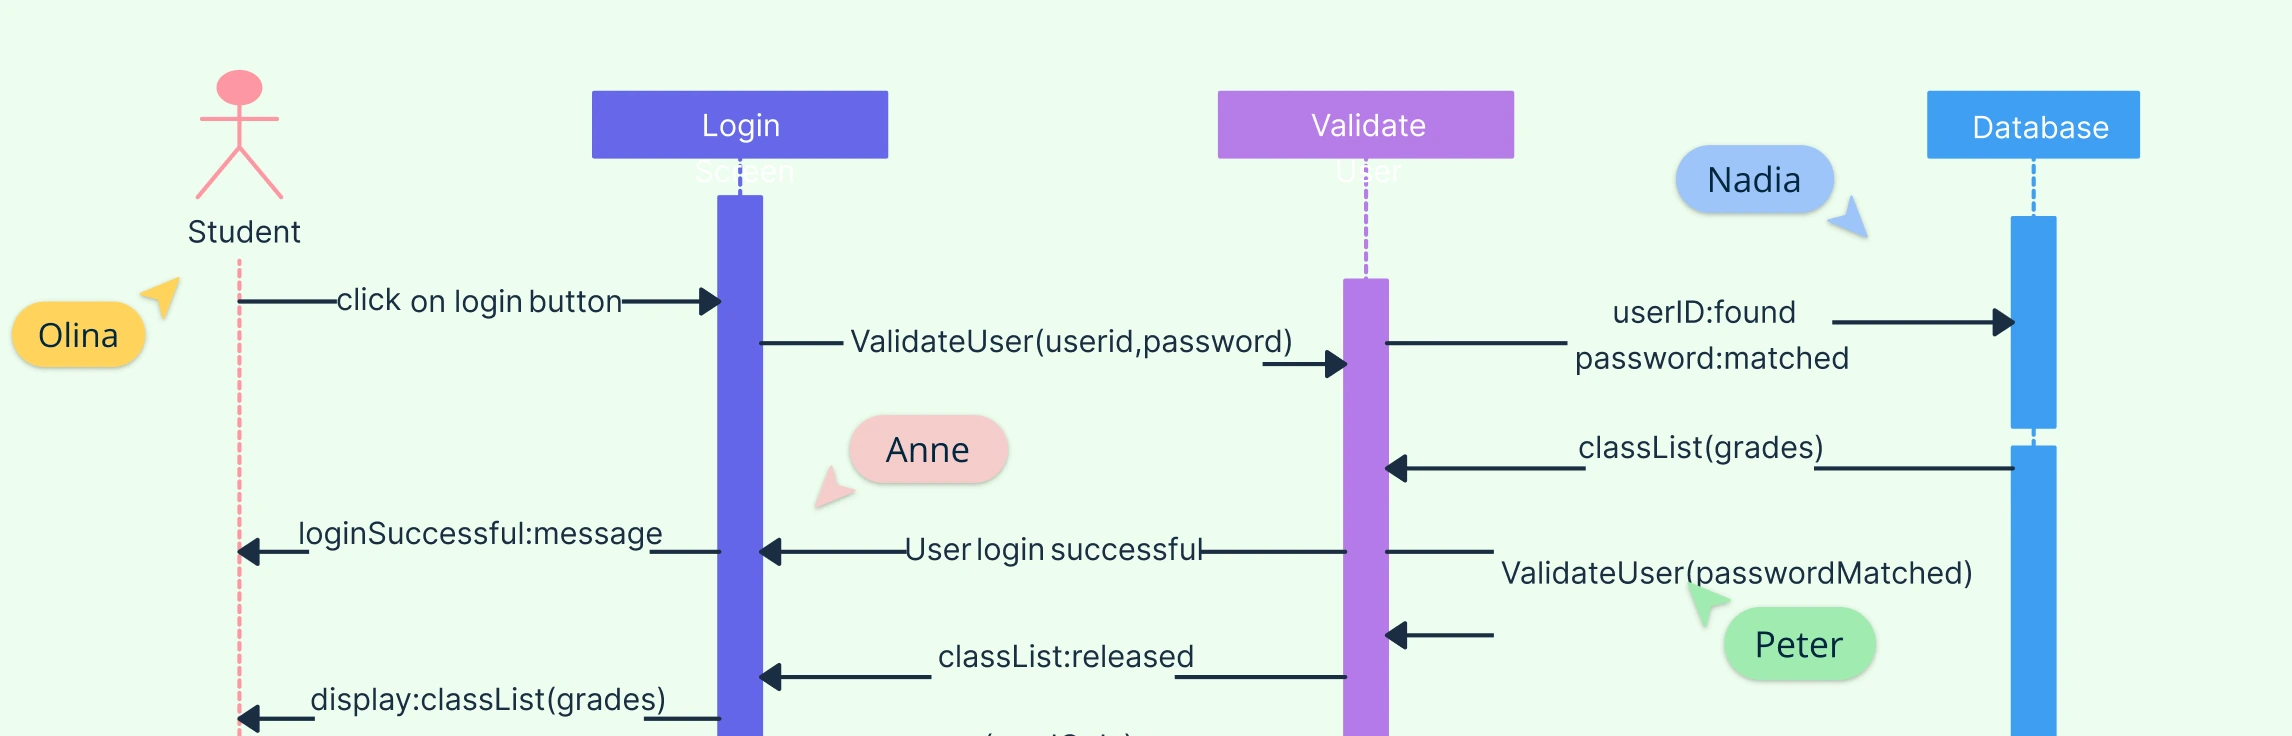
Repetitive processes are a core part of most software systems, from multiple login attempts to repeated data validations. Sequence diagram loops make these interactions easy to understand and communicate. By visually representing repeated actions, developers and stakeholders can quickly grasp system behavior, avoid errors, and streamline workflow design. Whether you’re designing an ATM, an online exam platform, or an e-commerce system, understanding how to model loops in sequence diagrams is a game-changer. Read More
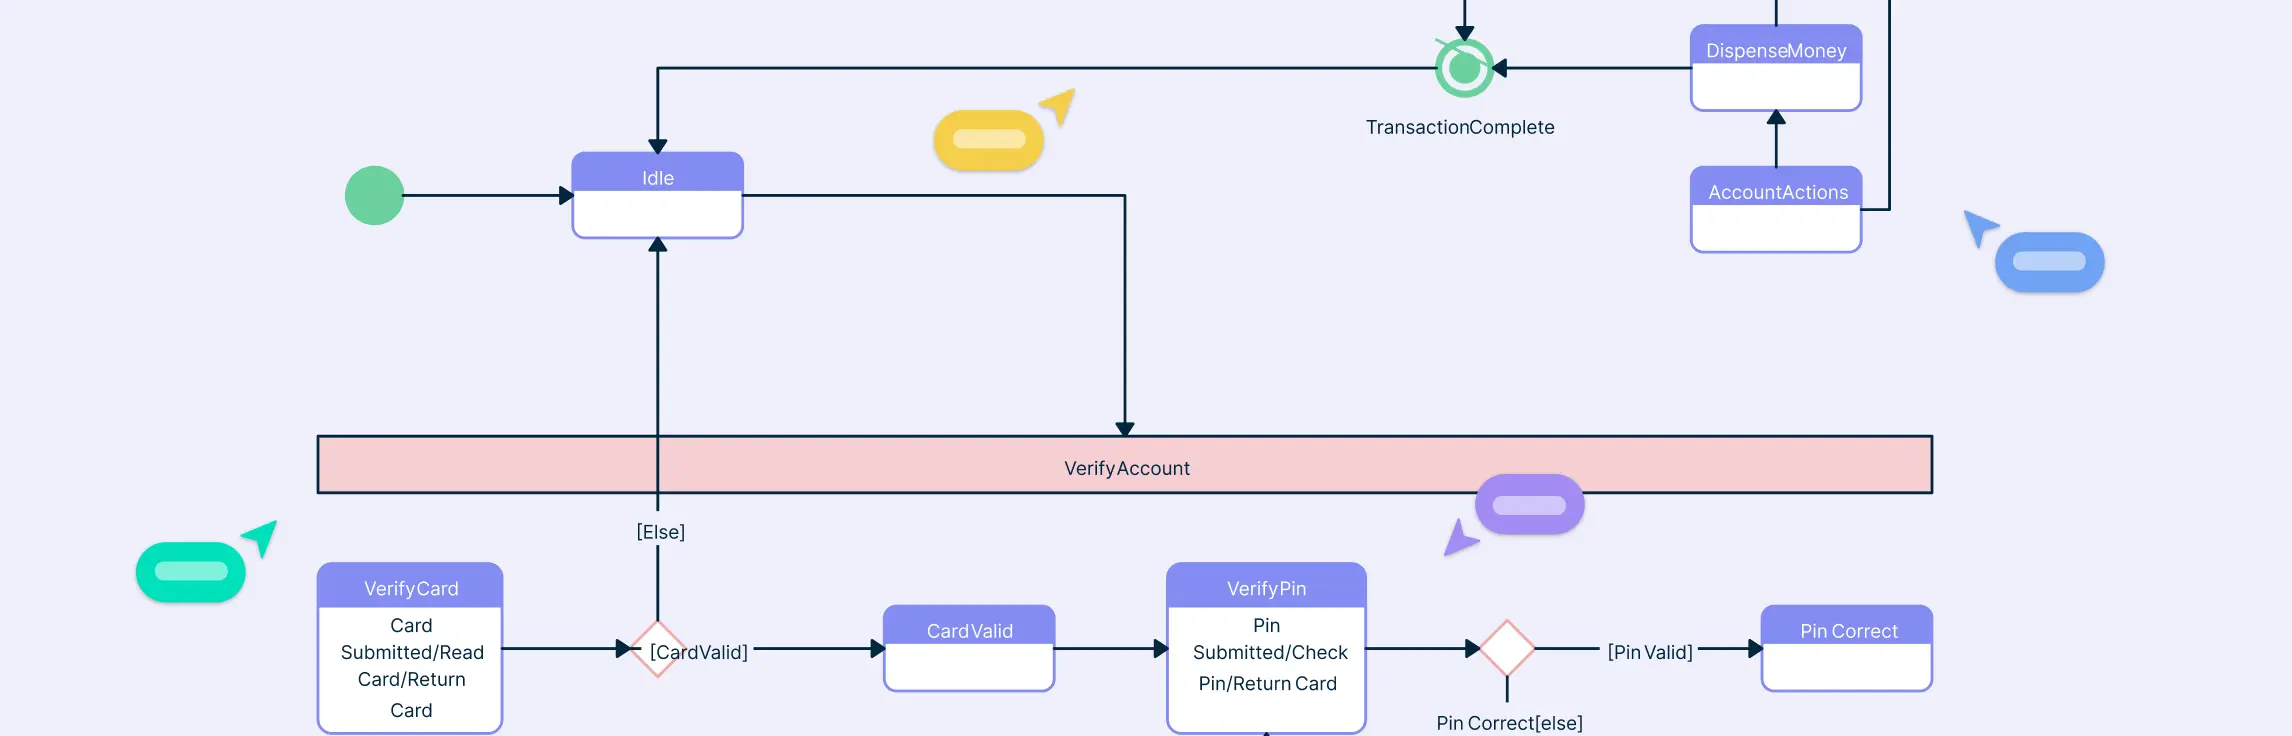
State diagrams are essential tools for visualizing how systems behave and transition between different states, making complex processes easier to understand. In this guide, we’ll explore state diagram examples to simplify complex system modeling and demonstrate how objects or components interact within a system. To make your diagram creation even easier, we’ve included ready-to-use templates that you can customize for your specific projects. Read More
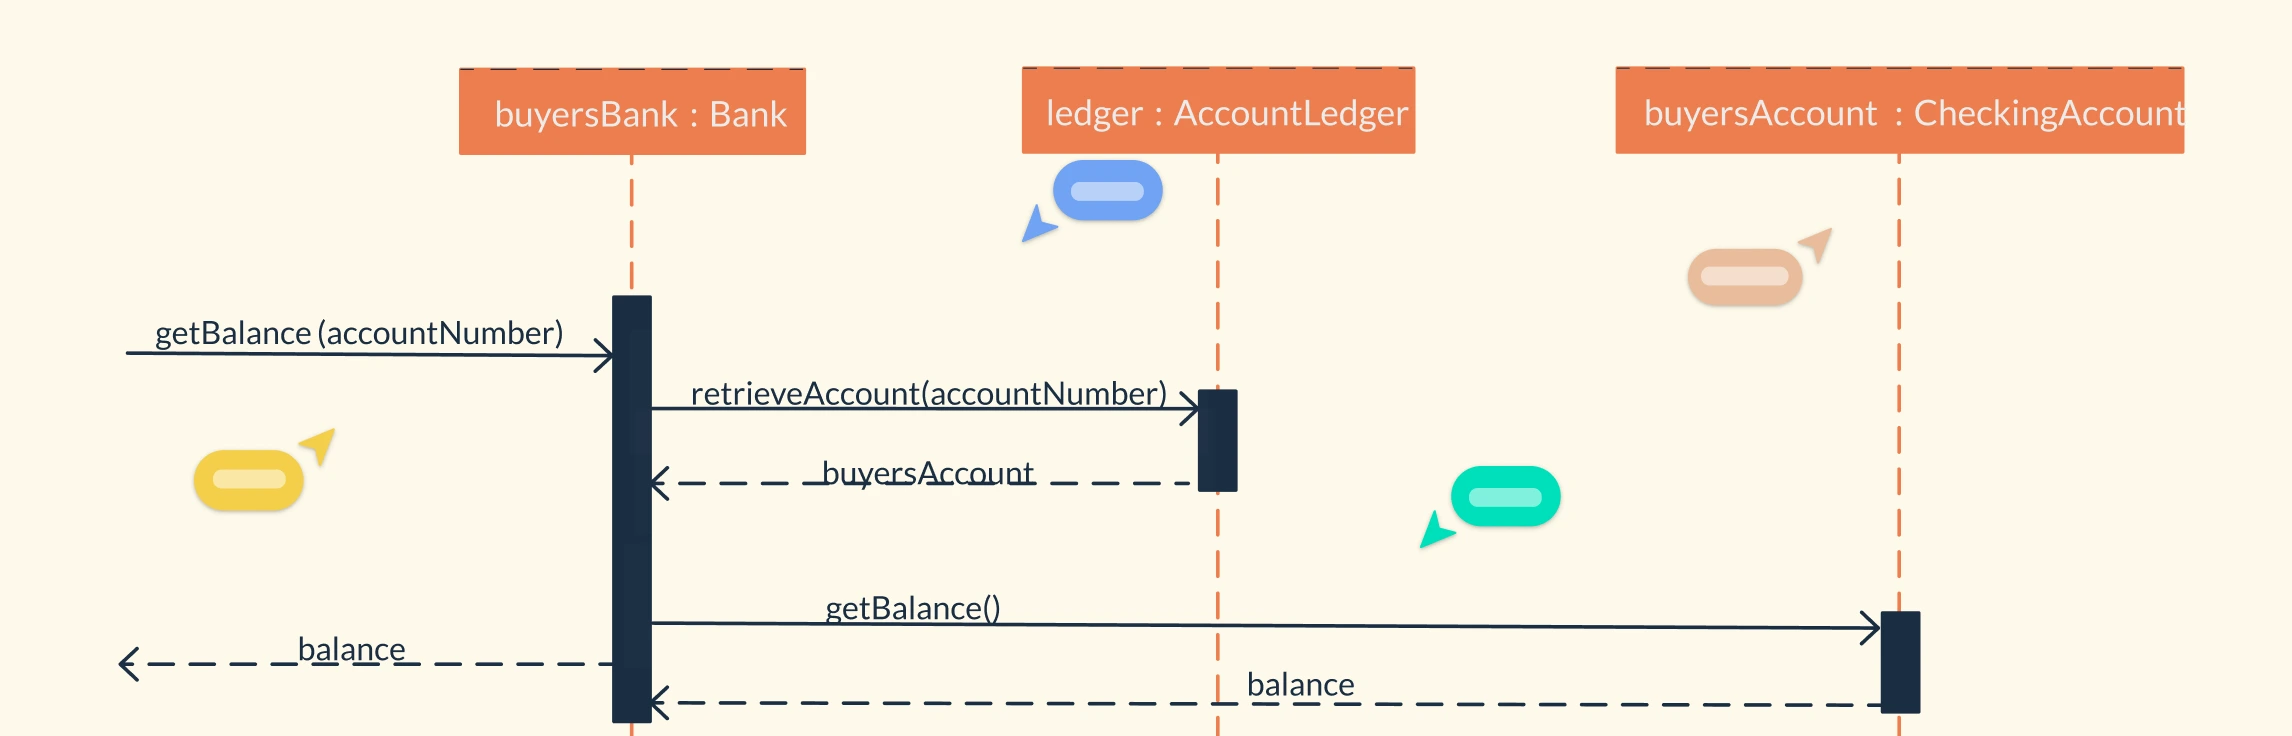
When designing a new system, tracking every interaction between components can be a nightmare. That’s why sequence diagrams are essential for illustrating how objects or components interact over time, making complex systems easier to understand for developers, analysts, and stakeholders alike. But with so many tools available, from intuitive drag-and-drop editors to text-based generators, choosing the right one can be overwhelming. In this guide, we break down the top sequence diagram tools, comparing their features, collaboration capabilities, templates, and export options, so you can pick the perfect tool for your workflow. Read More
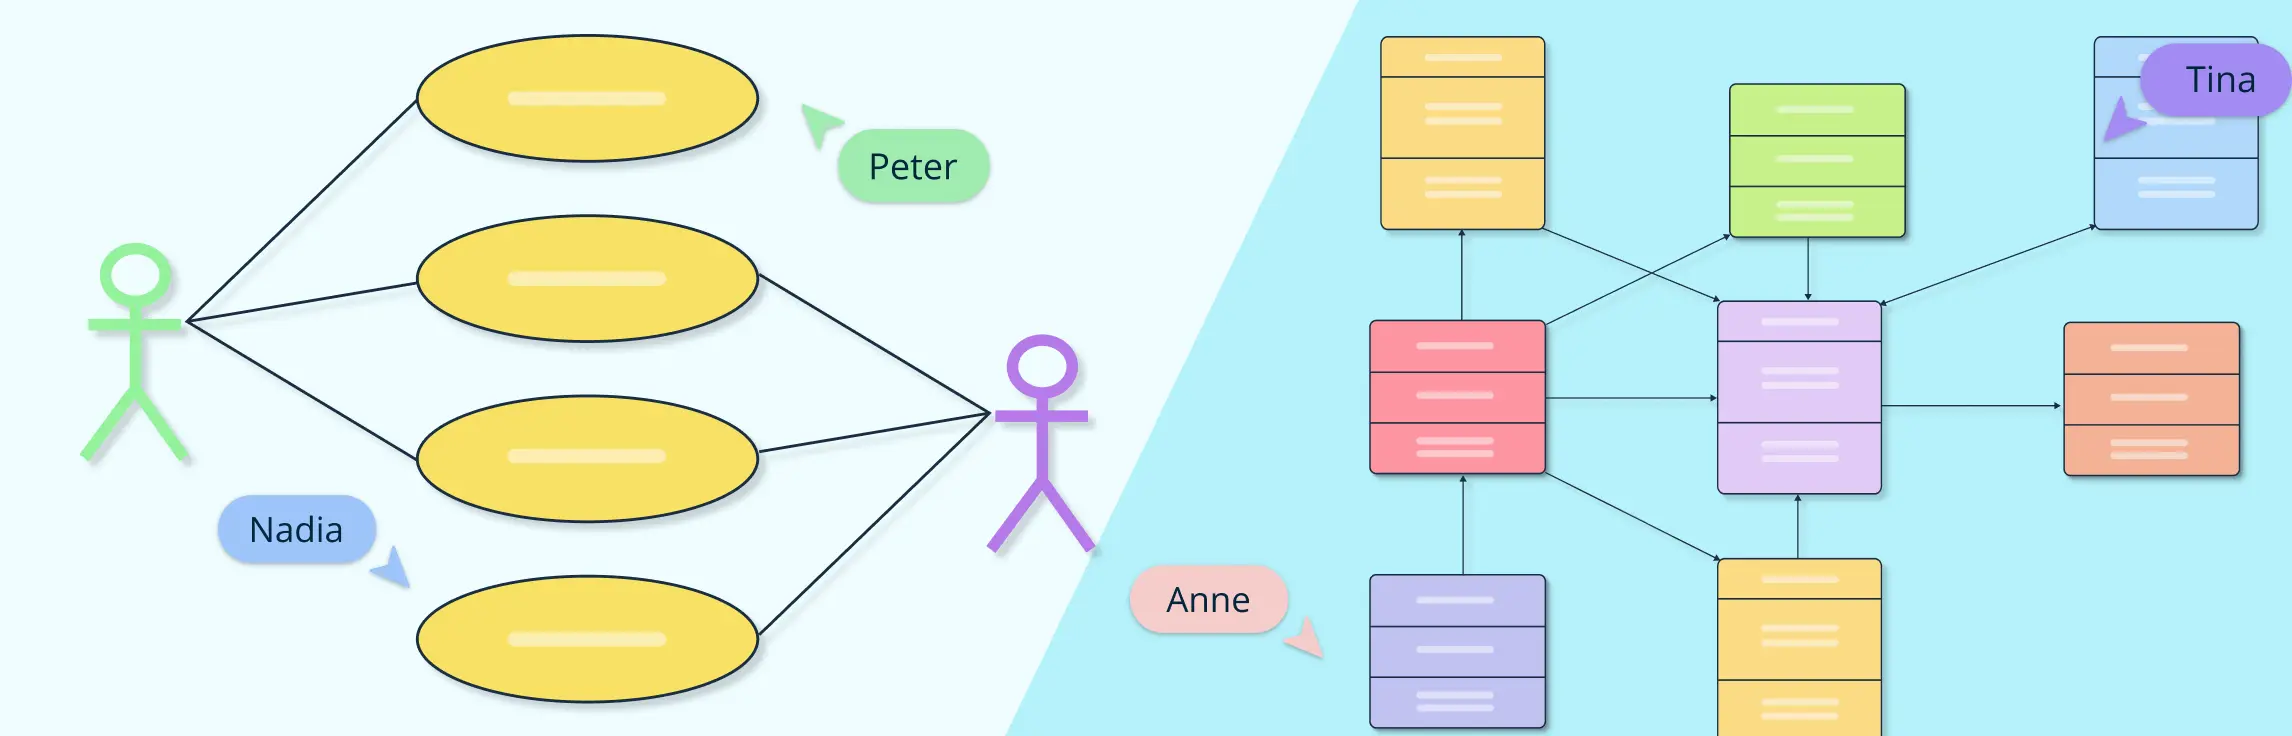
Ever started designing a system only to realize your team is mixing up user flows with system structures? You’re not alone. UML diagrams are essential tools in software design and UML modeling, helping teams visualize how systems behave and how their components interact. Among the most commonly used types, use case diagrams and class diagrams are often confused, yet they serve entirely different purposes. While one focuses on system behavior and user interactions, the other captures the internal structure and relationships between classes. In this guide on use case diagram vs class diagram, we’ll break down their key differences, explore real-world use case diagram examples and class diagram examples, and share ready-to-use templates to help you create both effortlessly. Read More
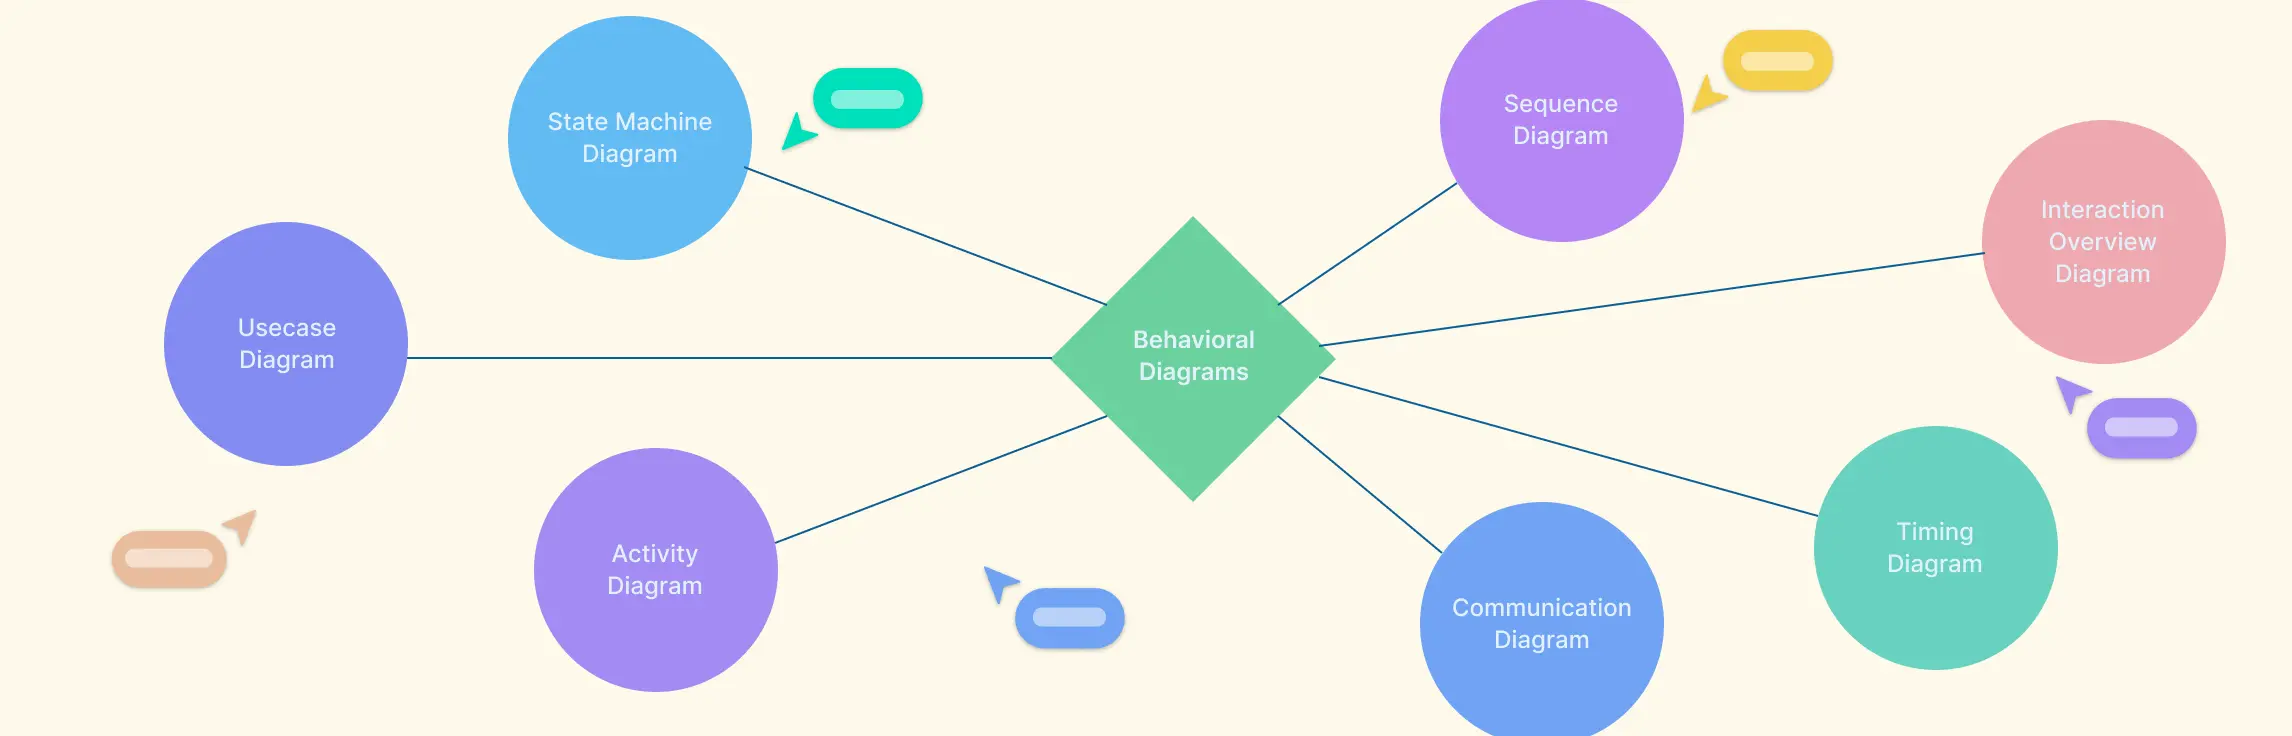
Understanding how a system behaves is just as important as knowing its structure, and that’s where behavioral diagrams in UML come in. These diagrams provide a visual representation of system interactions, workflows, and object behavior over time, helping teams design more efficient software, communicate clearly, and ensure requirements are accurately captured. In this guide, we’ll explore what behavioral diagrams are, why they matter, and break down the seven main types along with examples to help you apply them effectively. Read More
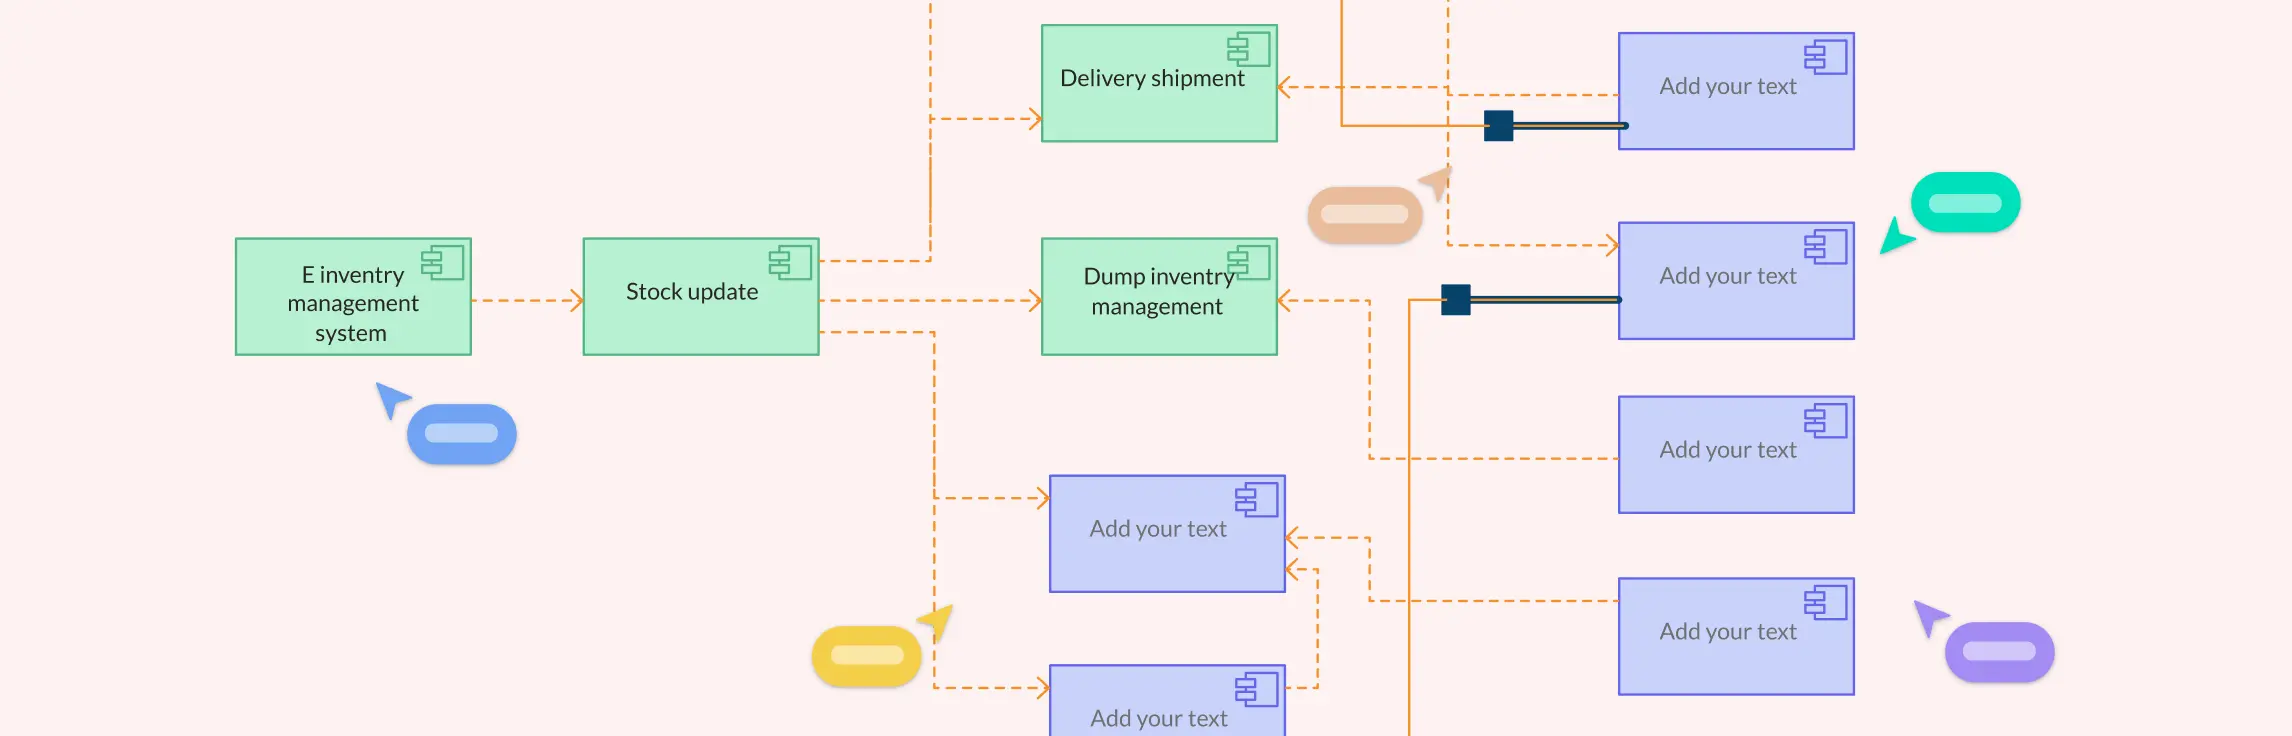
In software and system design, understanding how different parts of a system interact is crucial, and that’s where component diagrams come in. A component in UML represents a modular part of a system, showing its interfaces, dependencies, and relationships with other components. This guide will walk you through practical component diagram examples and provide ready-to-use templates, helping you visualize complex systems clearly and implement UML components quickly and efficiently. Read More
A UML Profile Diagram is a powerful tool for customizing standard UML models to fit specific domains, from IT management and enterprise software to mobile applications and service-oriented architectures. By using UML profiles, teams can define domain-specific stereotypes, tagged values, and constraints, all while keeping their models compatible with standard UML tools. In this guide, we’ll break down the key elements of a UML profile diagram, show you how to create one step-by-step, and explore ready-to-use templates to accelerate your modeling workflow. Read More
Understanding the internal workings of a system is crucial for software designers, architects, and developers. A UML composite structure diagram offers a detailed view of how components, parts, ports, and roles interact within a system, making it easier to design modular, maintainable, and scalable solutions. Whether you’re modeling software architecture, system workflows, or component-based designs, these diagrams help bridge the gap between static class definitions and dynamic interactions, providing clarity and improving collaboration across teams. Read More
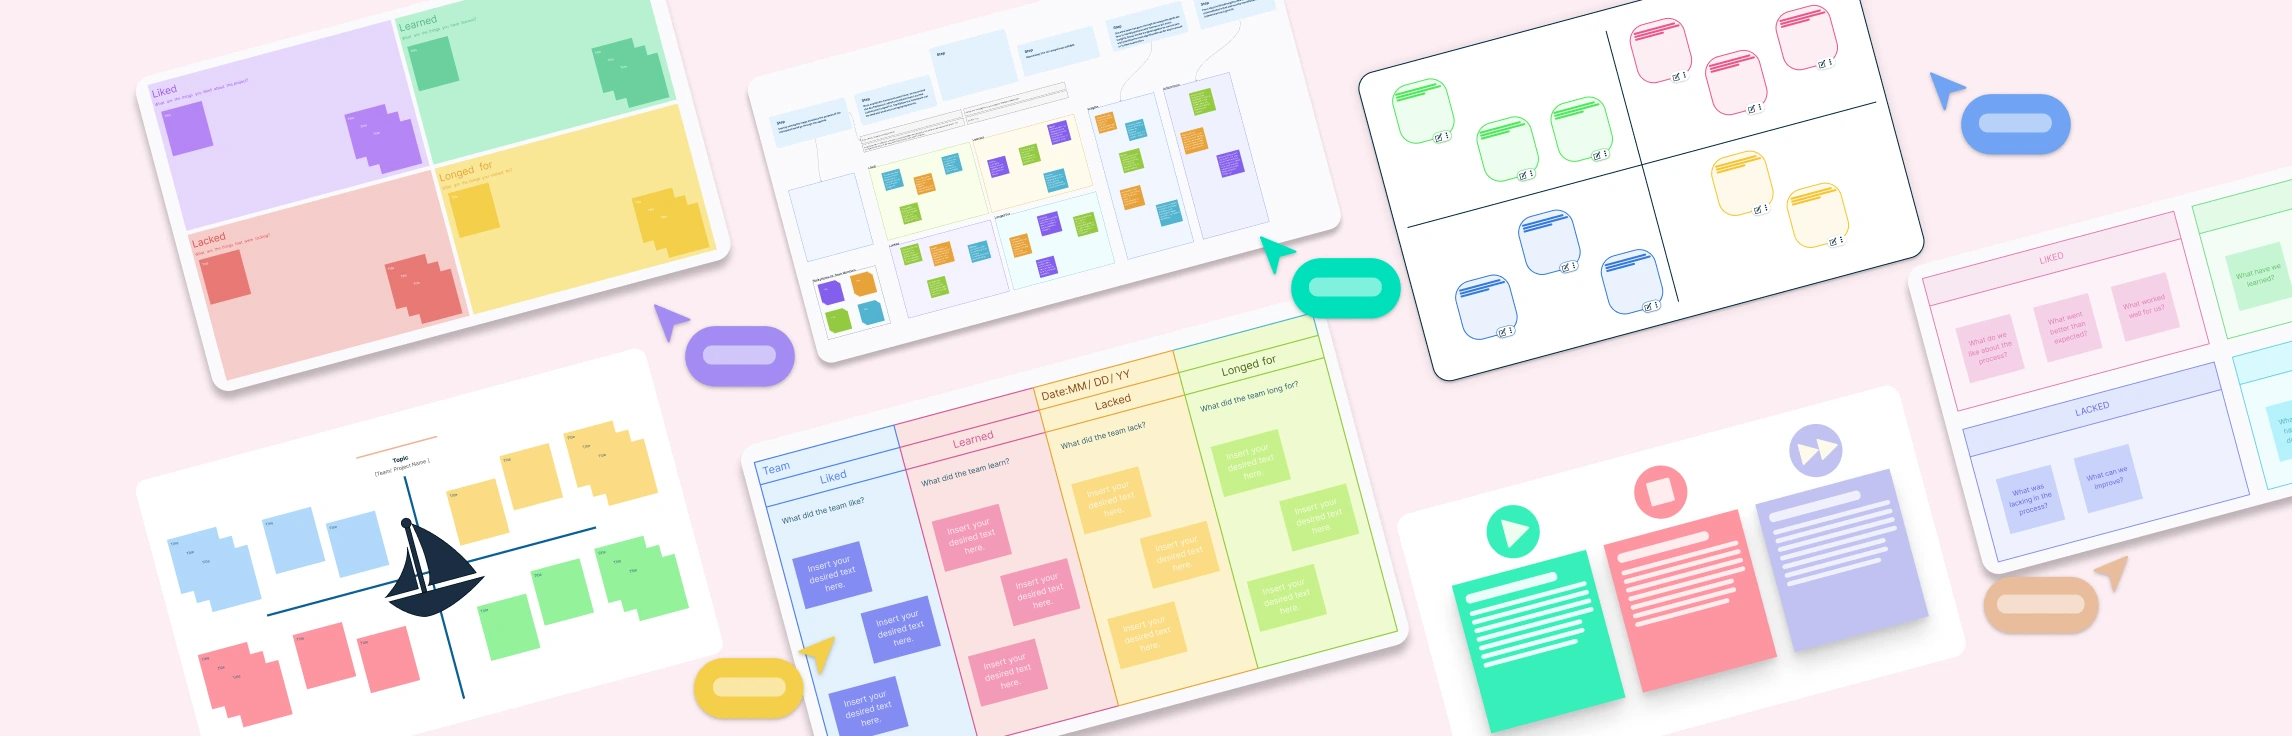
Using the right retrospective template can make a significant difference in how teams communicate their thoughts, analyze challenges, and celebrate wins. Whether you’re working in an Agile environment or simply looking to boost team dynamics, these templates provide the clarity and direction needed for meaningful discussions. Let’s see how they can cater to different team needs. Read More
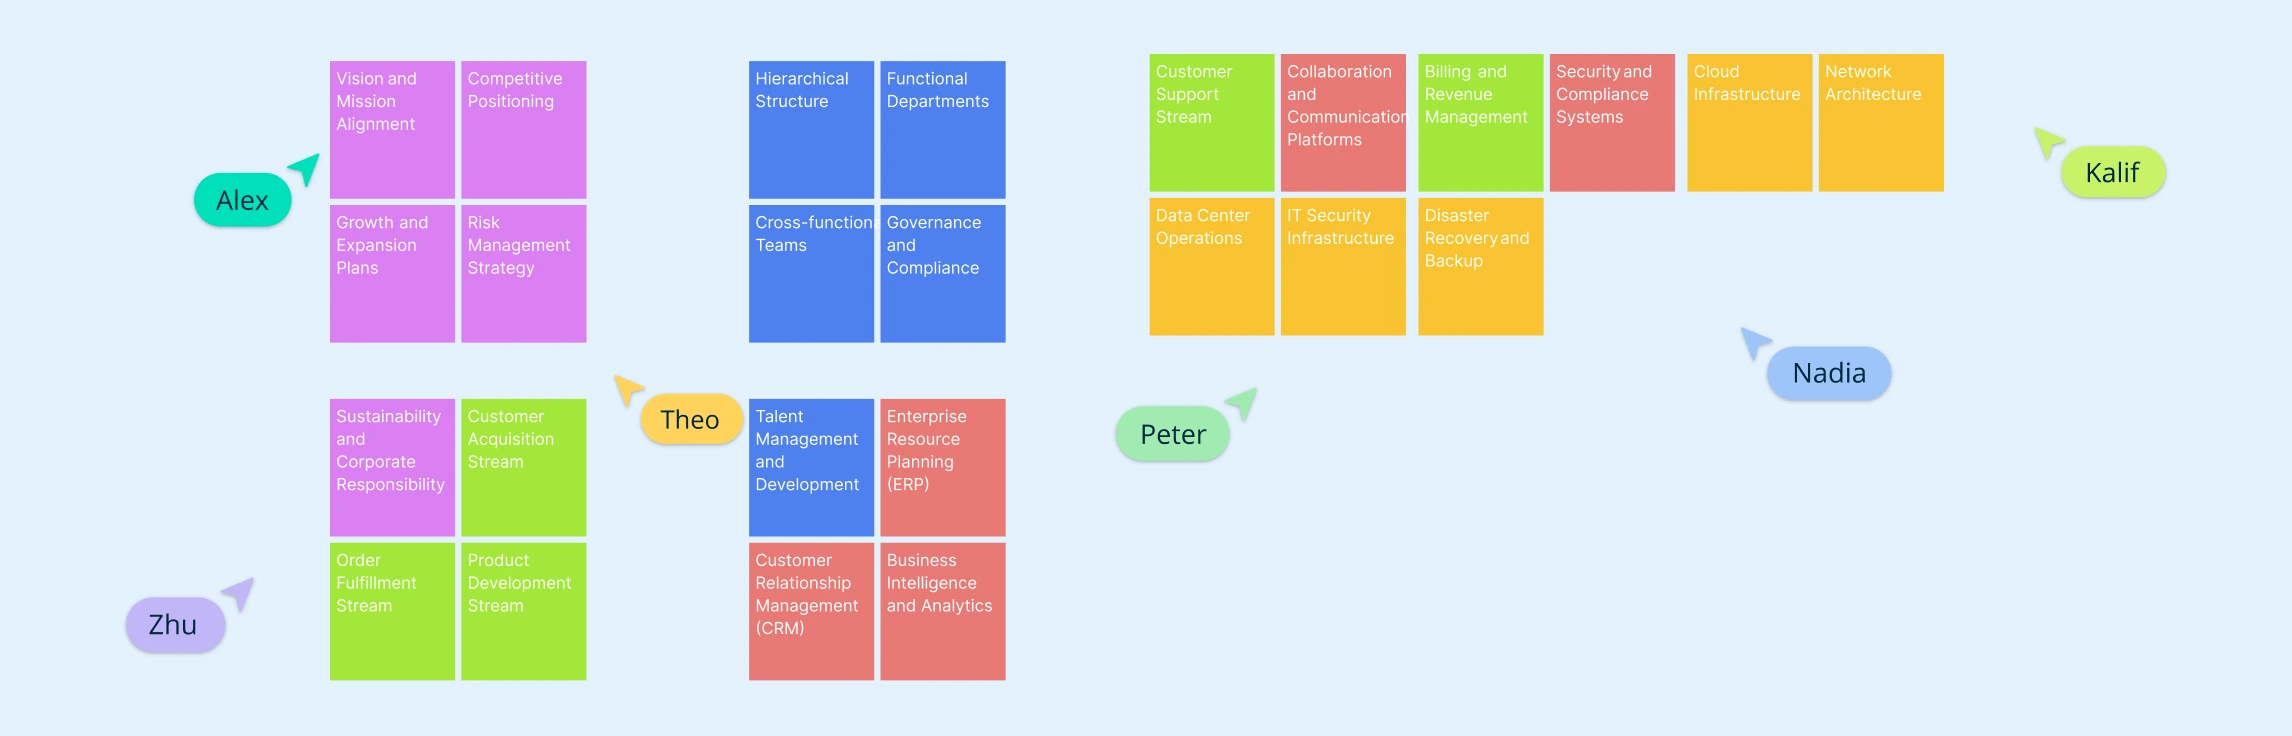
In today’s fast-paced business environment, aligning strategy with execution is more critical than ever. Business architecture modelling provides a clear, structured view of an organization’s capabilities, processes, information flows, and stakeholders, helping leaders make informed decisions and drive operational excellence. Whether you’re a startup, an enterprise, or a growing e-commerce business, understanding and visualizing your business architecture can unlock clarity, efficiency, and strategic alignment, turning complex operations into actionable insights. Read More
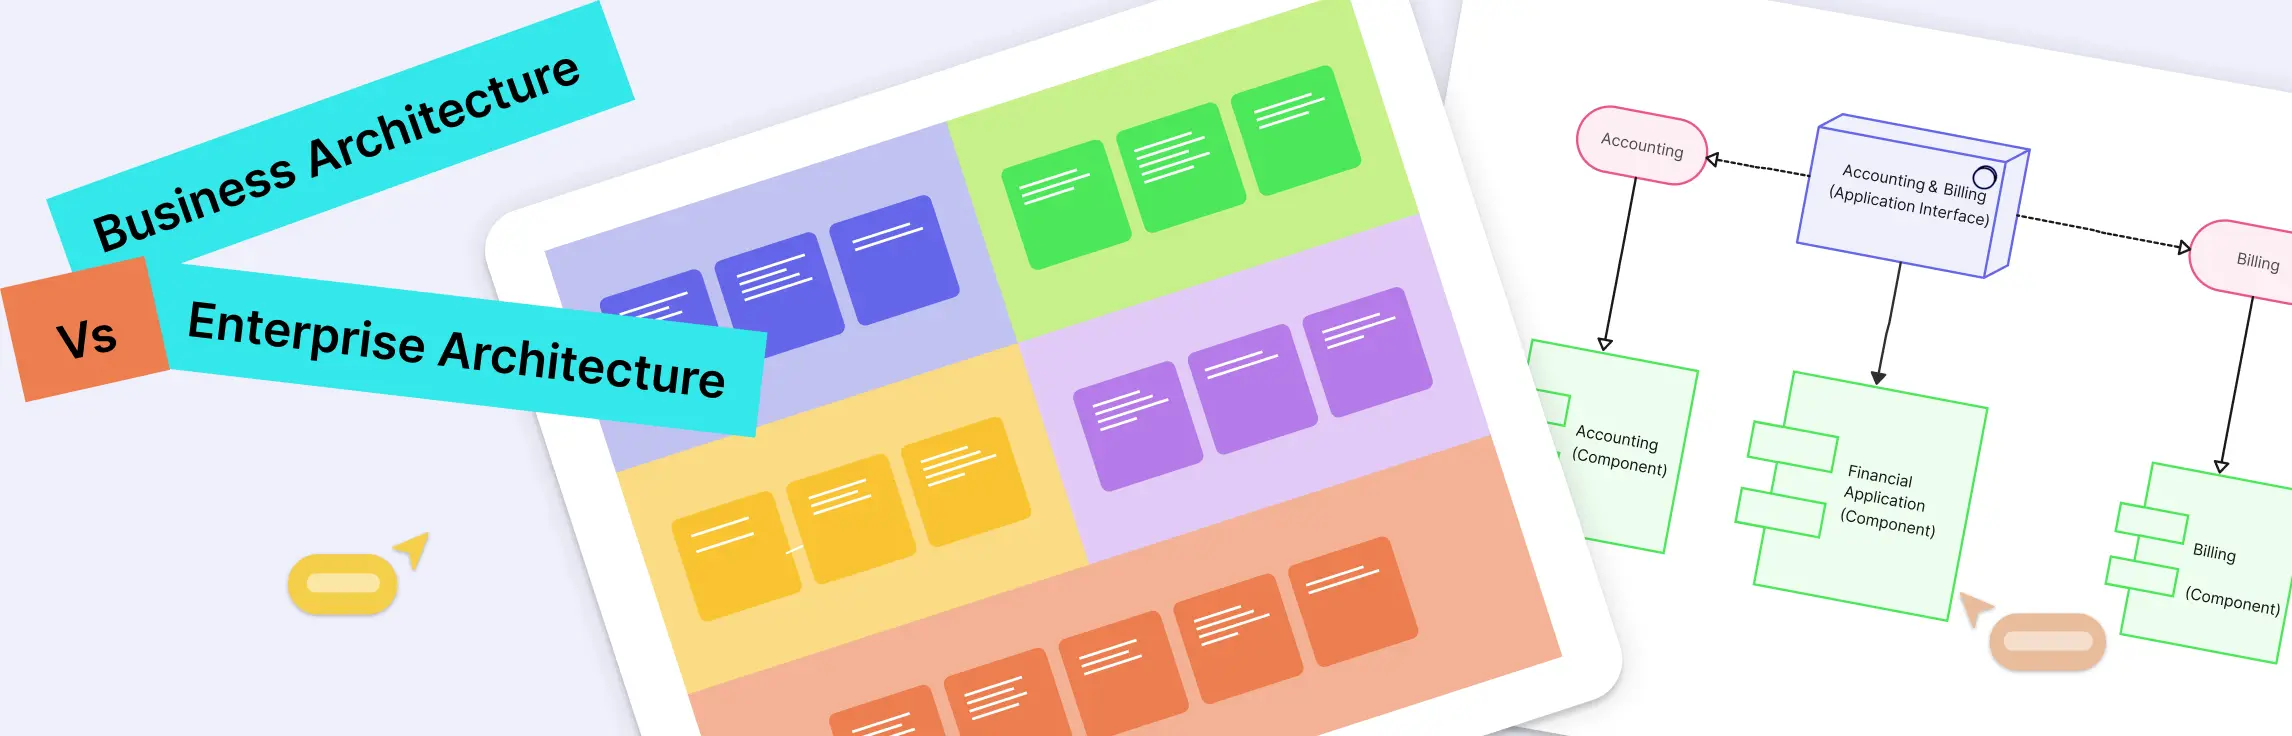
In today’s fast-changing business landscape, success depends on how well strategy aligns with technology. Yet many organizations struggle to connect big-picture goals with the systems that power them. This is where understanding business vs enterprise architecture becomes critical. By distinguishing how business architecture defines organizational capabilities and how enterprise architecture enables them through technology, teams can bridge the gap between vision and execution. In this guide, we’ll break down the differences, explore examples, and share practical templates to help you build a strong business enterprise architecture foundation for long-term success. Read More
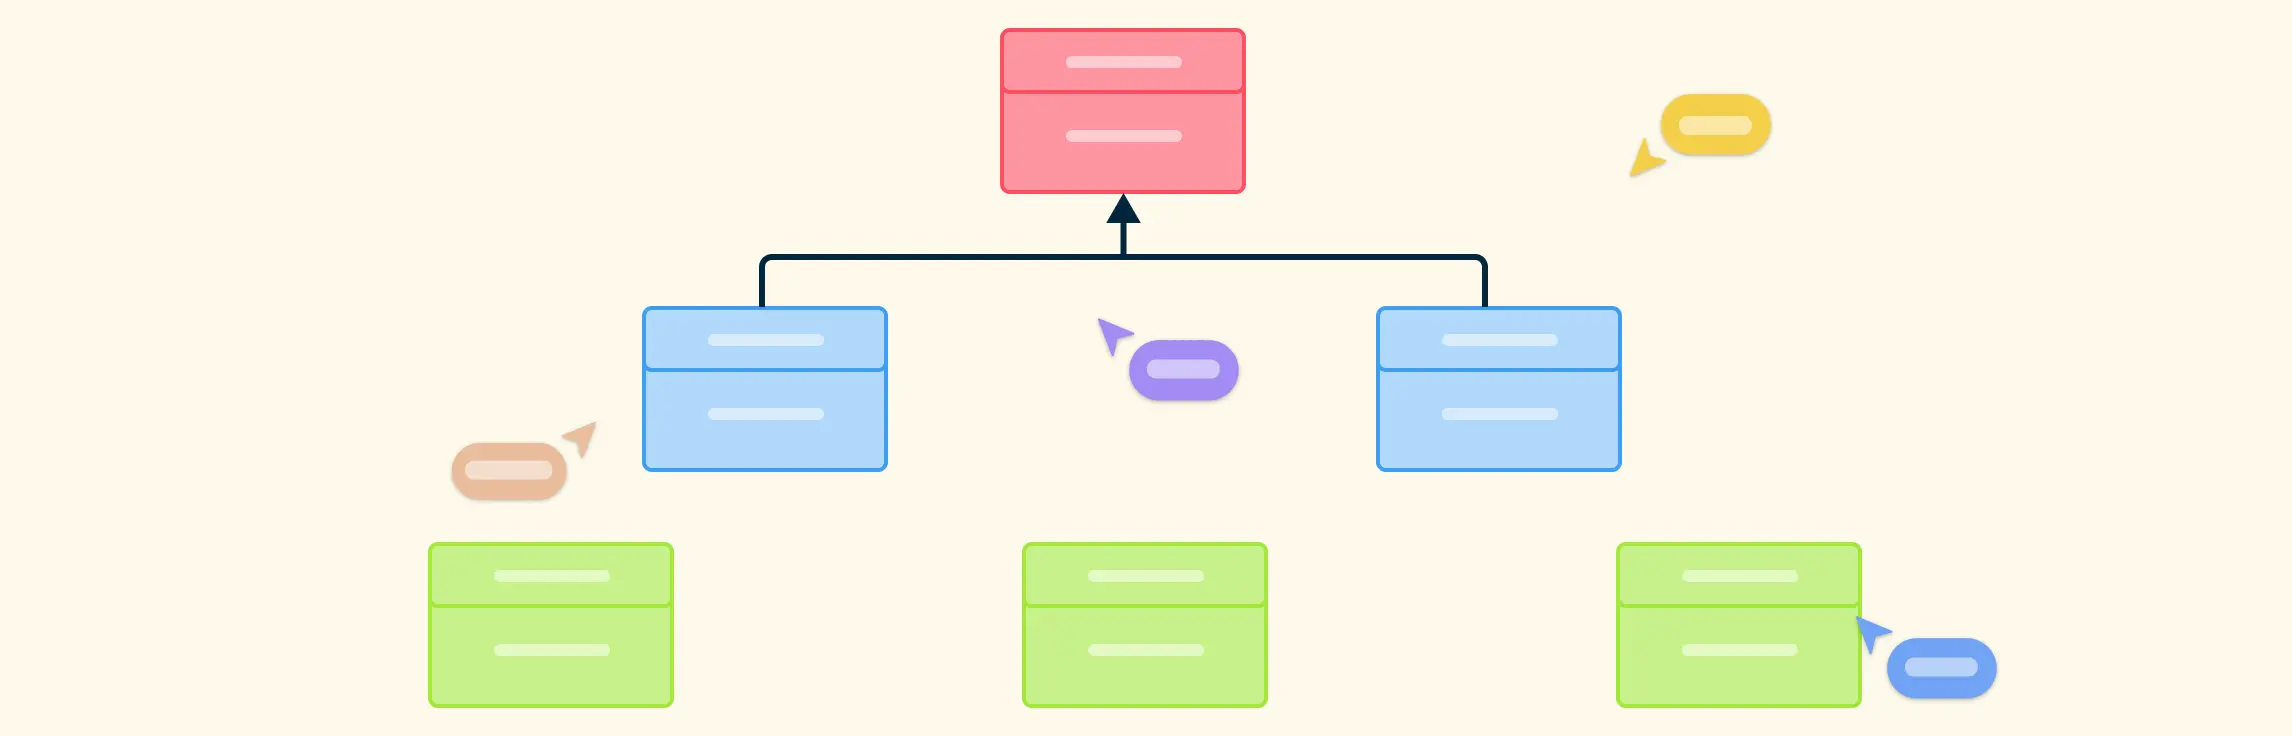
In the world of software design, clear visual modeling can make the difference between a well-structured system and a confusing tangle of code. Among the essential UML tools, object diagrams vs. class diagrams stand out as critical instruments for understanding both the blueprint and the real-time instances of a system. This guide will help you explore the key differences between class and object diagrams, illustrate practical examples of each, and provide ready-to-use templates so you can start modeling your software architecture with clarity and efficiency. Read More
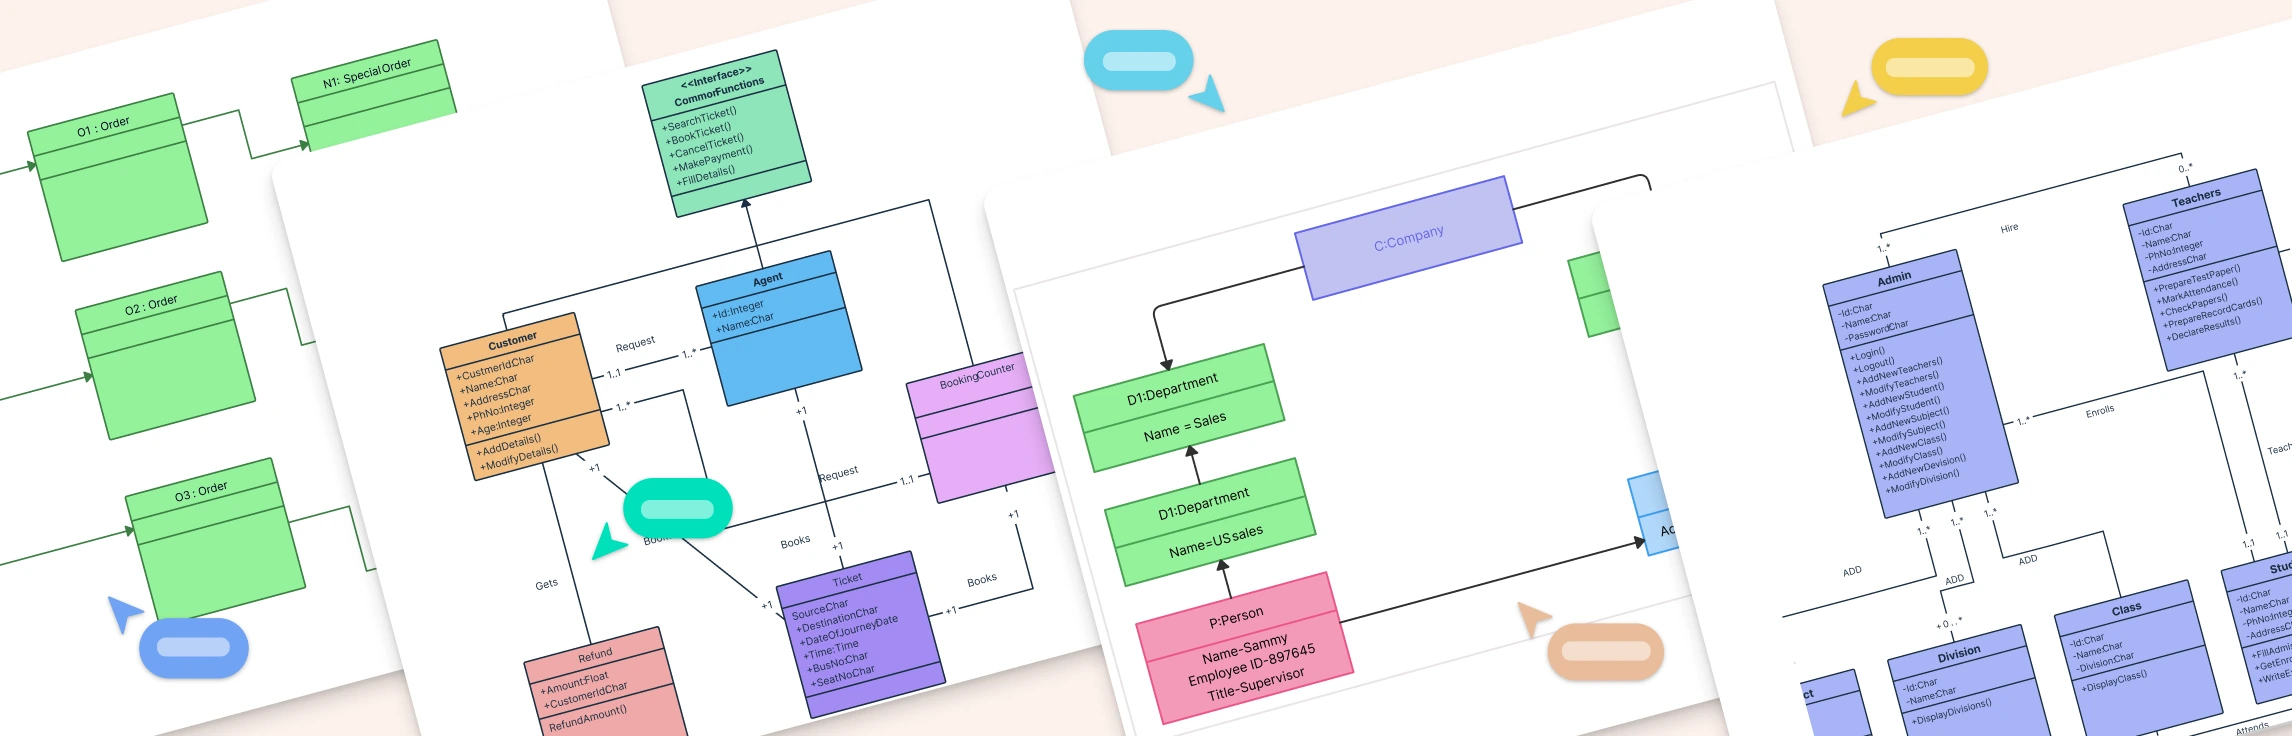
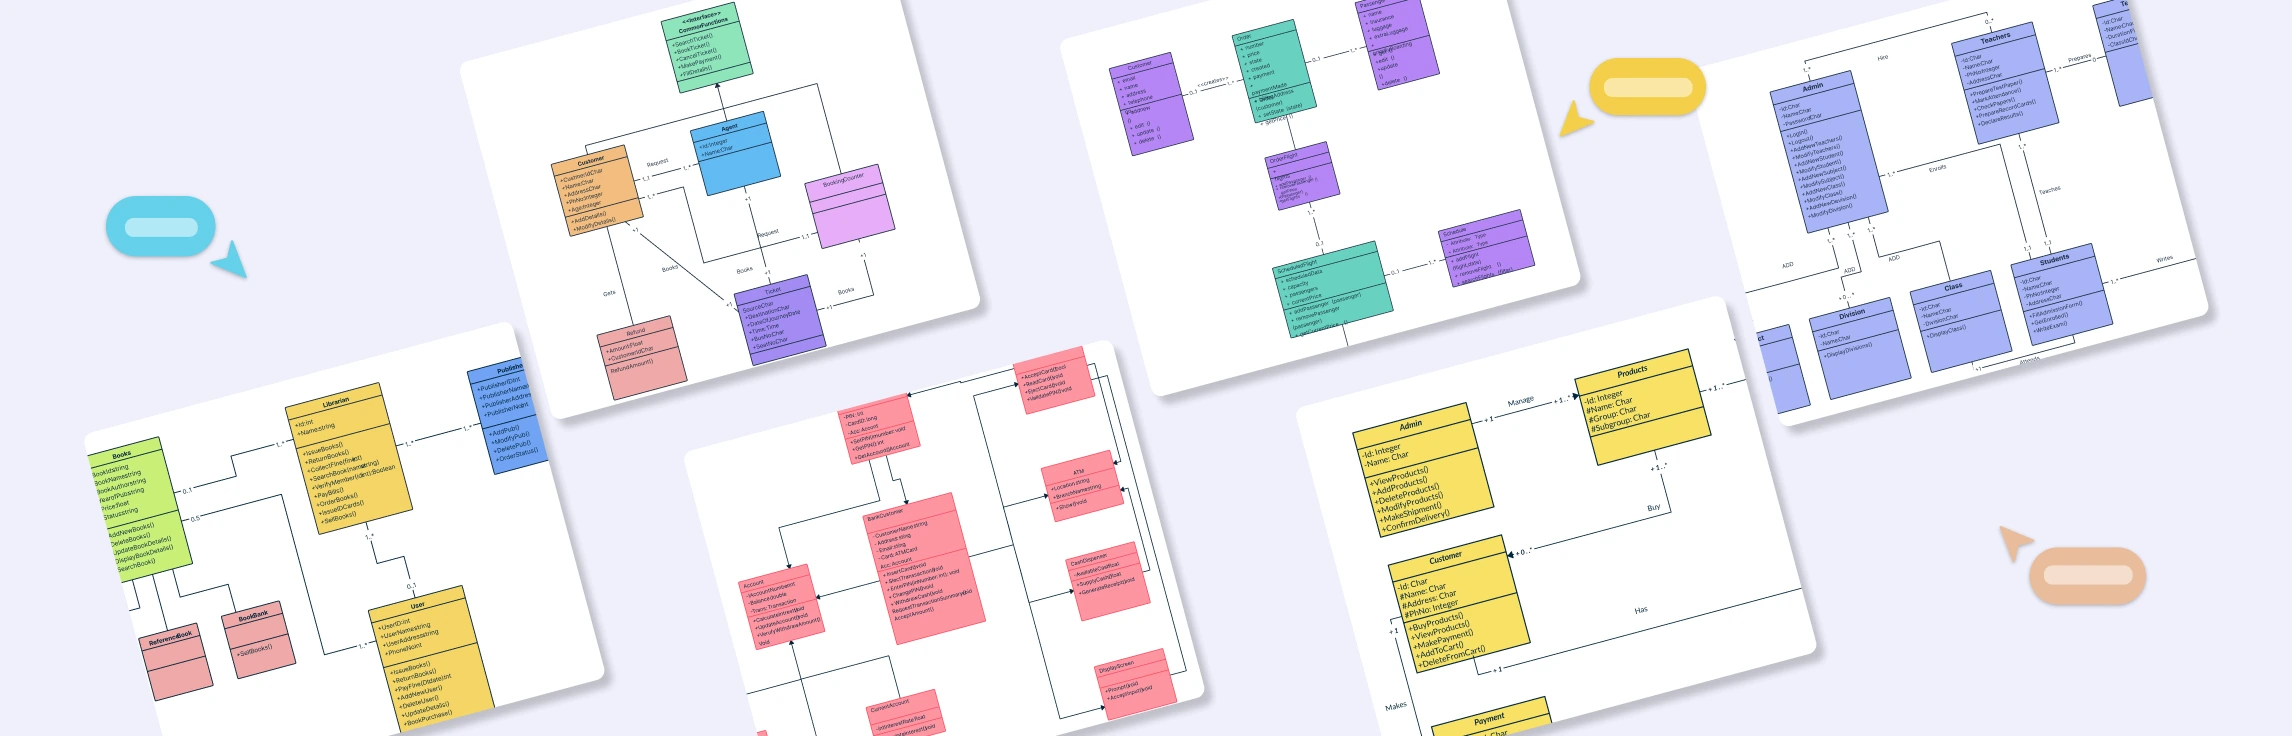
UML Class Diagrams are one of the most essential tools in software engineering, helping developers visualize the structure and relationships within object-oriented systems. They provide a clear overview of classes, attributes, methods, and how different entities interact, making them indispensable for designing, documenting, and maintaining complex applications. Read More
Ever feel like your organization’s strategy lives in one place, but execution happens somewhere completely different? Misaligned goals, unclear responsibilities, and disconnected processes can turn even the best strategies into missed opportunities. Read More
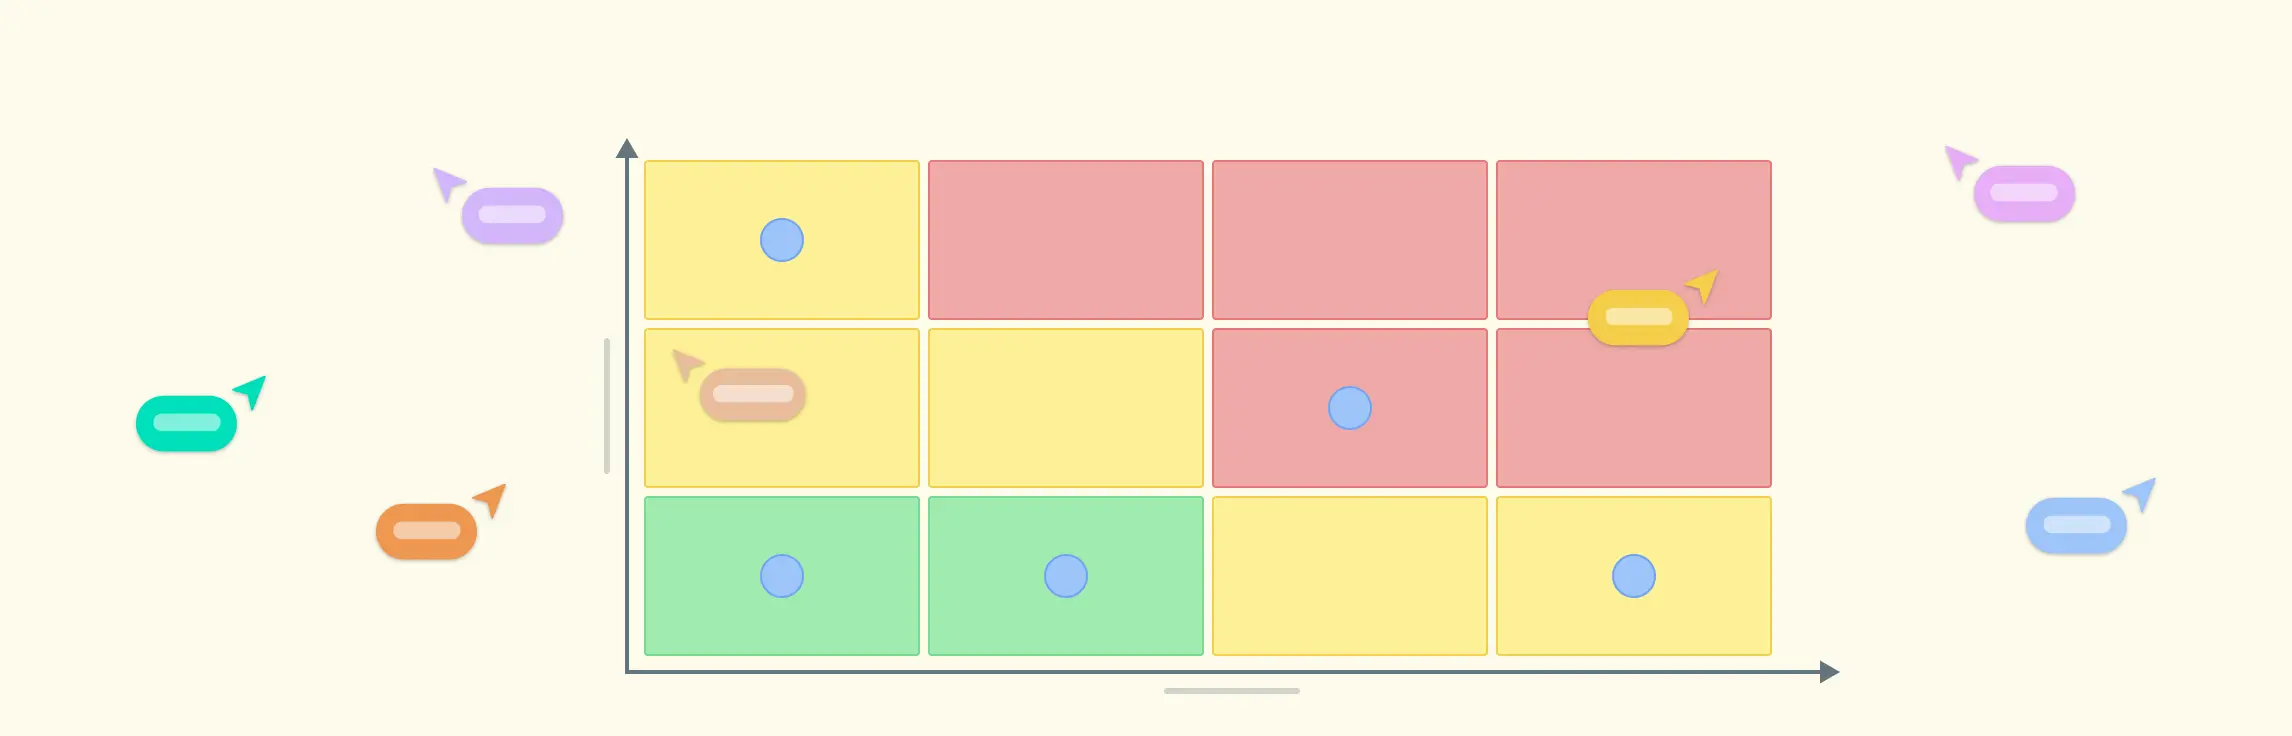
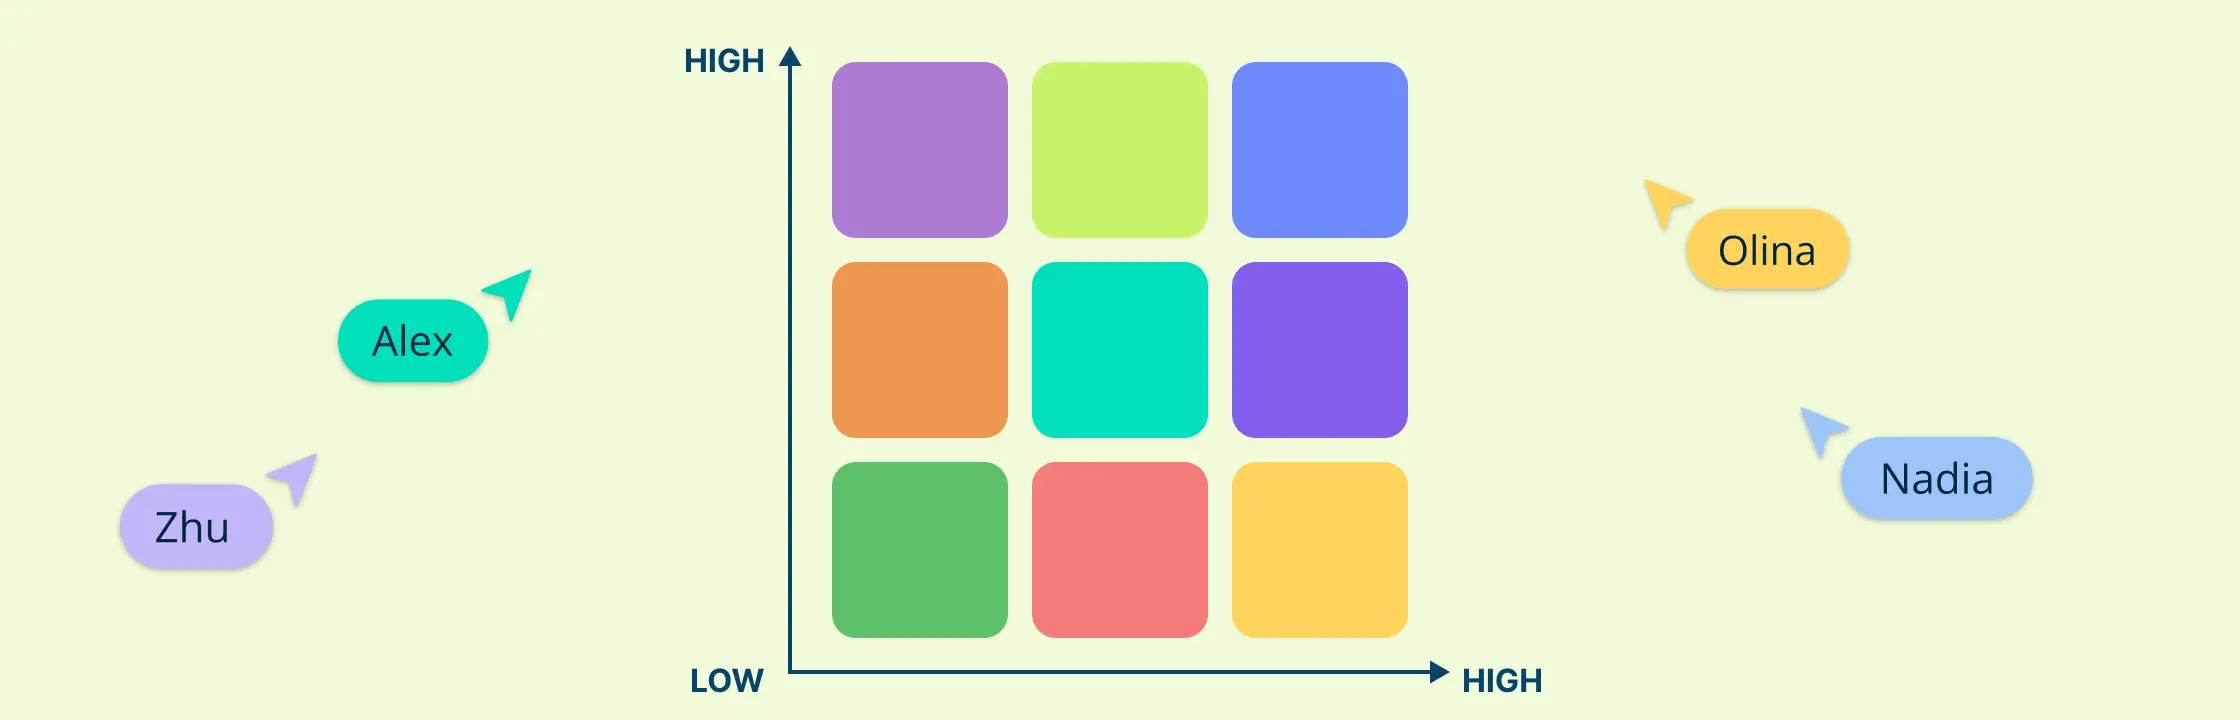
Feeling overwhelmed by endless tasks and struggling to decide what to tackle first? An Action Priority Matrix can save you from decision fatigue. By mapping tasks based on impact and effort, this prioritization model helps you quickly spot what to do now, what to plan, and what to delegate or drop. In this guide, you’ll learn how to create an Action Priority Matrix, explore its four quadrants, see practical examples, and access templates to streamline task management for business projects, personal productivity, or team initiatives. Read More
Ever feel like your team is drowning in endless to-do lists, yet struggling to decide what to tackle first? In product management and beyond, this challenge is all too common; spending weeks on projects that drain resources but barely move the needle, while quick, high-value wins remain overlooked. That’s where the Benefit Vs. Effort Matrix comes in. It helps teams cut through the noise, evaluate tasks objectively, and focus on the initiatives that deliver the highest value for the lowest cost. By visualizing priorities in a clear, structured way, you can make smarter decisions, save time, and ensure your team’s energy is spent where it matters most. Read More
Struggling with inconsistent interfaces, duplicated design work, and misaligned teams? That’s a common challenge when products grow without a unified system. Design system components solve this by providing reusable UI elements, standardized styles, and clear guidelines that bridge design and development. With a well-structured design system components library, teams can reduce errors, accelerate feature delivery, and maintain a cohesive user experience, ensuring every designer and developer references the same source of truth Read More
Are your design teams struggling with inconsistent interfaces, slow development cycles, or endless revisions? A digital design system can solve these pain points by centralizing your UI/UX assets, standardizing components, and creating a single source of truth for your entire organization. From design tokens to component libraries and governance workflows, a digital design framework ensures your products are consistent, scalable, and easier to manage, helping teams save time, reduce errors, and deliver superior user experiences across platforms. Read More
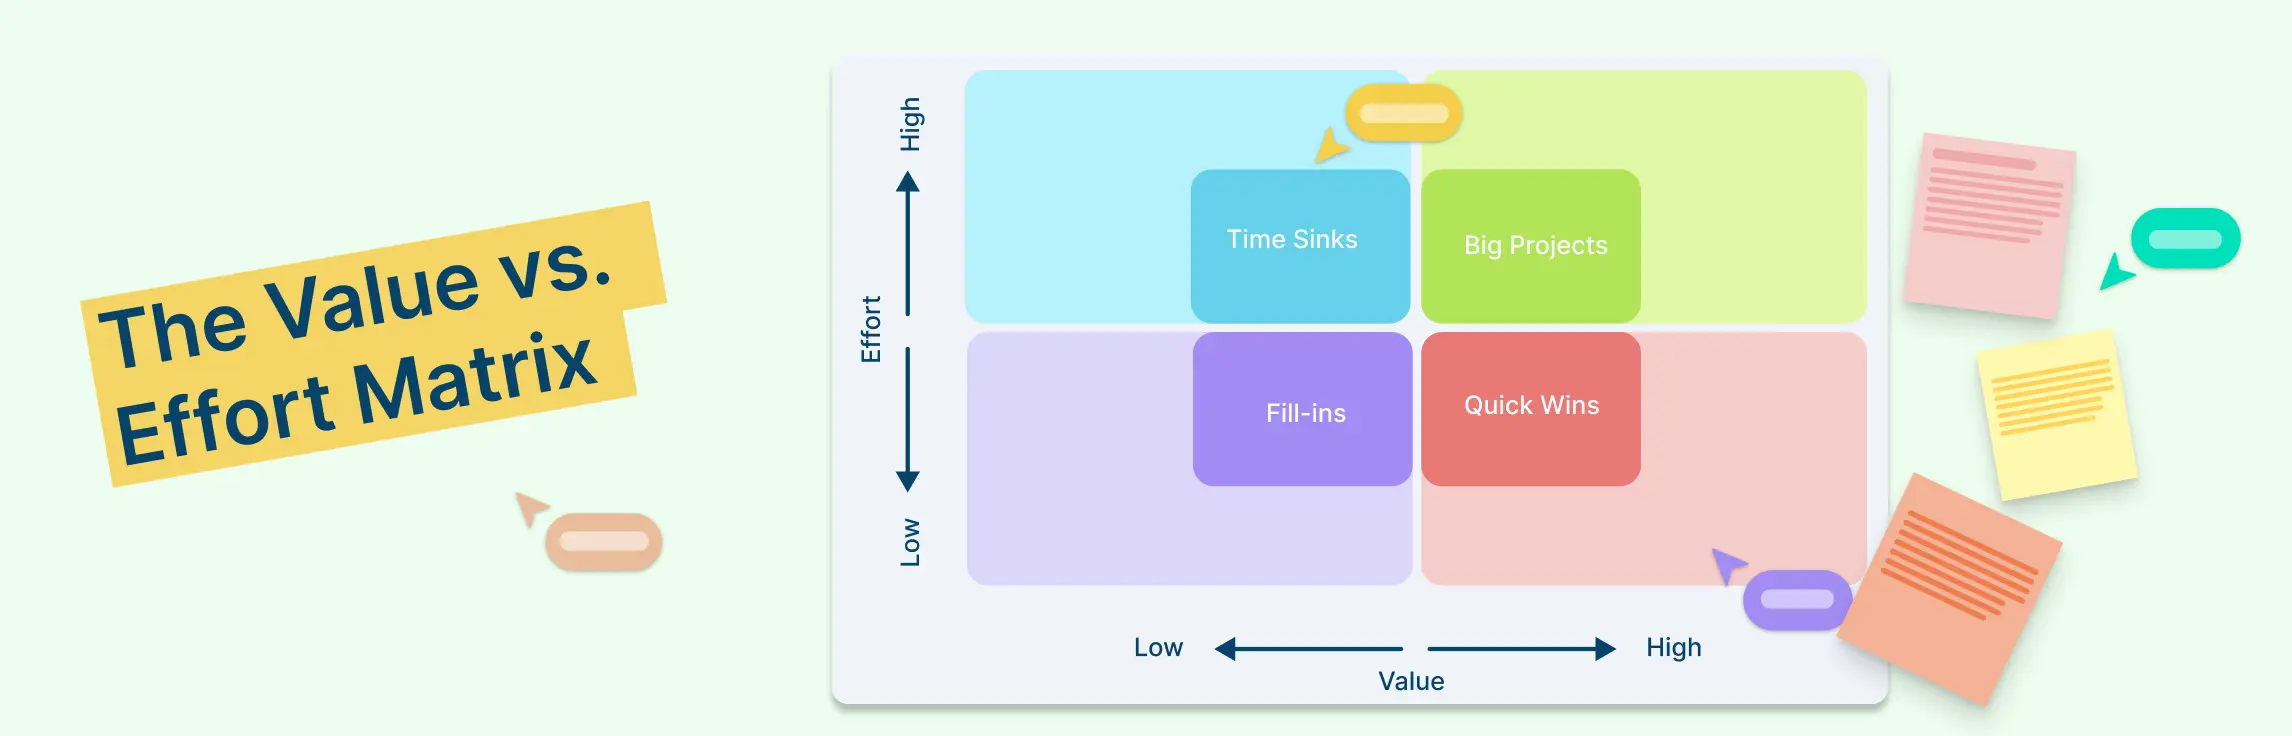
Overwhelmed by long to-do lists and unsure which tasks to tackle first? The Value vs Effort Matrix helps you prioritize effectively by evaluating tasks based on their potential impact (value) and the effort required. By plotting tasks on this simple 2x2 chart, you can focus on high-value, low-effort activities while avoiding time-consuming, low-impact work. Whether for personal productivity, project management, or team workflows, this guide will show you how to use the Value vs Effort Matrix, understand its quadrants, and apply practical templates to make smarter, more efficient decisions. Read More
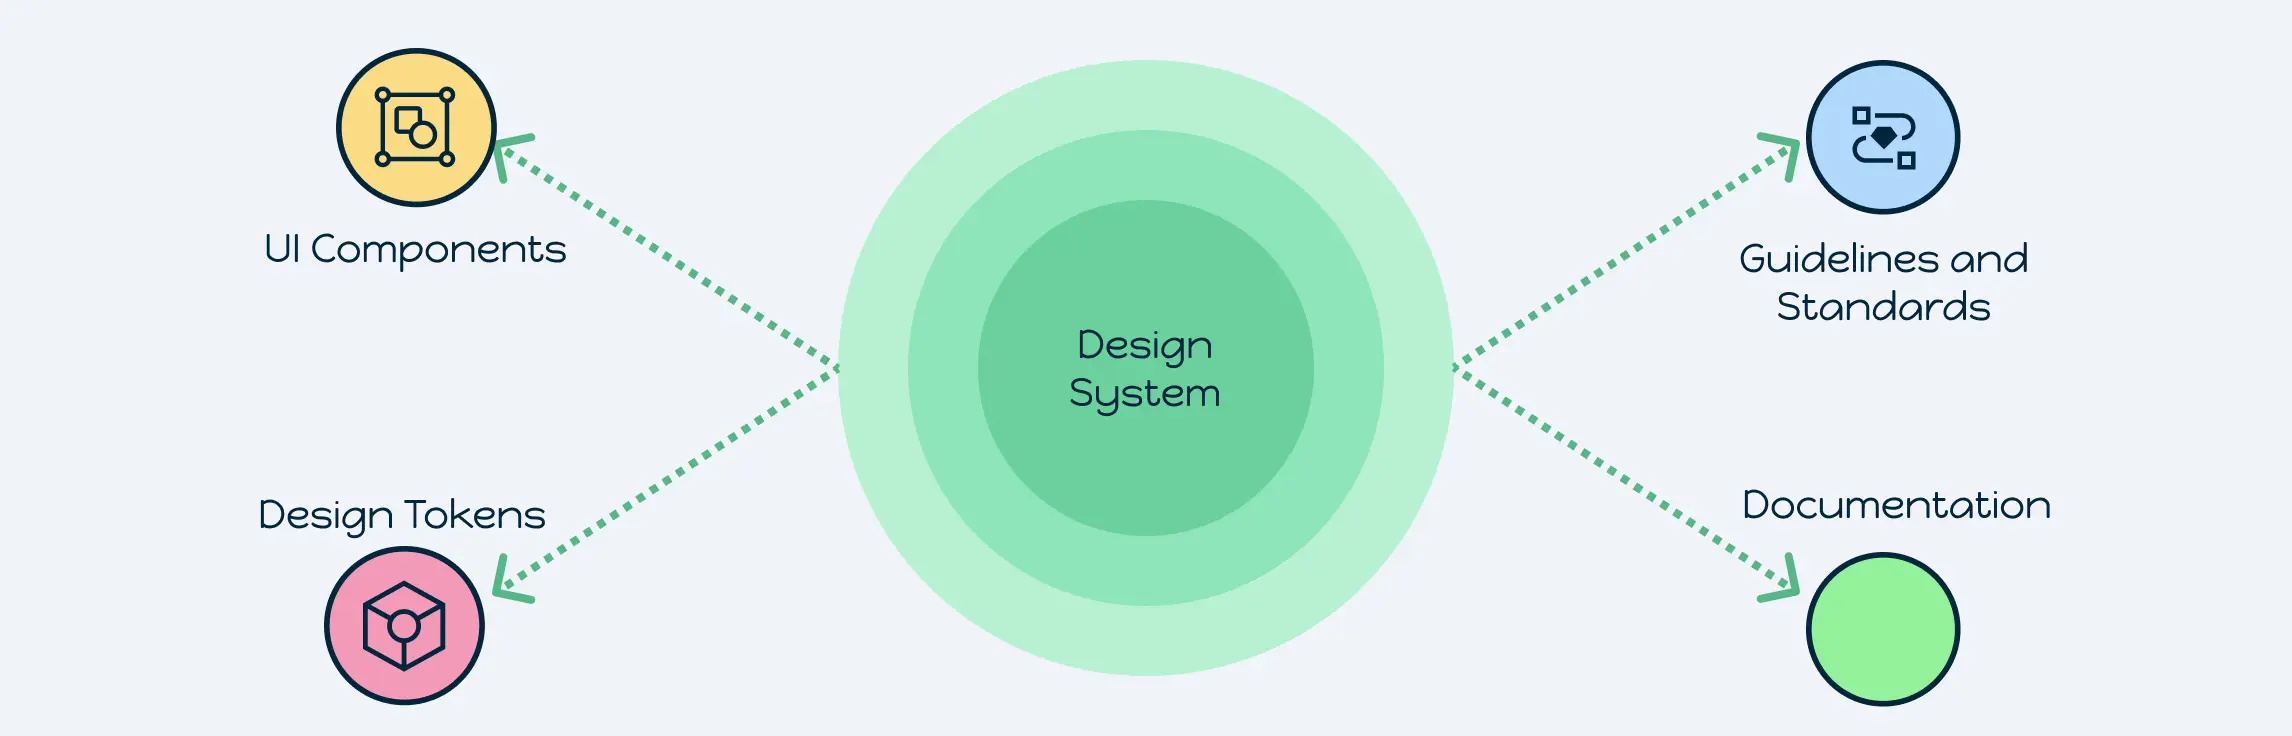
Struggling with inconsistent designs, repeated work, and misaligned teams? A design system is the solution. It’s a centralized framework that brings together reusable UI components, design tokens, and clear guidelines to create consistent and scalable digital products. Unlike standalone style guides, design systems go beyond visuals by providing governance, documentation, and standards that align design and development teams. In modern product design, they matter because they save time, reduce inconsistencies, and improve collaboration across teams. By using a shared design system, organizations achieve consistency in branding, efficiency in workflows, and smoother collaboration between designers, developers, and stakeholders. Read More
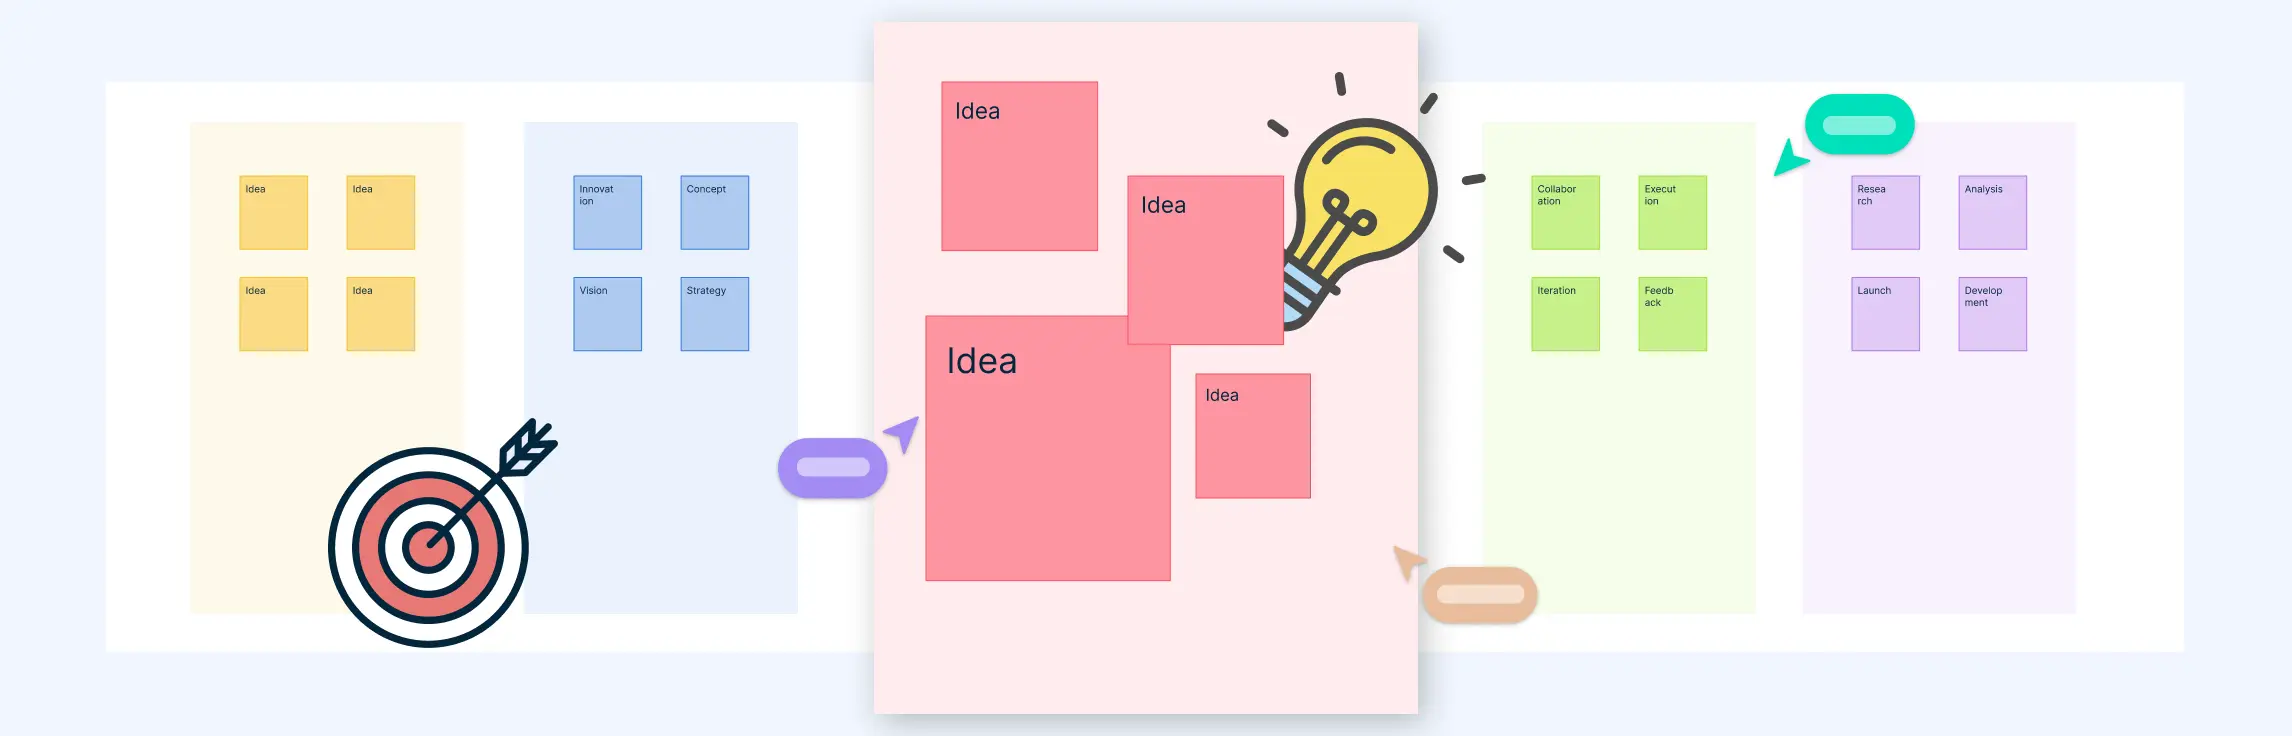
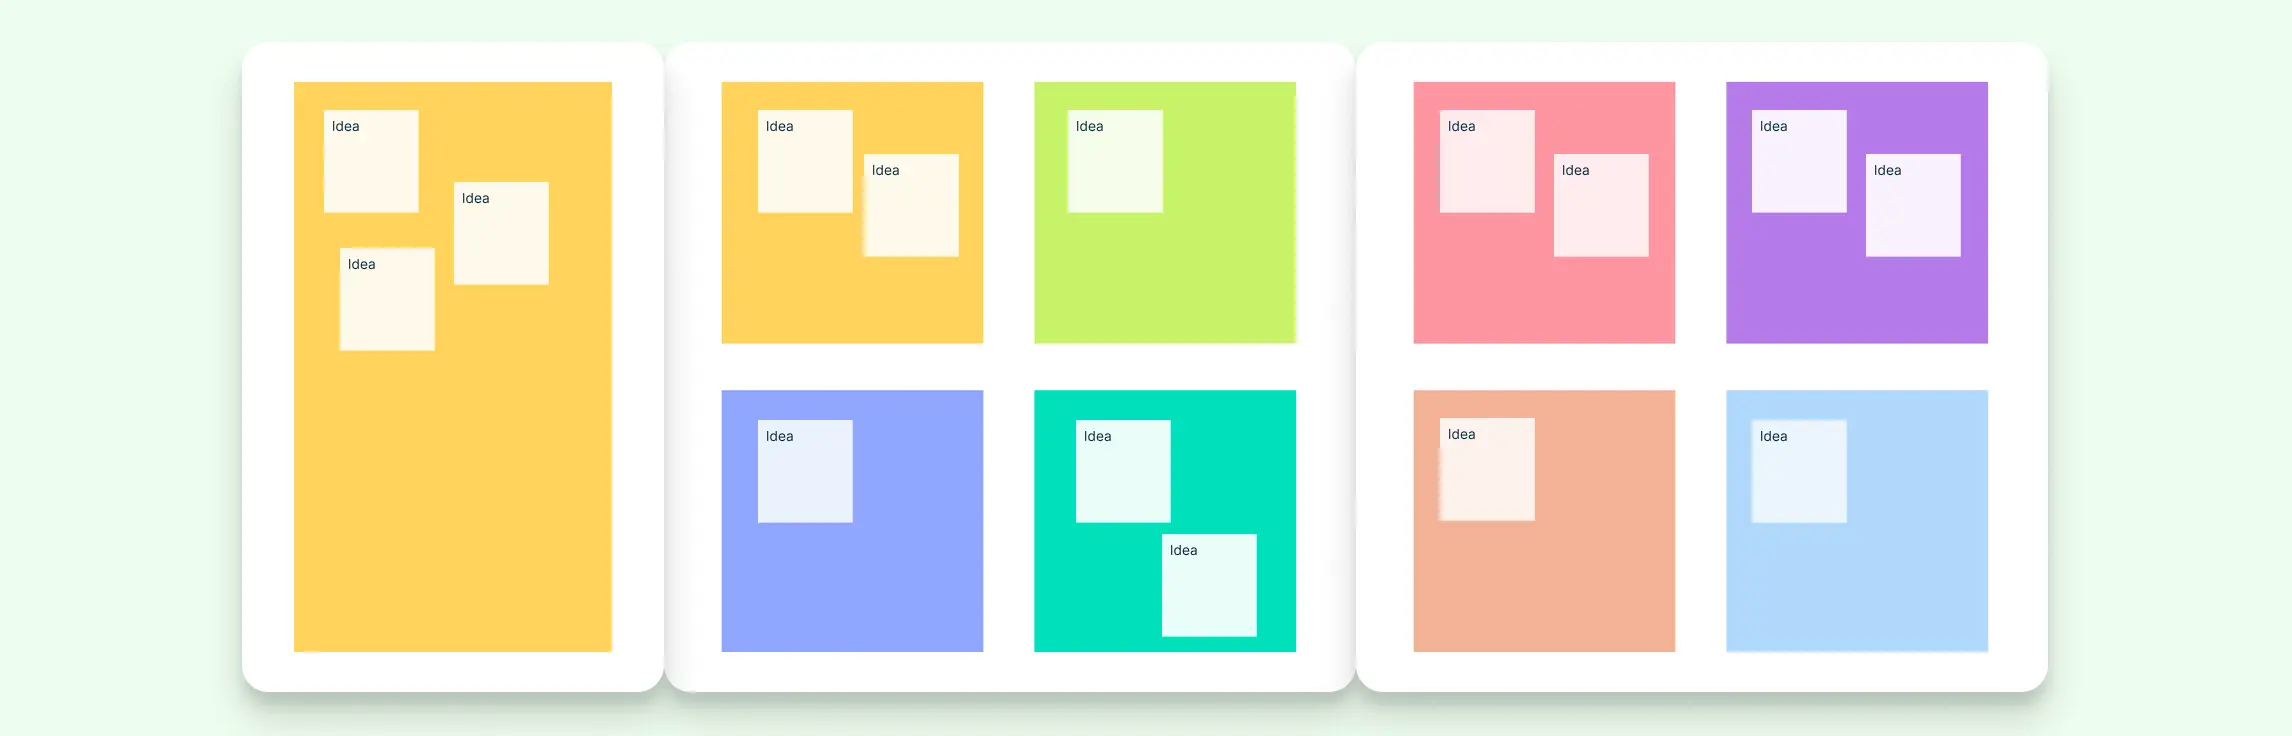
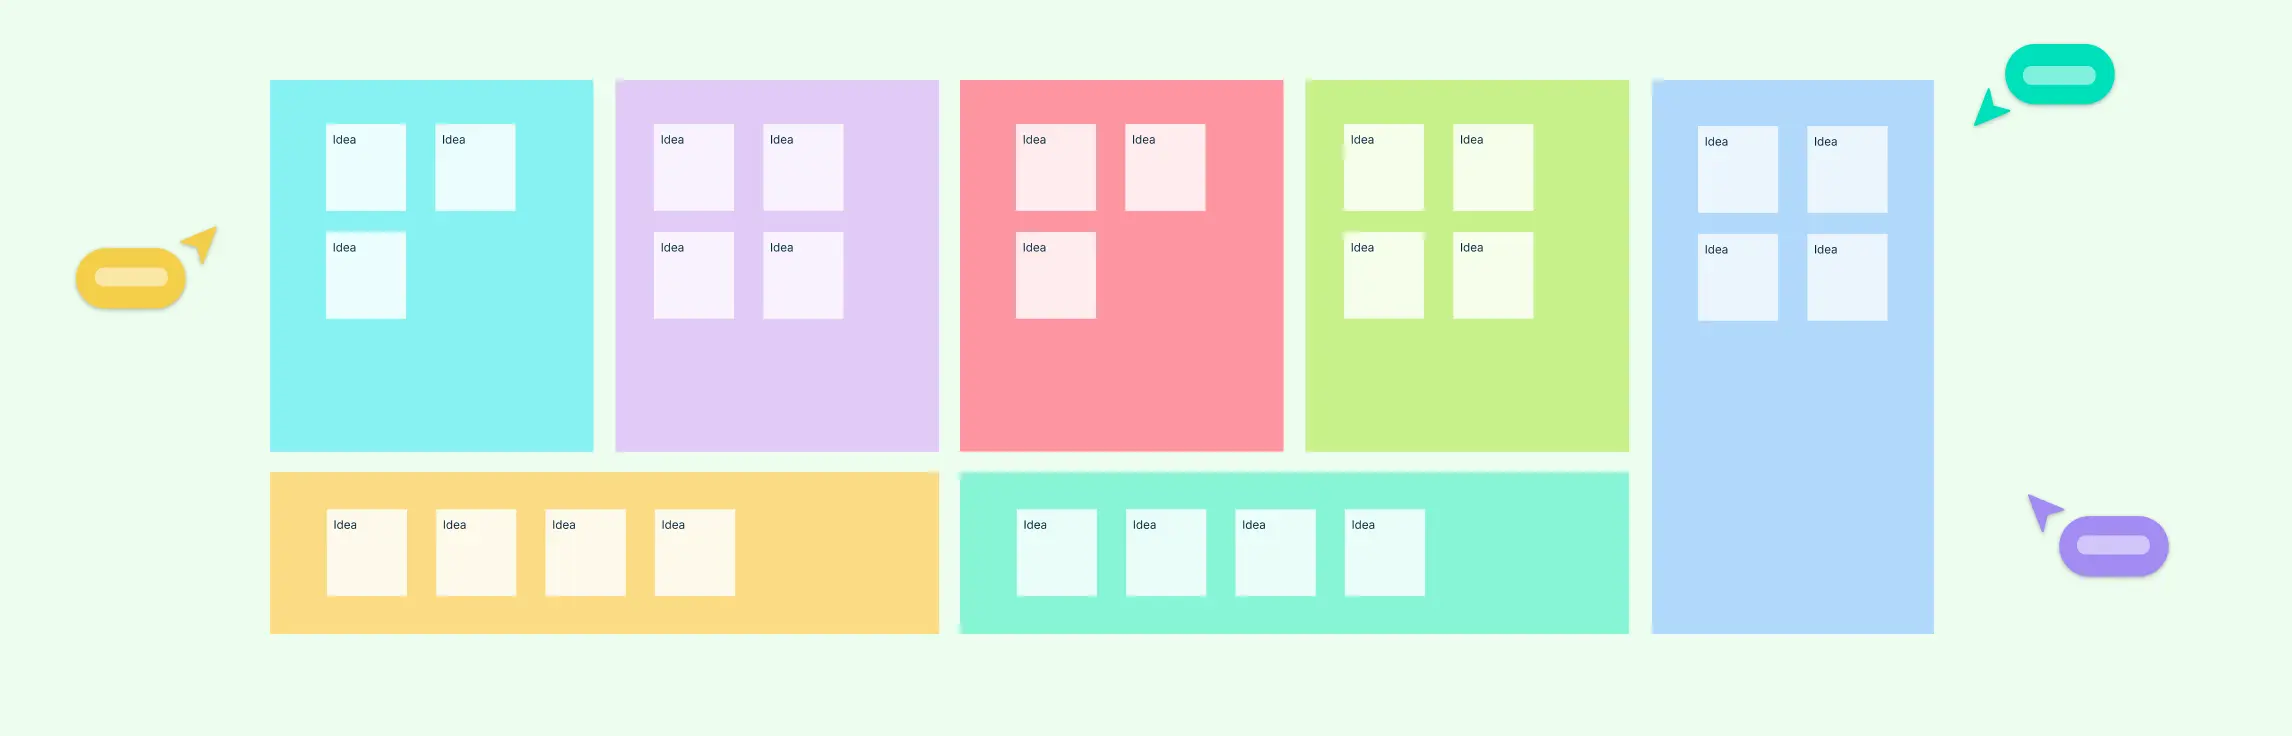
Ever feel like your ideas get lost in a jumble of sticky notes, spreadsheets, or scattered documents? That’s where an idea board comes in a simple, visual tool that brings clarity to creativity. Whether you’re brainstorming alone, collaborating with a team, or managing a complex project, a creative idea board or visual management board helps you see the big picture, organize thoughts, and turn concepts into actionable plans. Read More
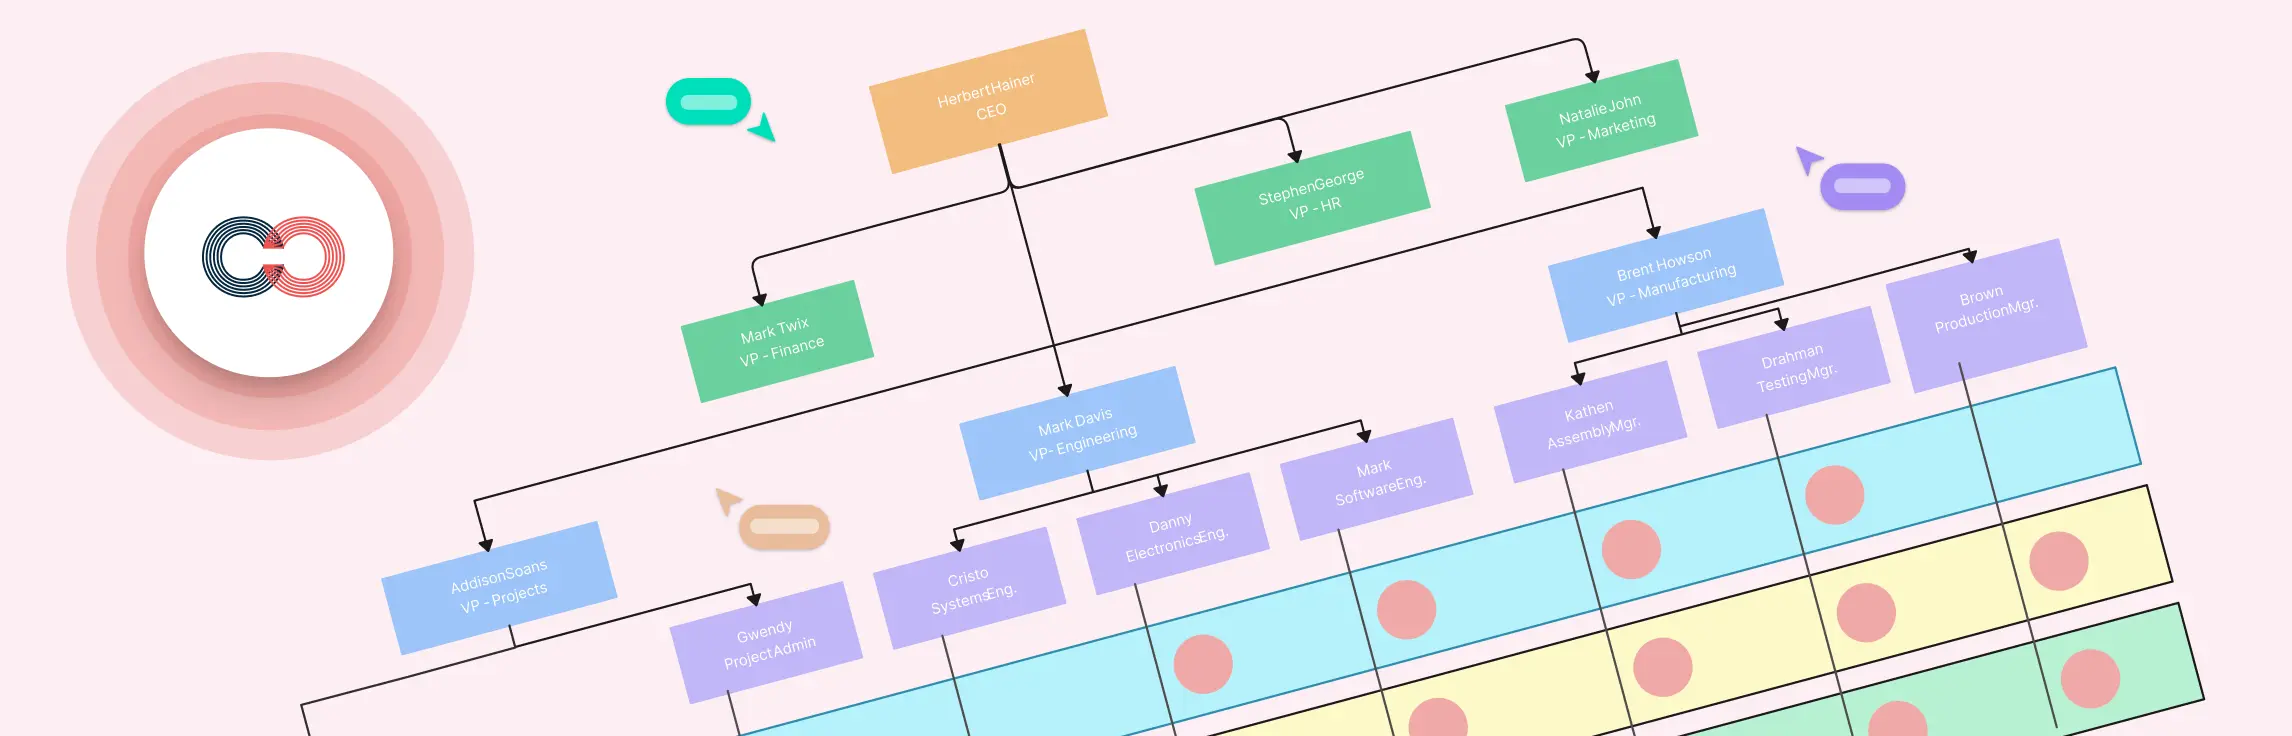
Ever felt lost in a tangle of dual reporting lines or overlapping project responsibilities? That’s the reality of many organizations, where employees often report to both functional managers and project leaders. A matrix organizational chart is the ultimate tool to cut through the confusion, offering a clear visual map of who reports to whom, which projects teams are working on, and how resources are allocated. In this guide, we’re sharing 10 practical matrix org chart examples that will help you simplify reporting lines, improve collaboration, and make your matrix organizational structure in project management work seamlessly. Read More
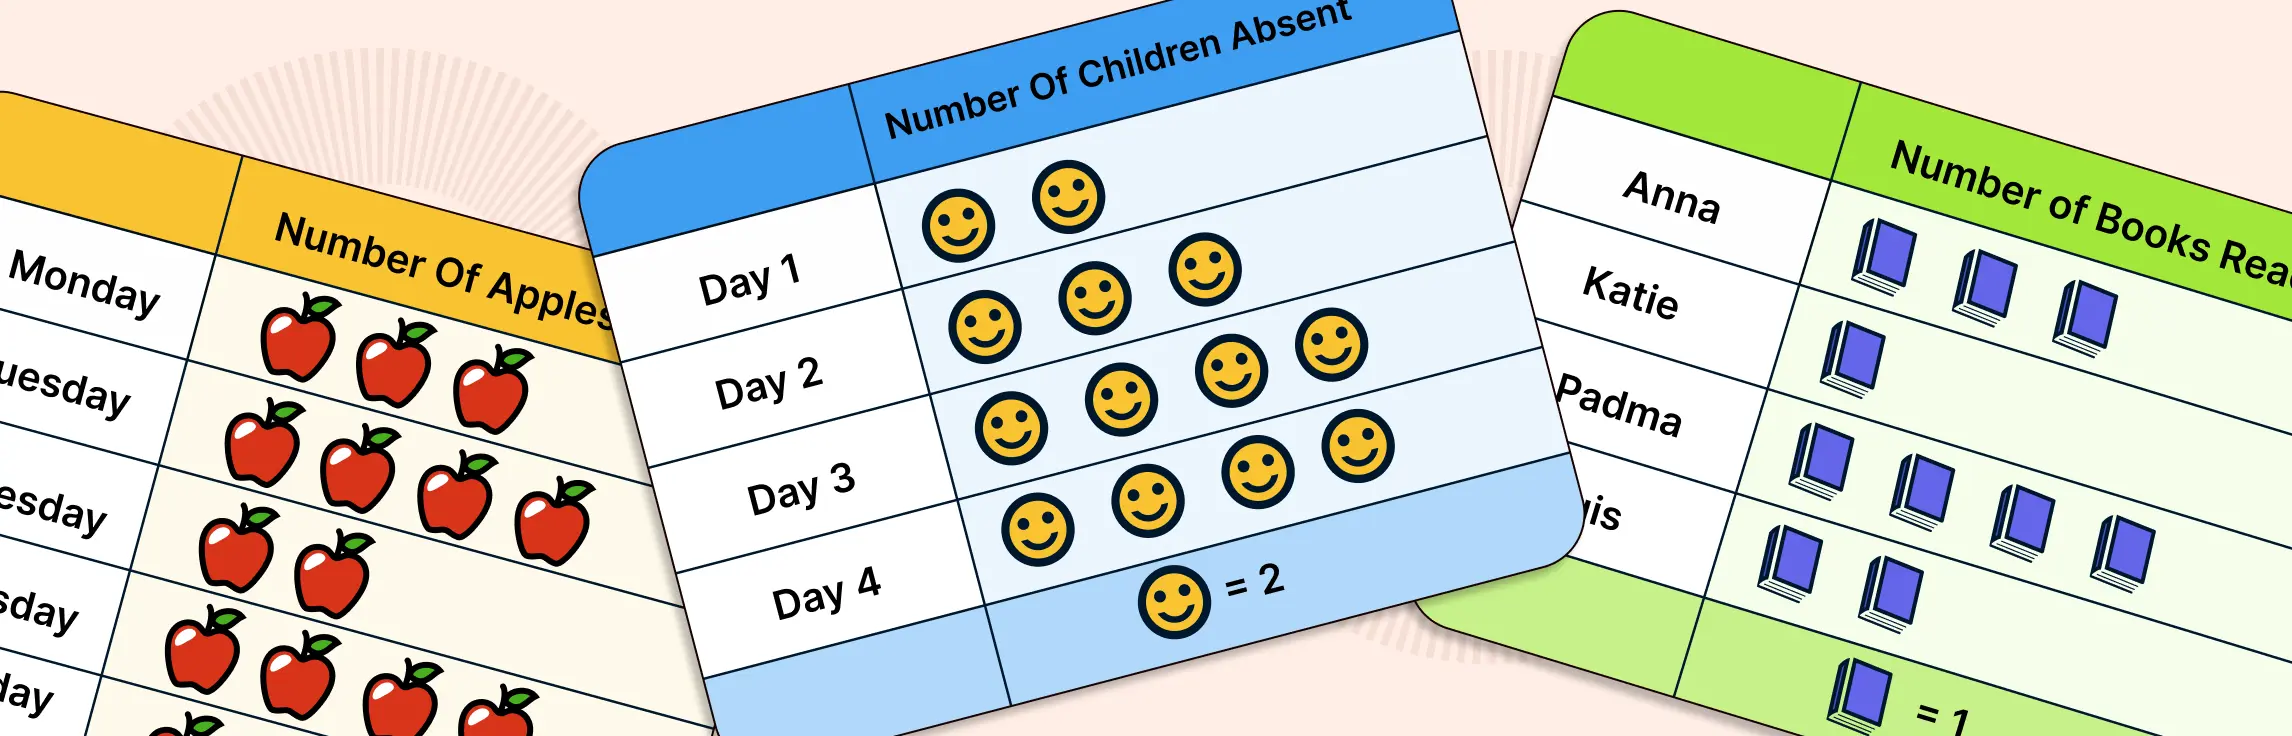
Ever struggled to make numbers or ideas instantly click with your audience? That’s where pictograms come in. Instead of overwhelming people with long tables or text, pictograms use simple icons and visuals to turn information into something clear and memorable. In this guide, you’ll learn how to make a pictograph step by step, explore ready-to-use templates, and discover best practices for creating designs that communicate with impact. Read More
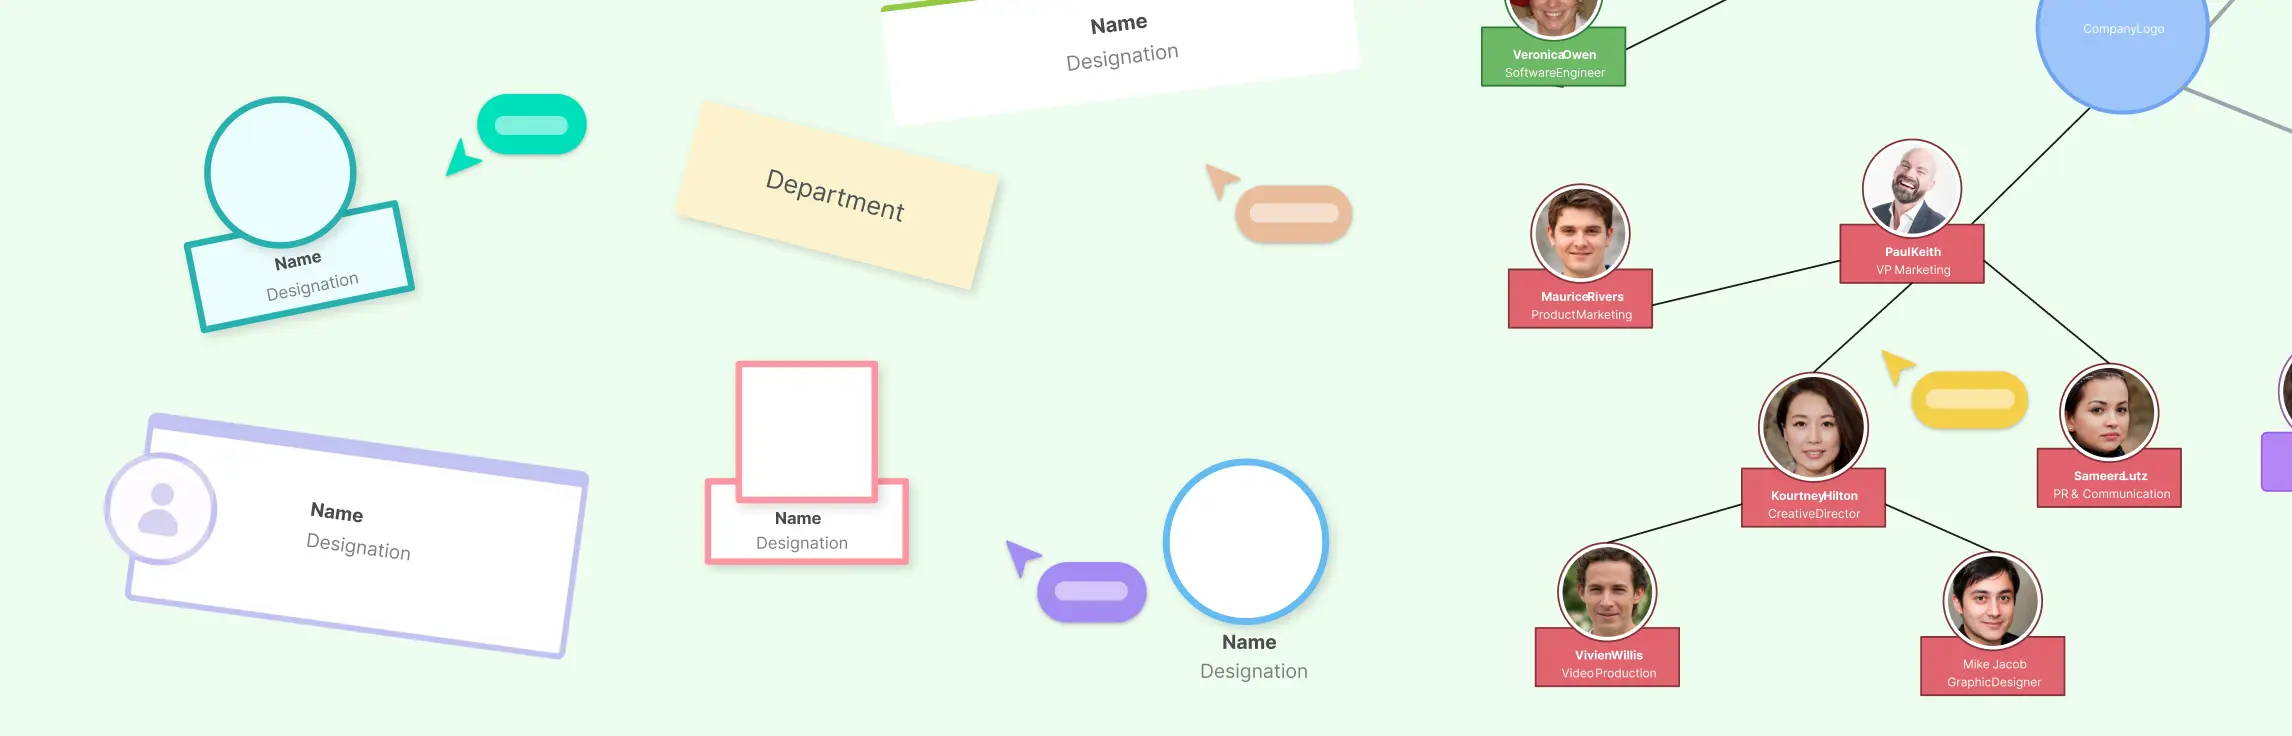
Ever stared at a company org chart and wondered what all those boxes, circles, and lines really mean? Those shapes aren’t just decorative. They’re powerful organizational chart symbols that communicate roles, responsibilities, and reporting relationships at a glance. From a single department to an entire corporation, knowing the org chart symbols’ meanings helps you visualize hierarchies, streamline workflows, and improve team collaboration. In this guide, we’ll break down the most common org chart icons, explain their uses, and share practical templates to help you create clear, professional organizational charts that everyone can understand. Read More
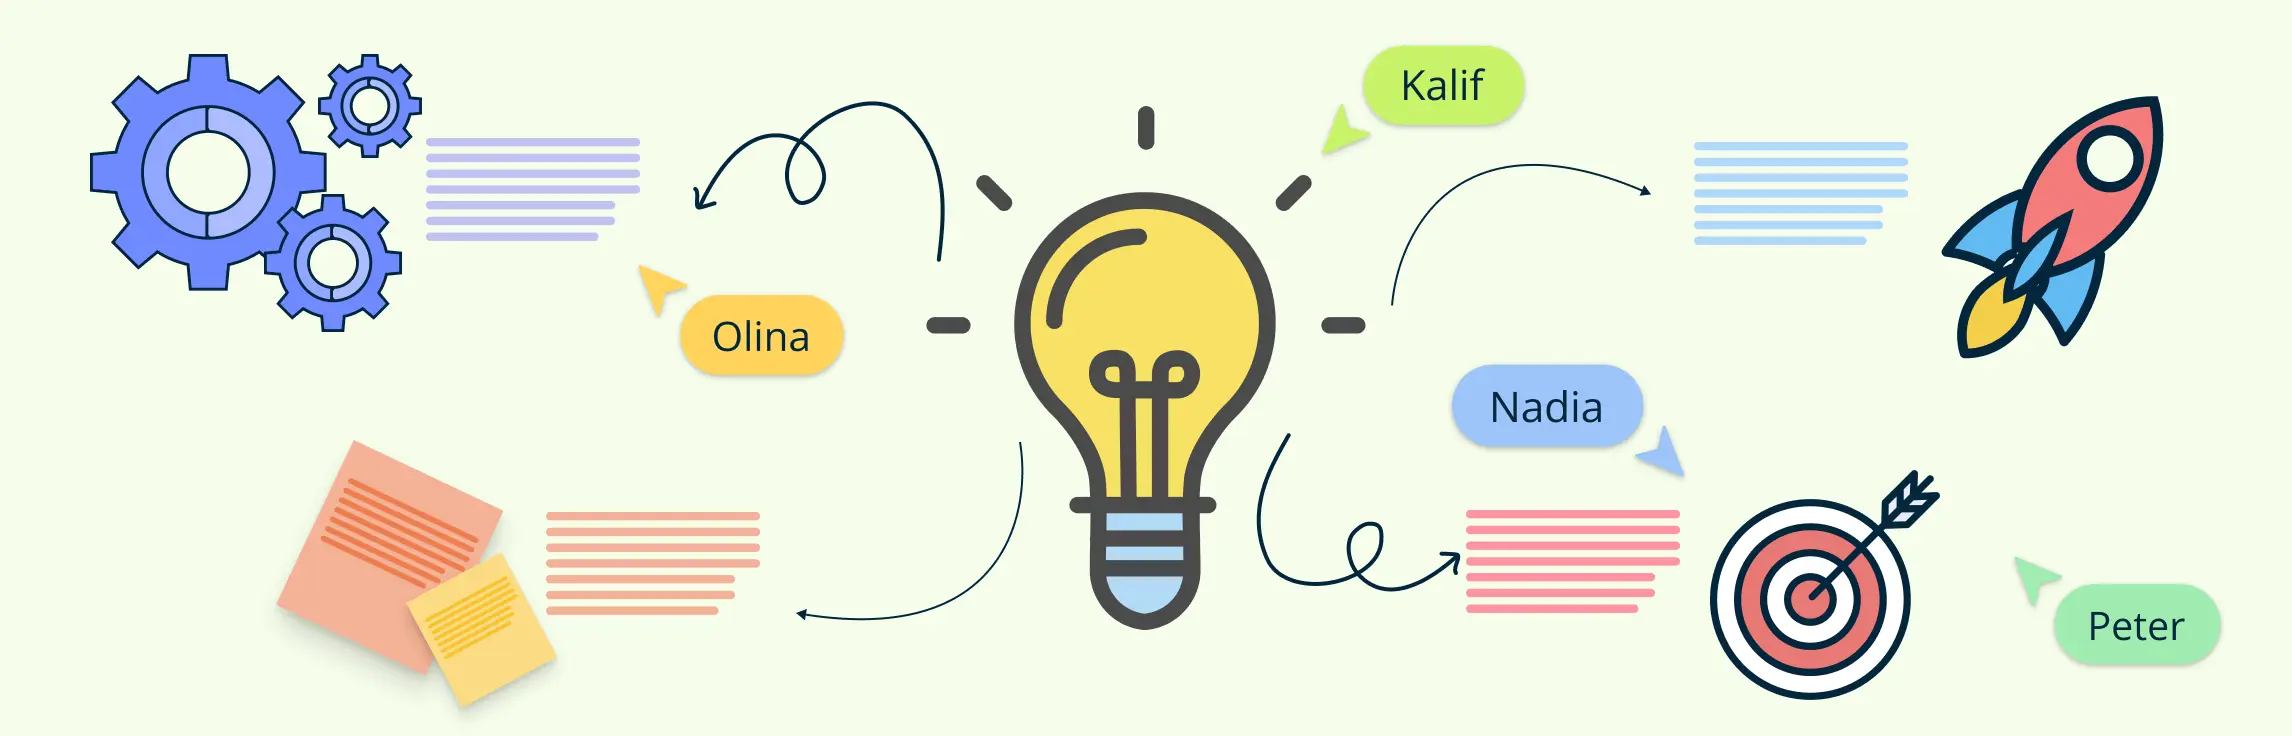
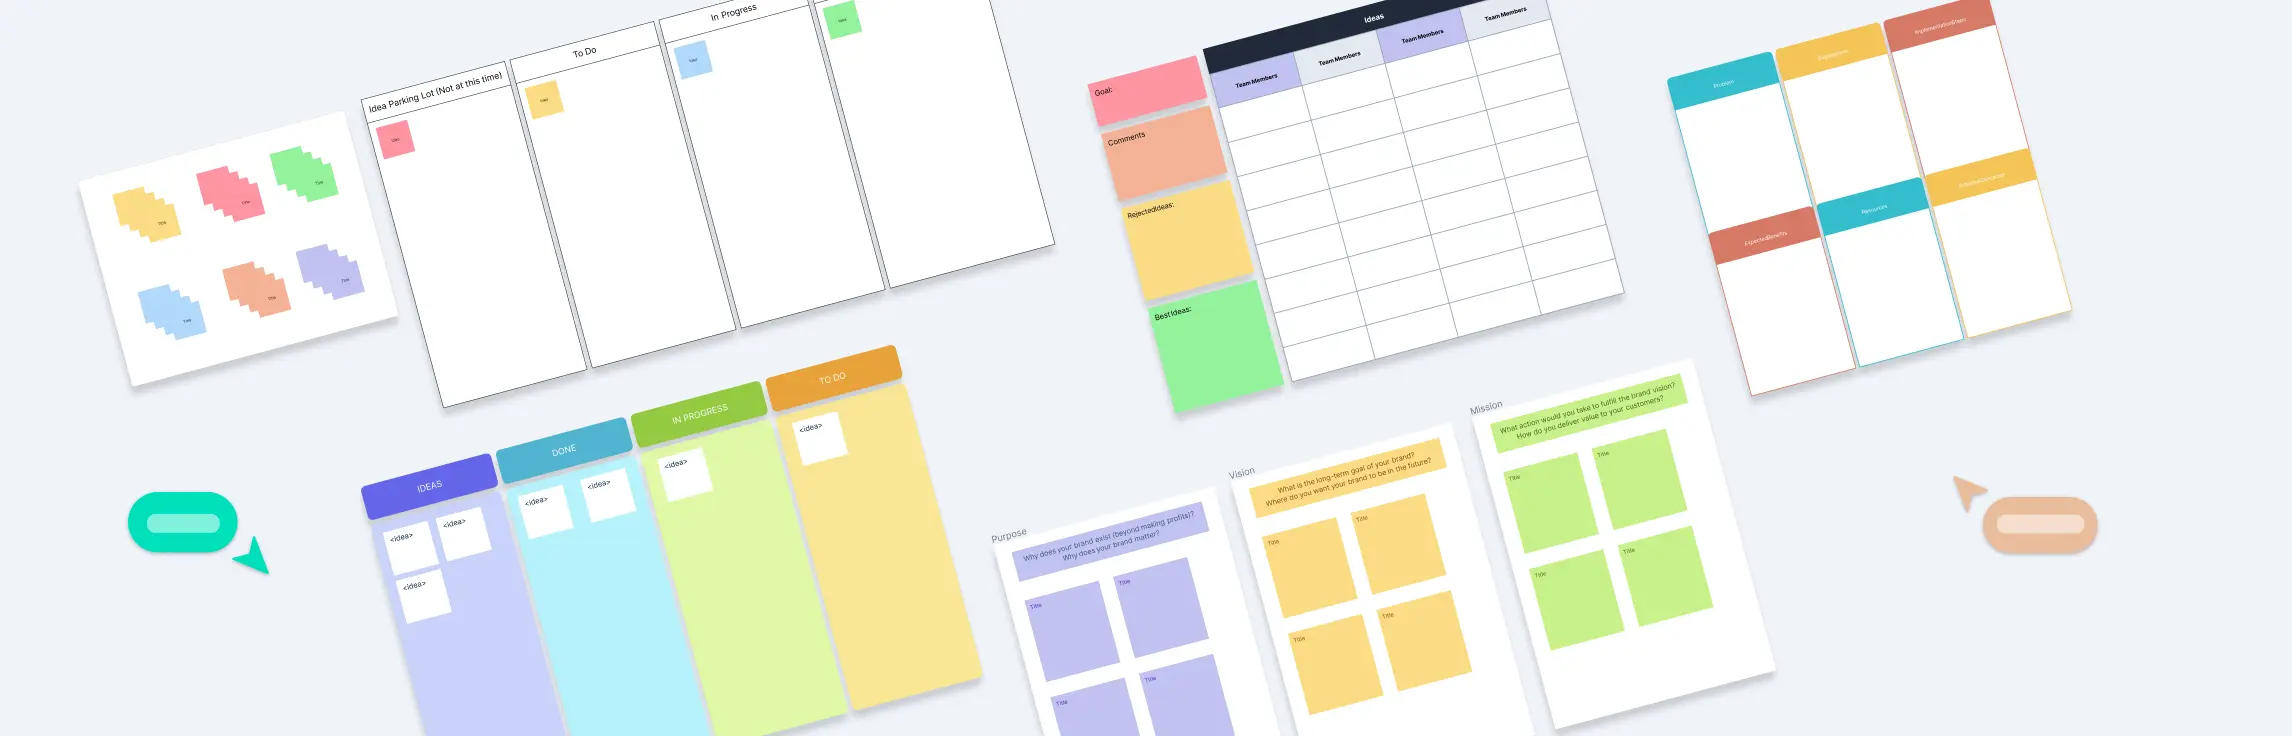
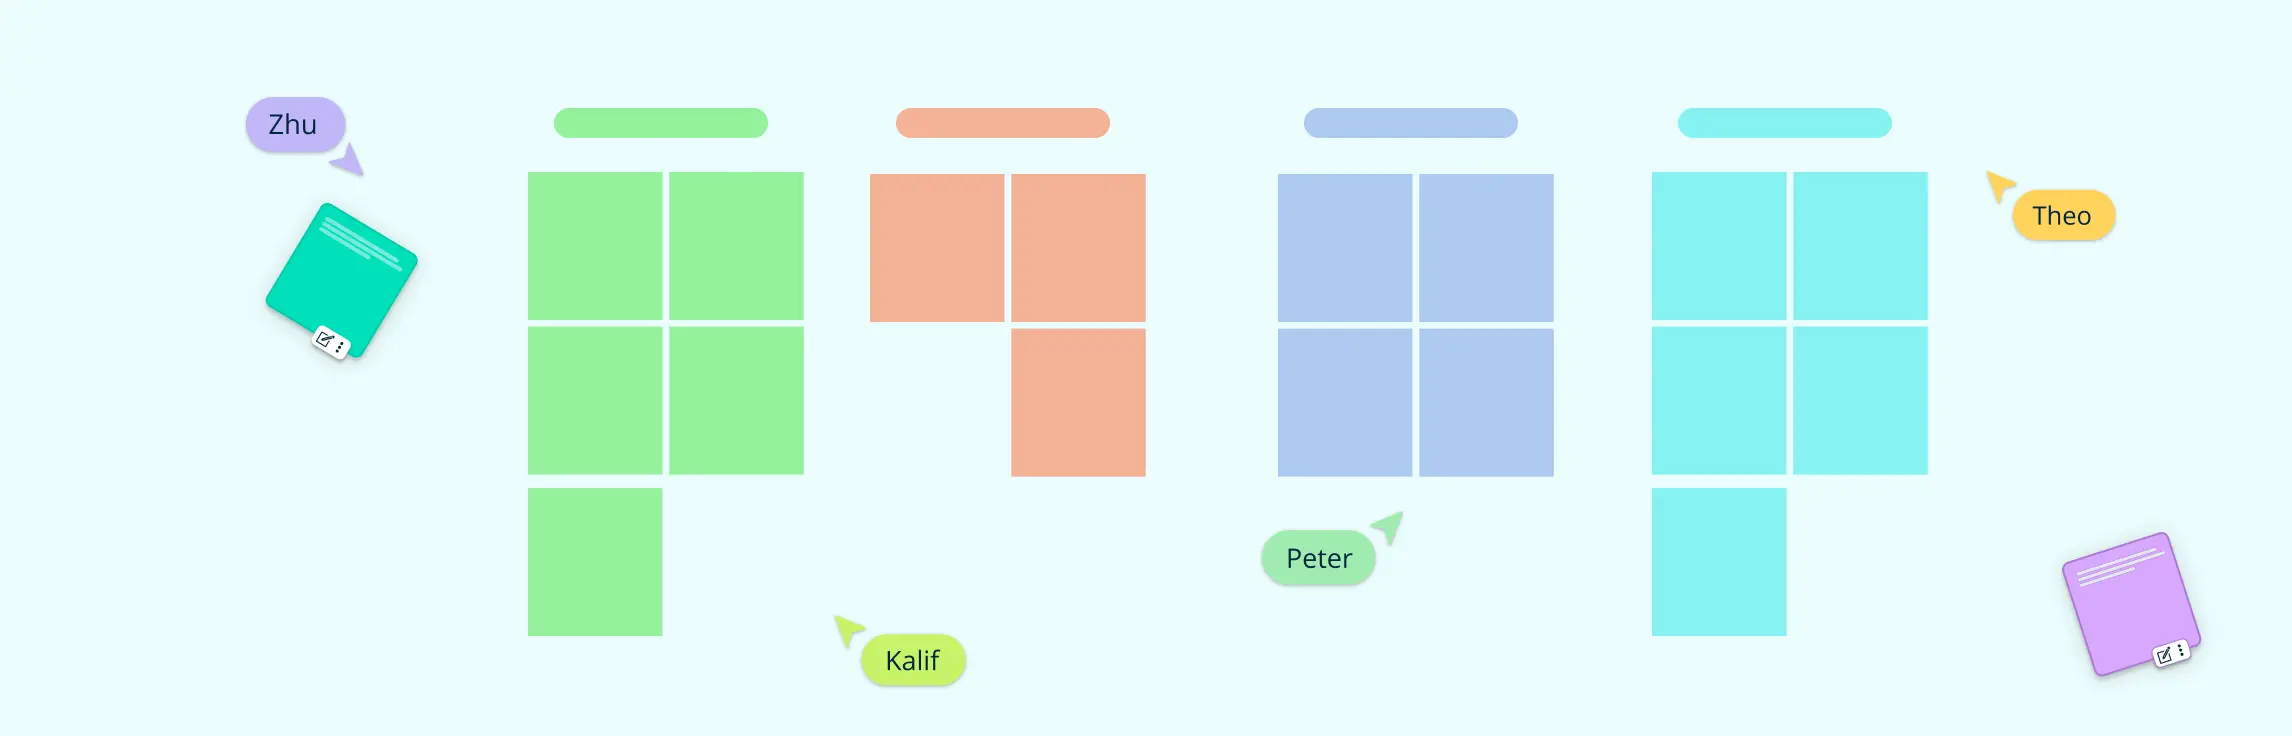
Innovation starts with a single spark — a great idea. But turning that spark into a breakthrough requires more than just creativity; it demands a clear, collaborative space where ideas can grow, connect, and evolve. That’s where a Board of Ideas comes in. Whether you’re leading a startup, managing a team, or driving strategic change, a well-structured ideation board acts as the foundation for capturing and shaping innovation. In this guide, we’ll explore what an idea generation board is, how to set one up effectively, and how to use proven frameworks and tools to unlock your team’s creative potential. Let’s dive in and transform the way you innovate. Read More
In today’s fast-paced world, keeping project ideas organized and turning them into actionable plans can be a challenge, especially for remote and hybrid teams. An idea whiteboard offers a simple yet powerful way to capture, visualize, and collaborate on ideas all in one place. Whether you’re brainstorming, planning, or tracking progress, this digital tool helps teams stay aligned and creative. In this guide, you’ll learn what an idea mapping whiteboard is, why it’s essential for projects, how to use it effectively, and discover ready-to-use templates that make getting started easy. Read More
A therapy genogram is a clinical diagnostic tool used to map out family relationships, emotional dynamics, hereditary patterns, and psychosocial factors that influence a patient’s mental and physical health. Unlike a family tree, a genogram integrates clinical data—such as psychiatric history, behavioral patterns, and systemic relational dynamics—to inform assessments and treatment plans. Read More
In today’s fast-paced, collaborative environments, having a structured space to capture and grow ideas is essential. Idea boards for work provide that space, serving as a digital hub where teams brainstorm, organize thoughts, and align on next steps. Whether you’re planning a product roadmap, leading a workshop, or ideating a new campaign, idea boards keep your team focused, engaged, and moving forward. Read More
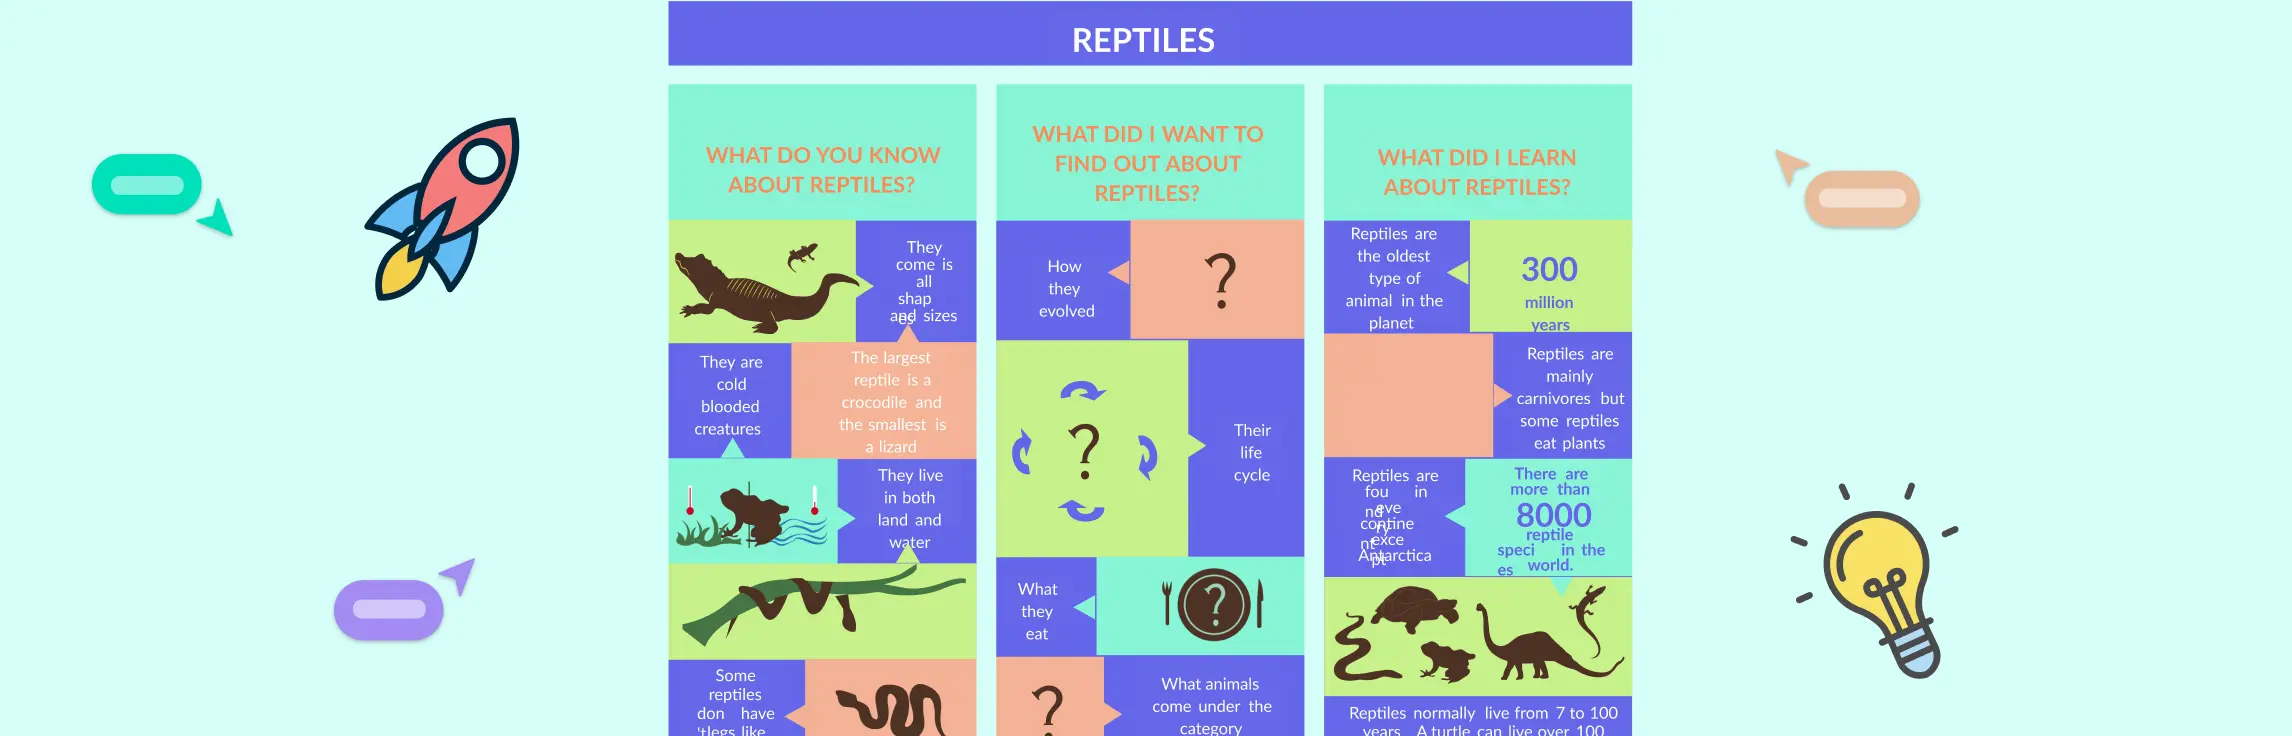
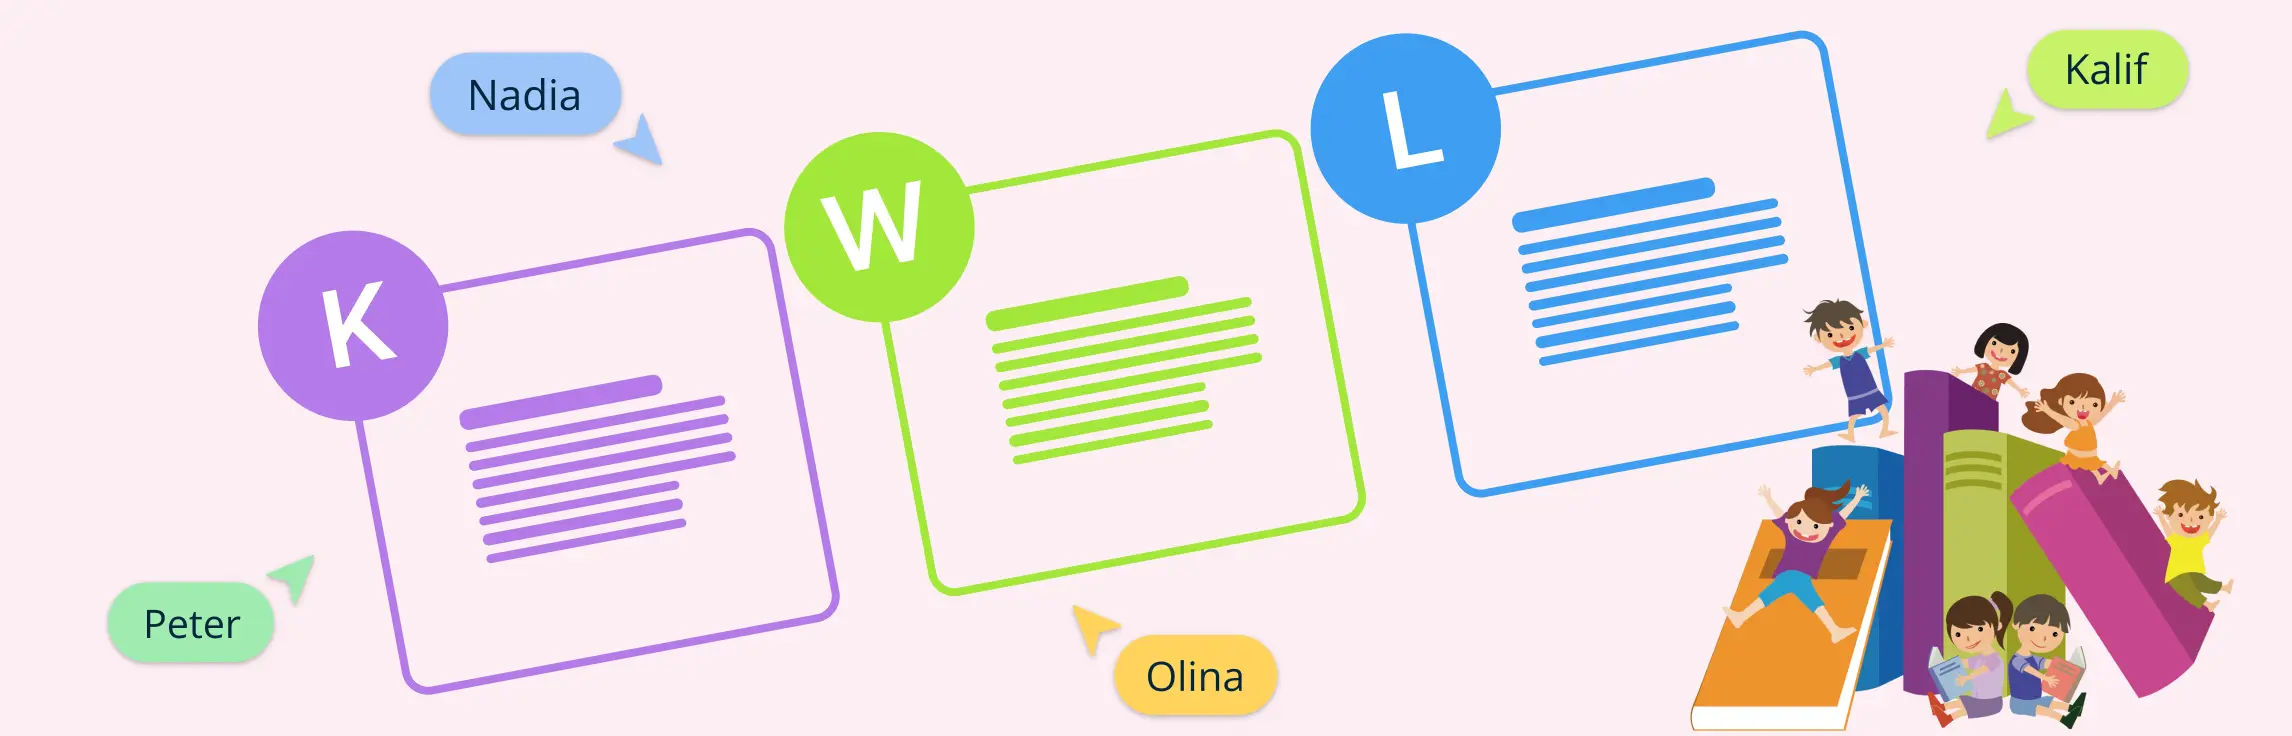
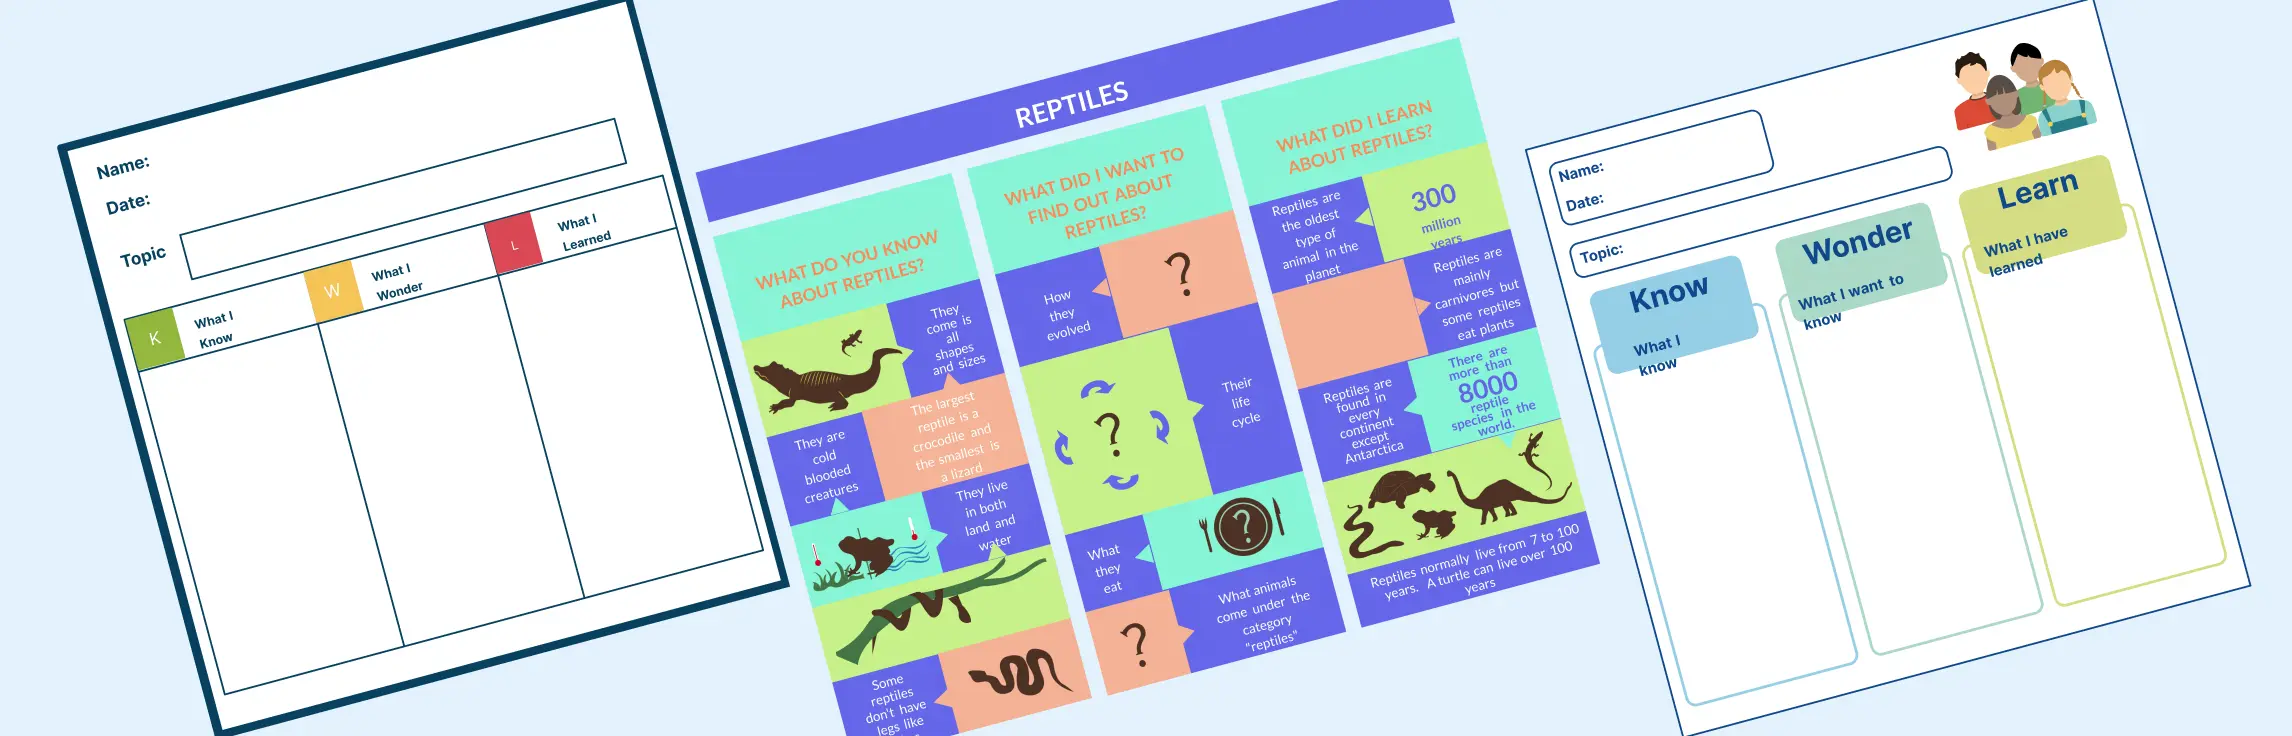
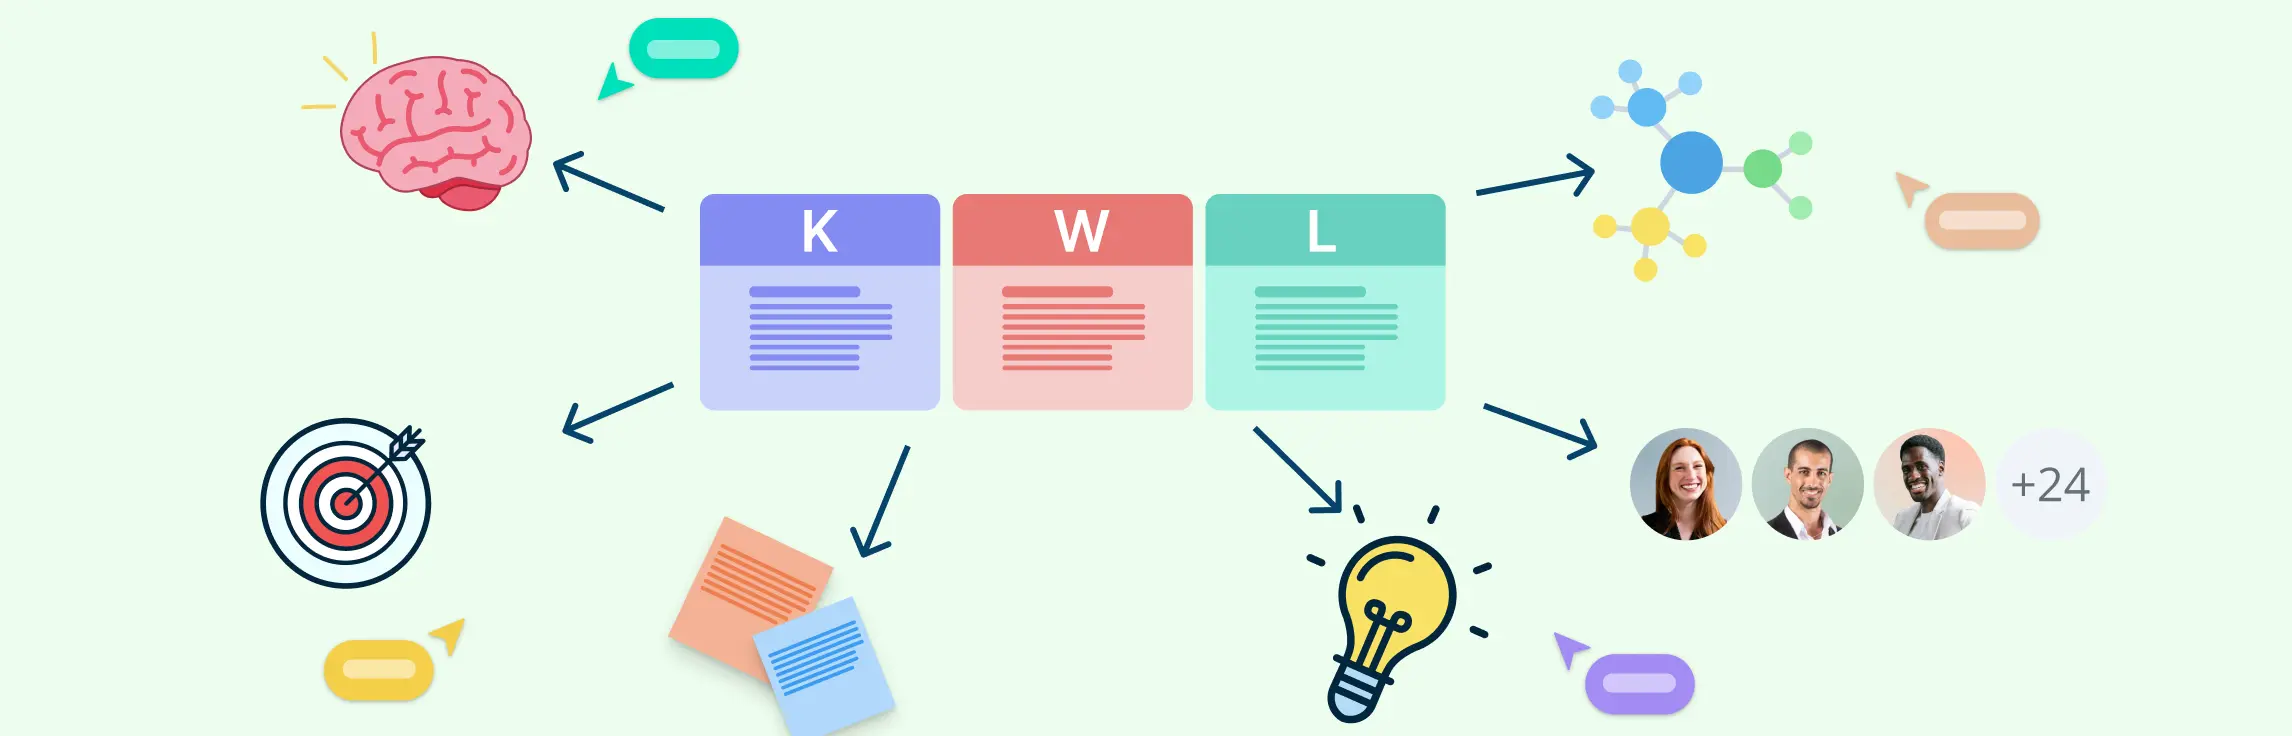
A KWL graphic organizer is a powerful visual tool that supports active learning by helping students track what they Know, Want to know, and Learned about a topic. Whether you’re teaching science, history, or reading comprehension, KWL charts promote structured thinking, engagement, and better knowledge retention. Read More
Ever faced a room full of blank stares before starting a new topic? The KWL reading strategy turns that uncertainty into curiosity. By helping learners tap into what they already know, define what they want to learn, and reflect on what they’ve discovered, this simple three-column method transforms reading into a focused, purpose-driven experience. Read More
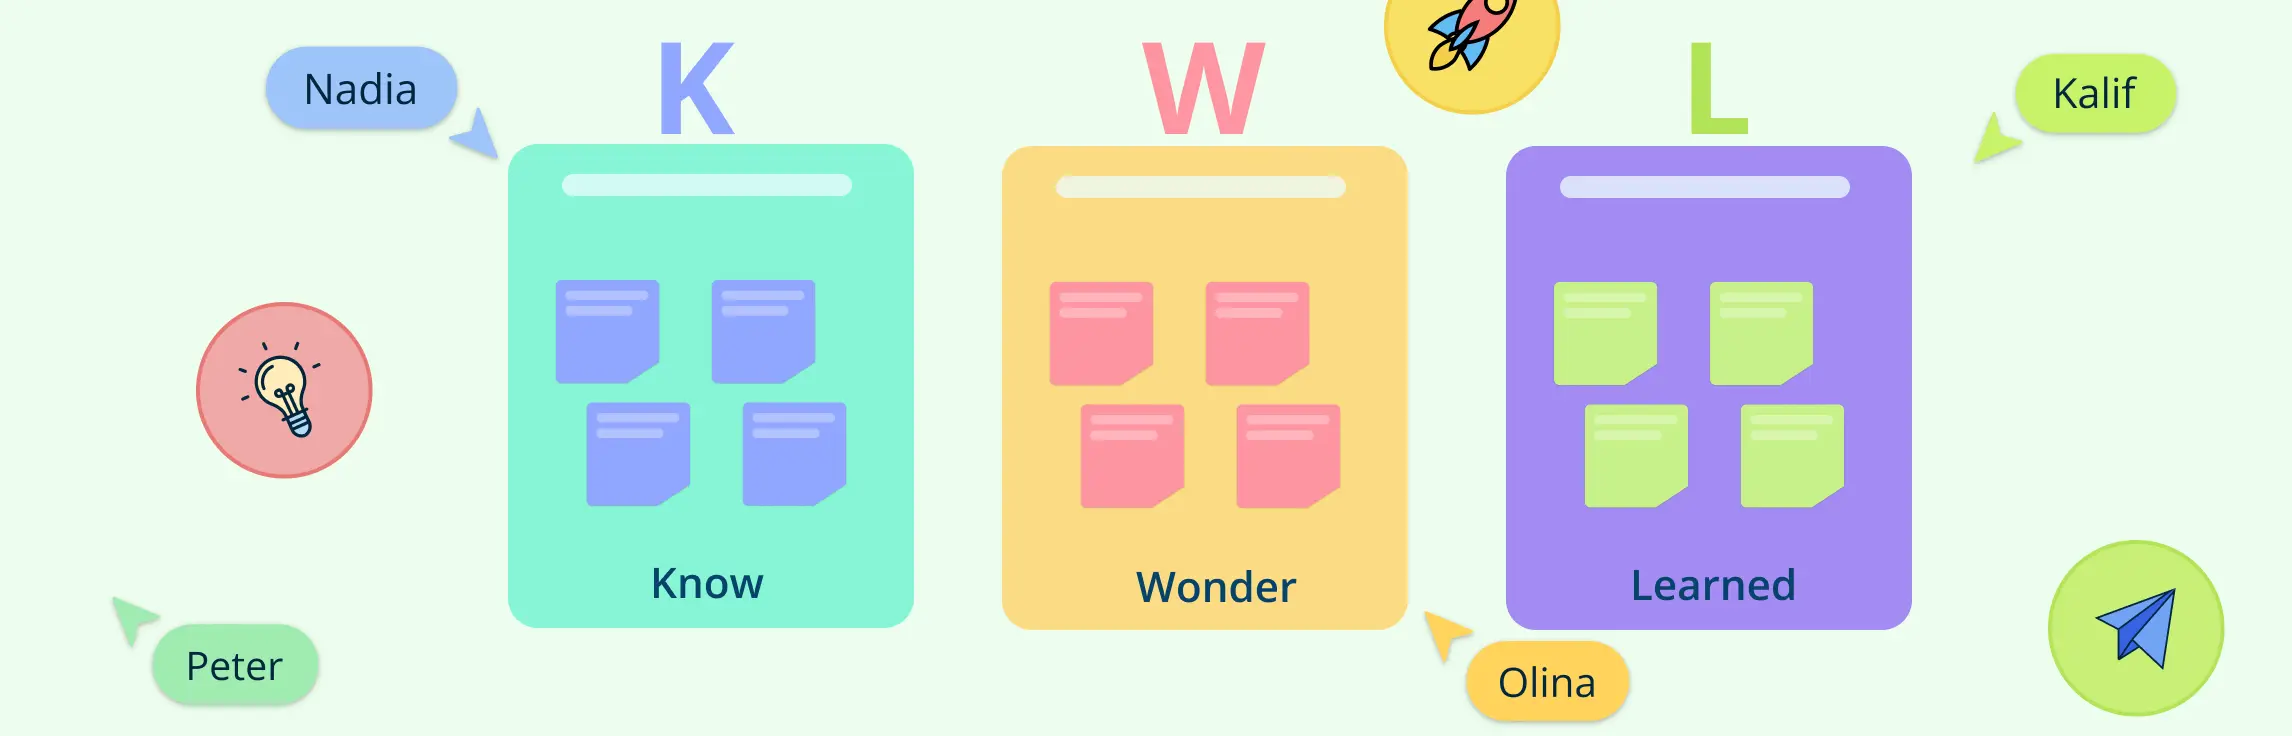
Ever wish your students were more curious, more engaged, and more reflective in their learning? That’s exactly what KWL teaching strategies are designed to spark. By asking students what they Know, what they Want to know, and later, what they’ve Learned, the KWL method turns passive learners into active participants. Whether you’re teaching science, history, or literature, a well-crafted KWL chart can structure lessons, personalize instruction, and fuel meaningful classroom conversations. Read More
In fast-moving hybrid work environments, capturing and prioritizing ideas across teams can be chaotic. That’s why more teams today are asking: What is an idea board? Read More
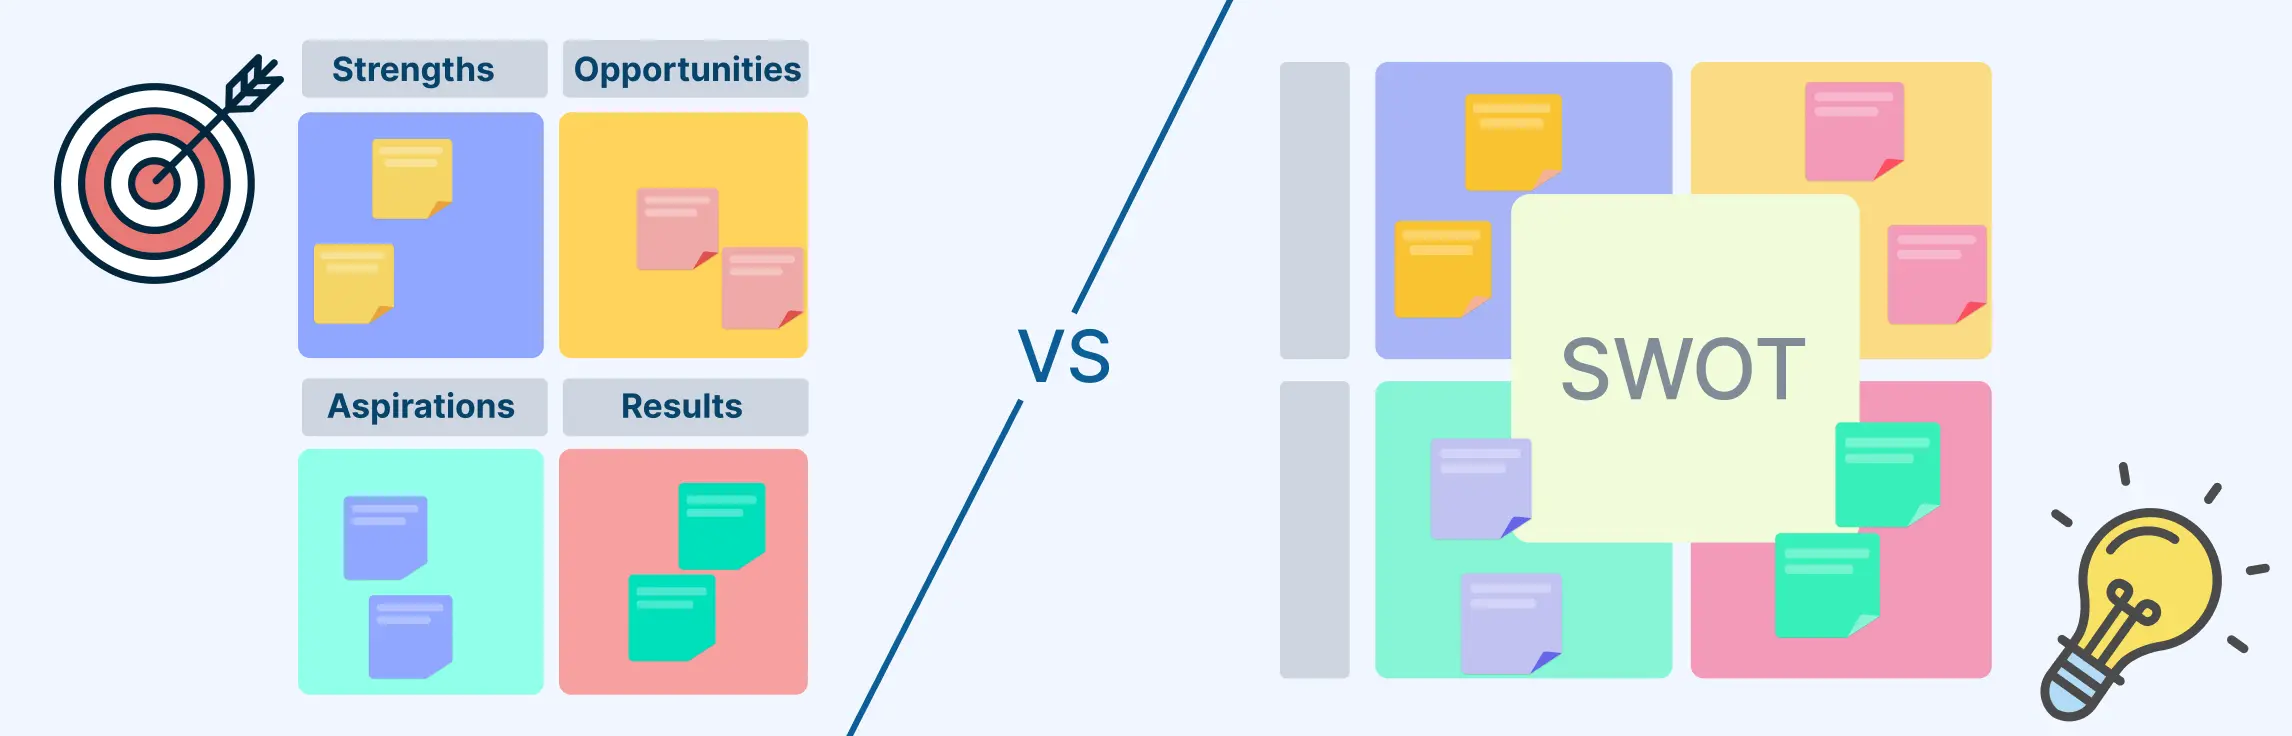
SOAR analysis is a strategic planning framework that emphasizes an organization’s Strengths, Opportunities, Aspirations, and Results. Unlike SWOT, which catalogs weaknesses and threats alongside strengths, SOAR focuses on current capabilities and future potential. Exploring 10 real-world SOAR examples in this guide demonstrates how SOAR drives actionable strategies and energizes every strategic planning session. Read More
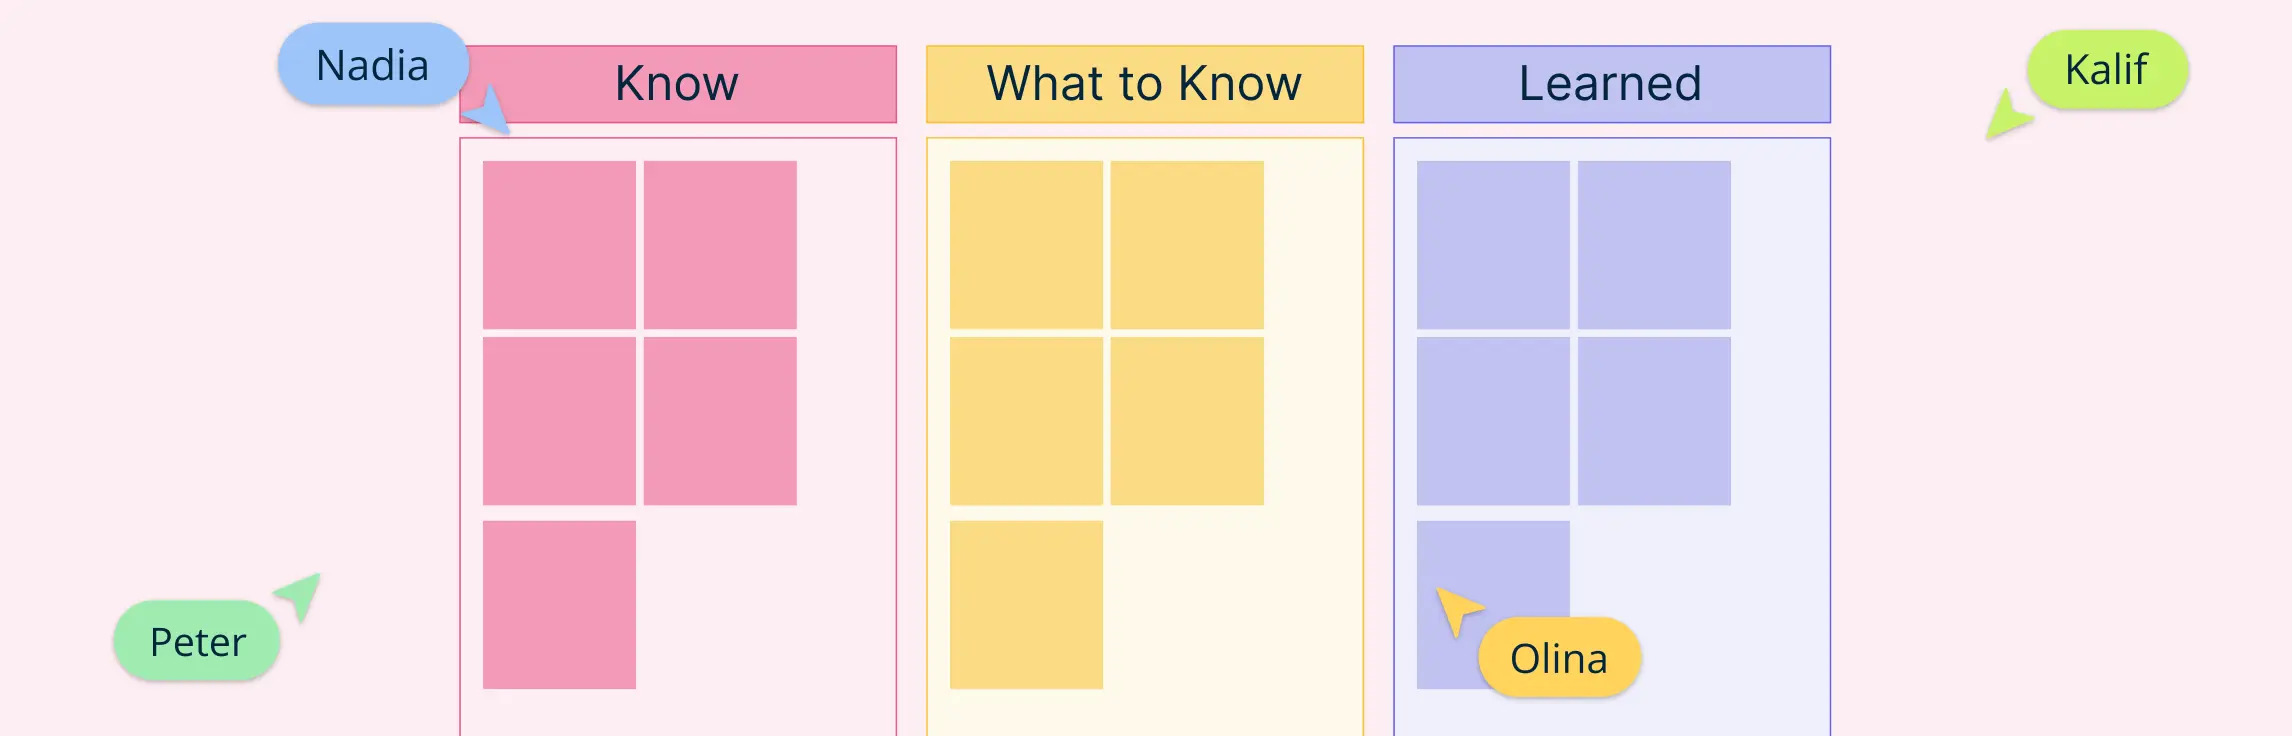
KWL charts are powerful tools for student-centered learning. They help learners activate prior knowledge, set learning goals, and reflect on what they’ve learned. Whether you’re teaching preschoolers or high school students, KWL chart examples can bring structure and engagement to any subject, from science and math to English and vocabulary. Read More
A KWL chart is one of the simplest yet most effective tools to engage students in active learning. Short for Know, Want to Know, and Learned, this graphic organizer helps learners structure their thinking, ask better questions, and reflect on their progress. Read More
The KWL strategy is a three-phase graphic organizer used before, during, and after learning. It helps activate prior knowledge, guide inquiry, and promote reflection. Read More
Ever felt like your lessons or training sessions lack direction? You’re not alone. Whether in a classroom, boardroom, or workshop, unstructured learning often leads to confusion, missed goals, and disengaged participants. That’s where KWL charts come in—a simple yet powerful tool that turns scattered thoughts into purposeful learning. Read More
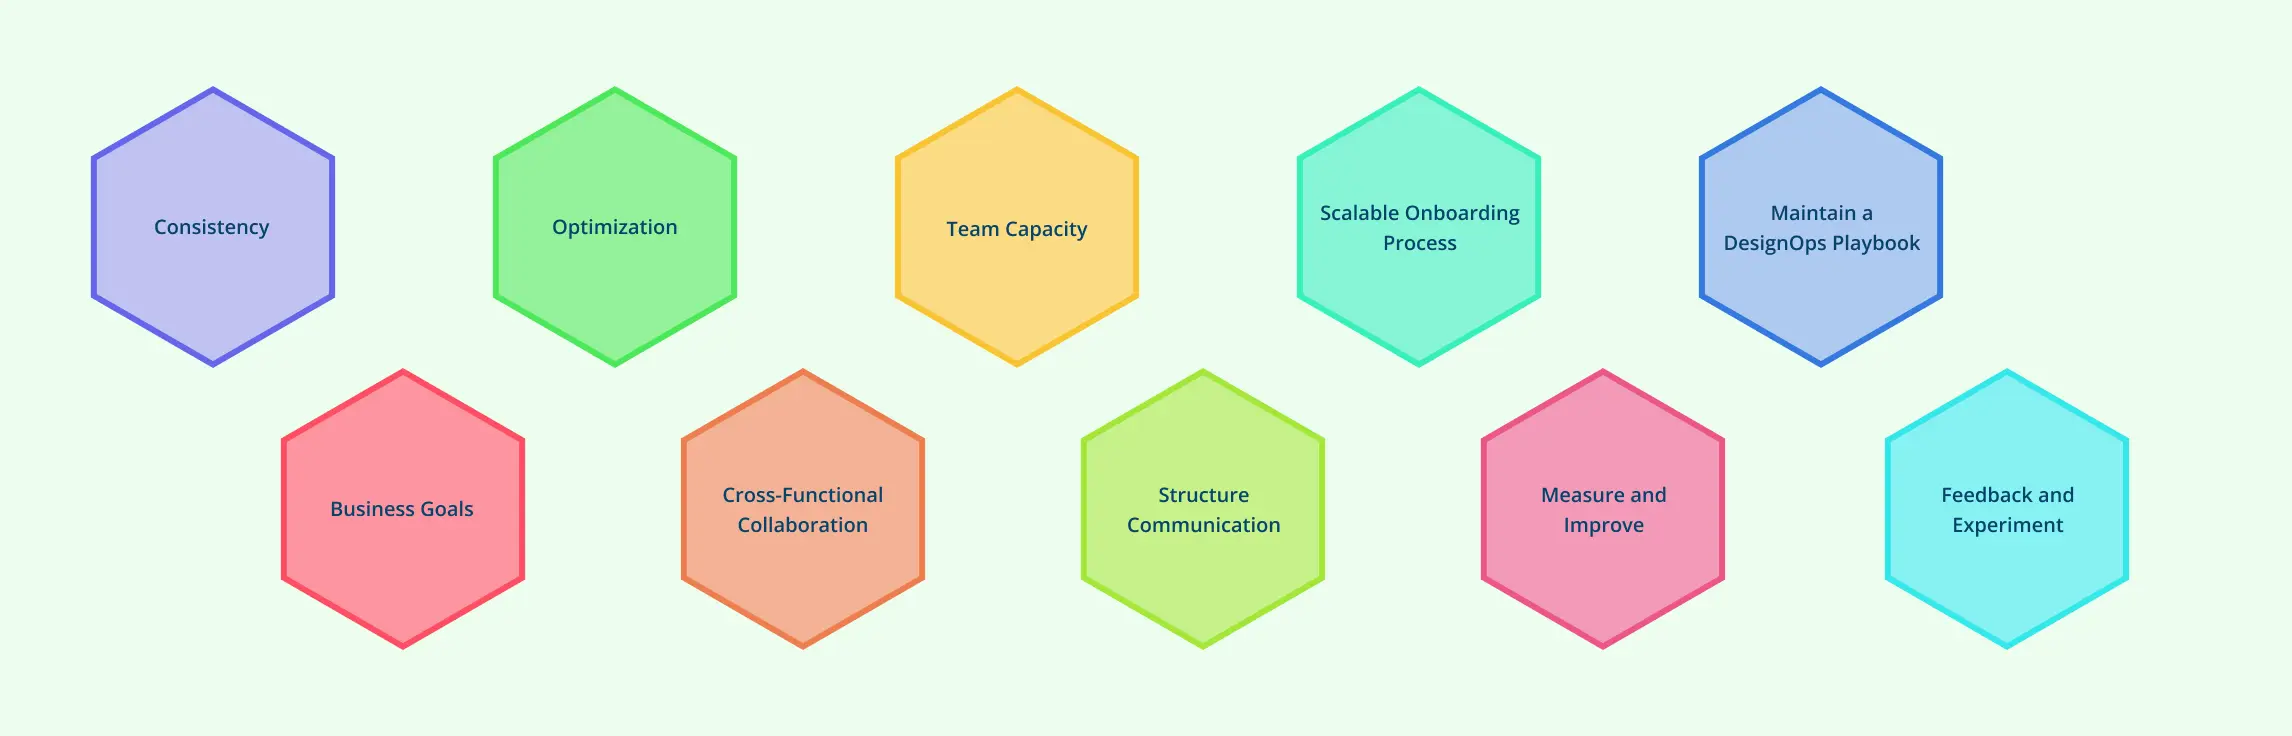
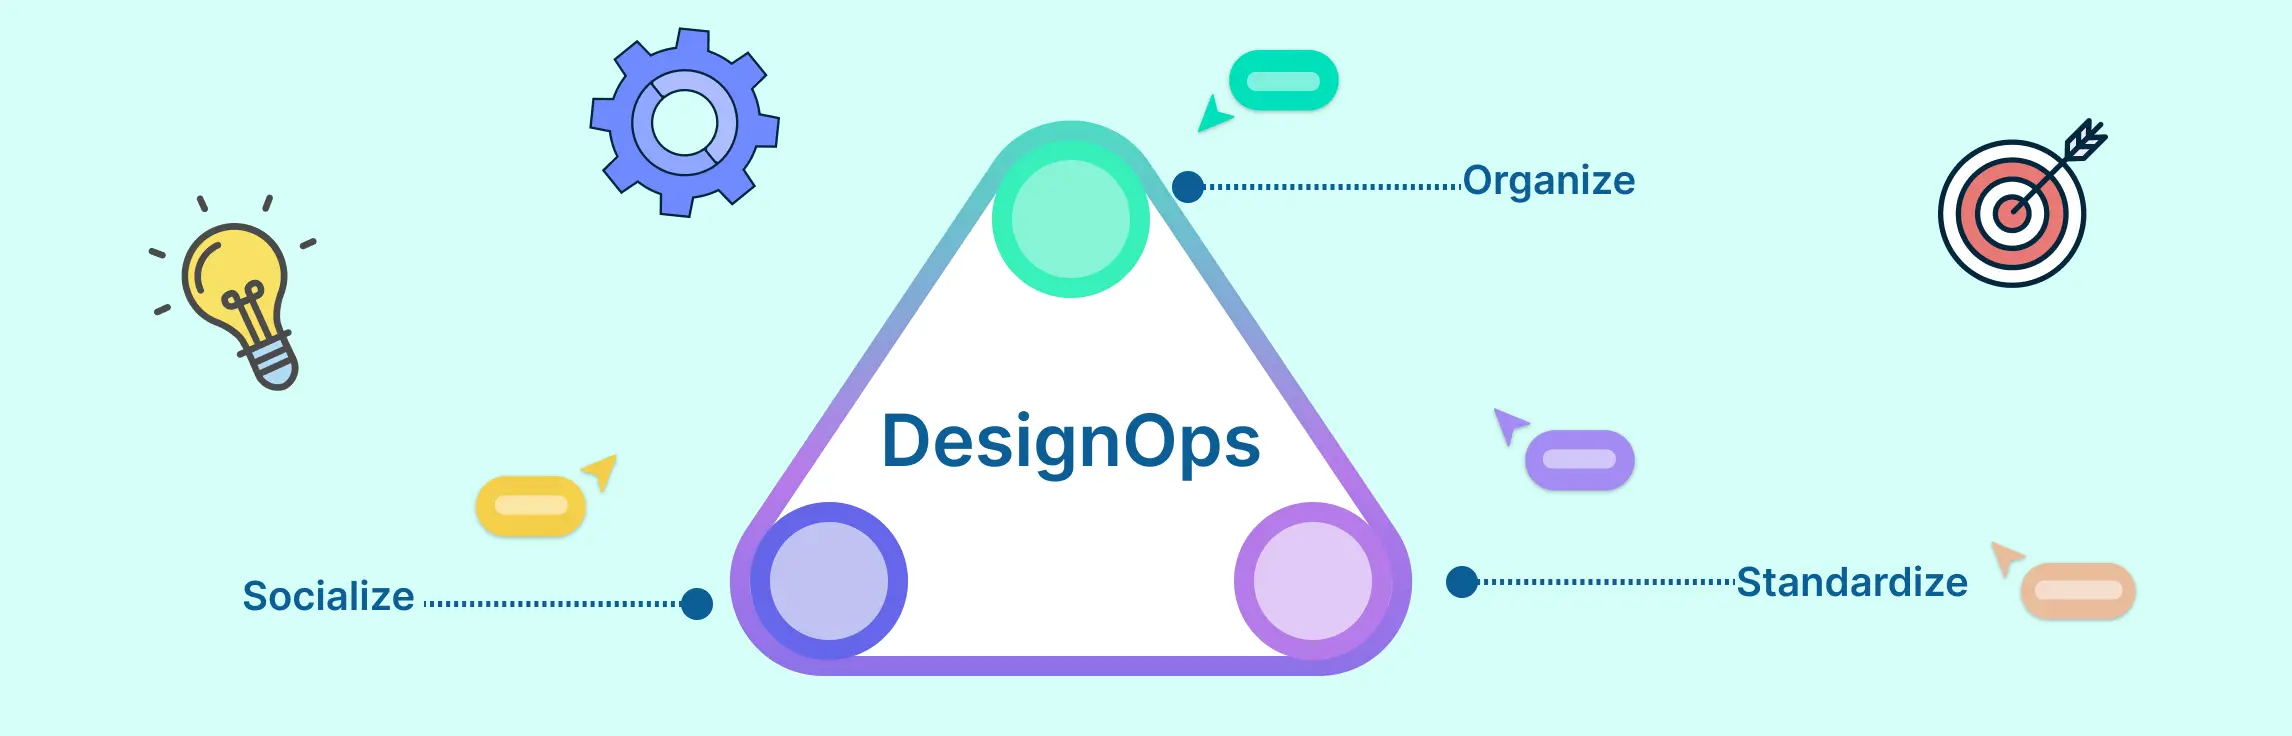
1. Standardize Workflows for Consistency Use playbooks, templates, and process maps to define how work flows from discovery to delivery. This ensures alignment and reduces confusion across teams. Read More
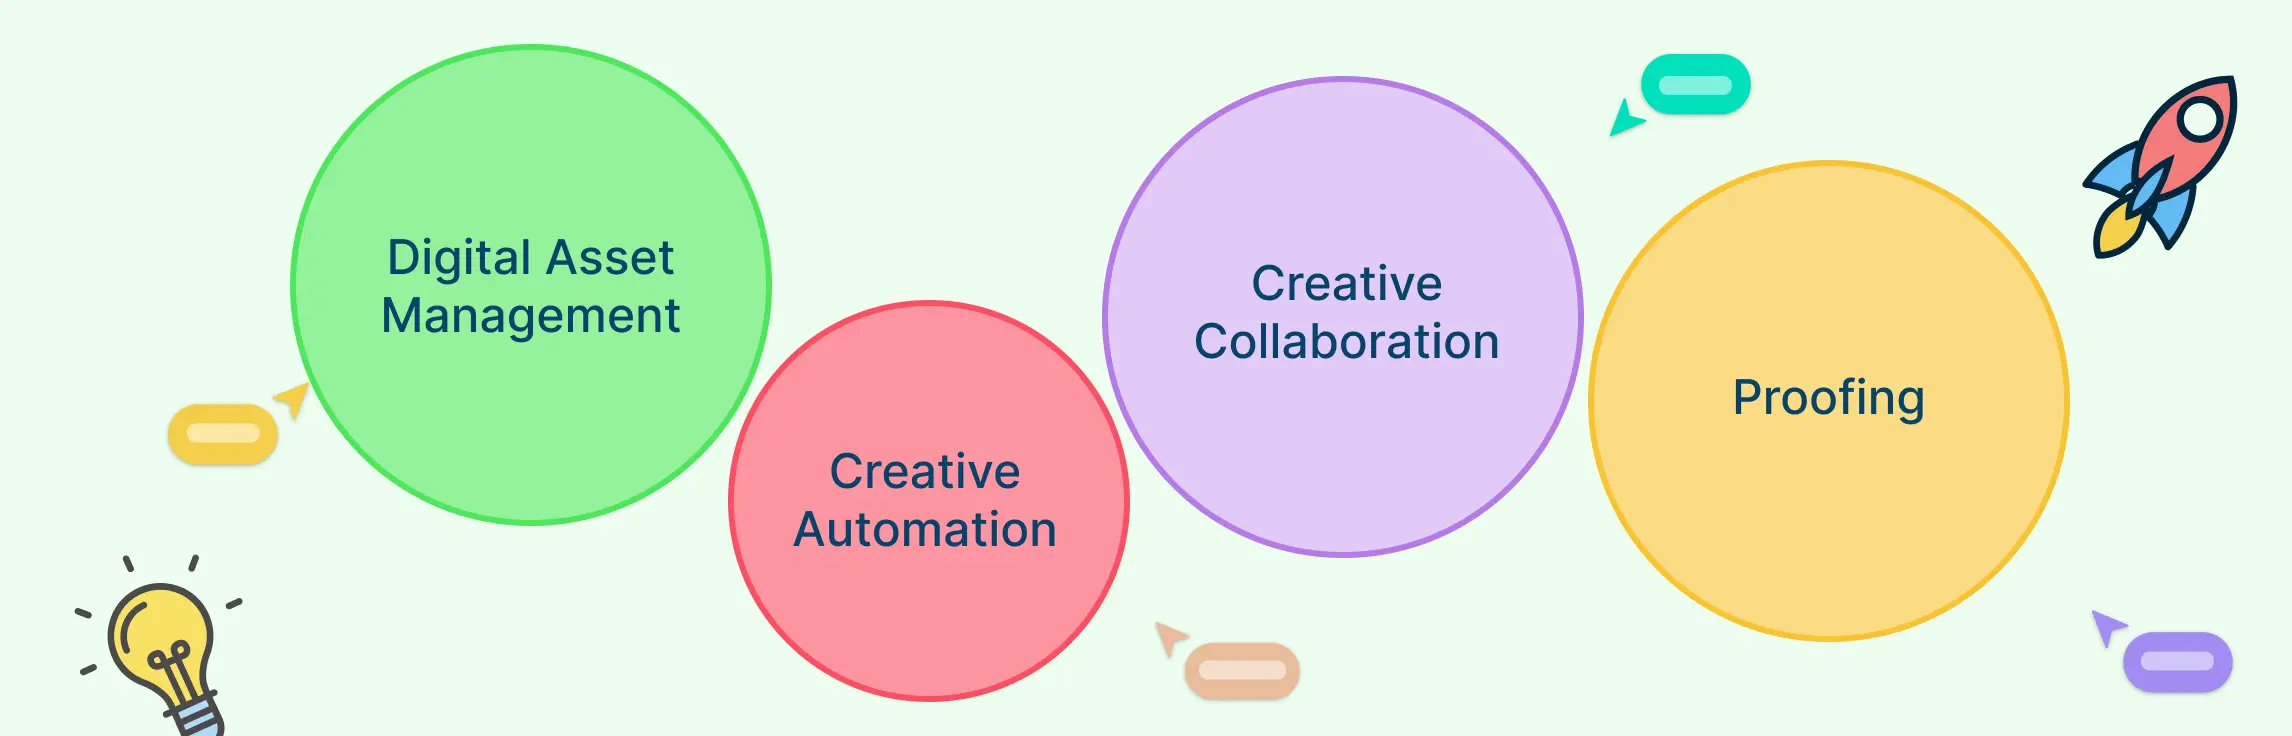
In today’s fast-moving product environment, managing design at scale requires more than talent and creativity. As teams grow and workflows become more complex, organizations are turning to design operations tools to bring structure, consistency, and speed to the design process. Read More
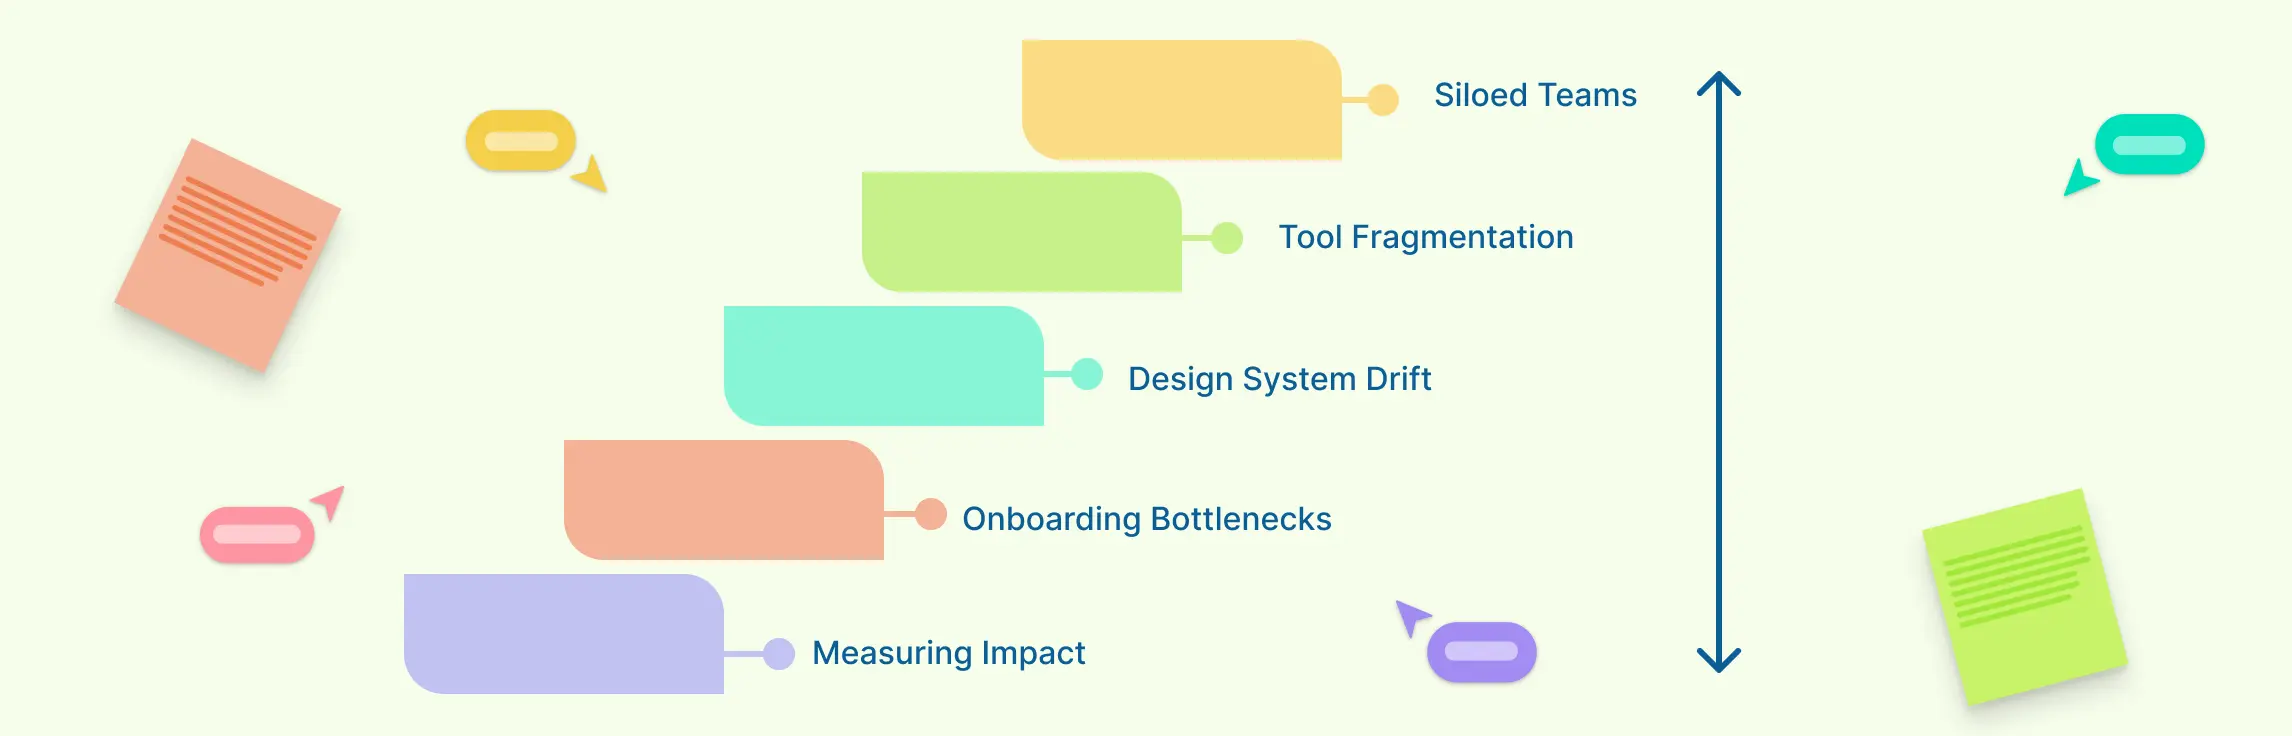
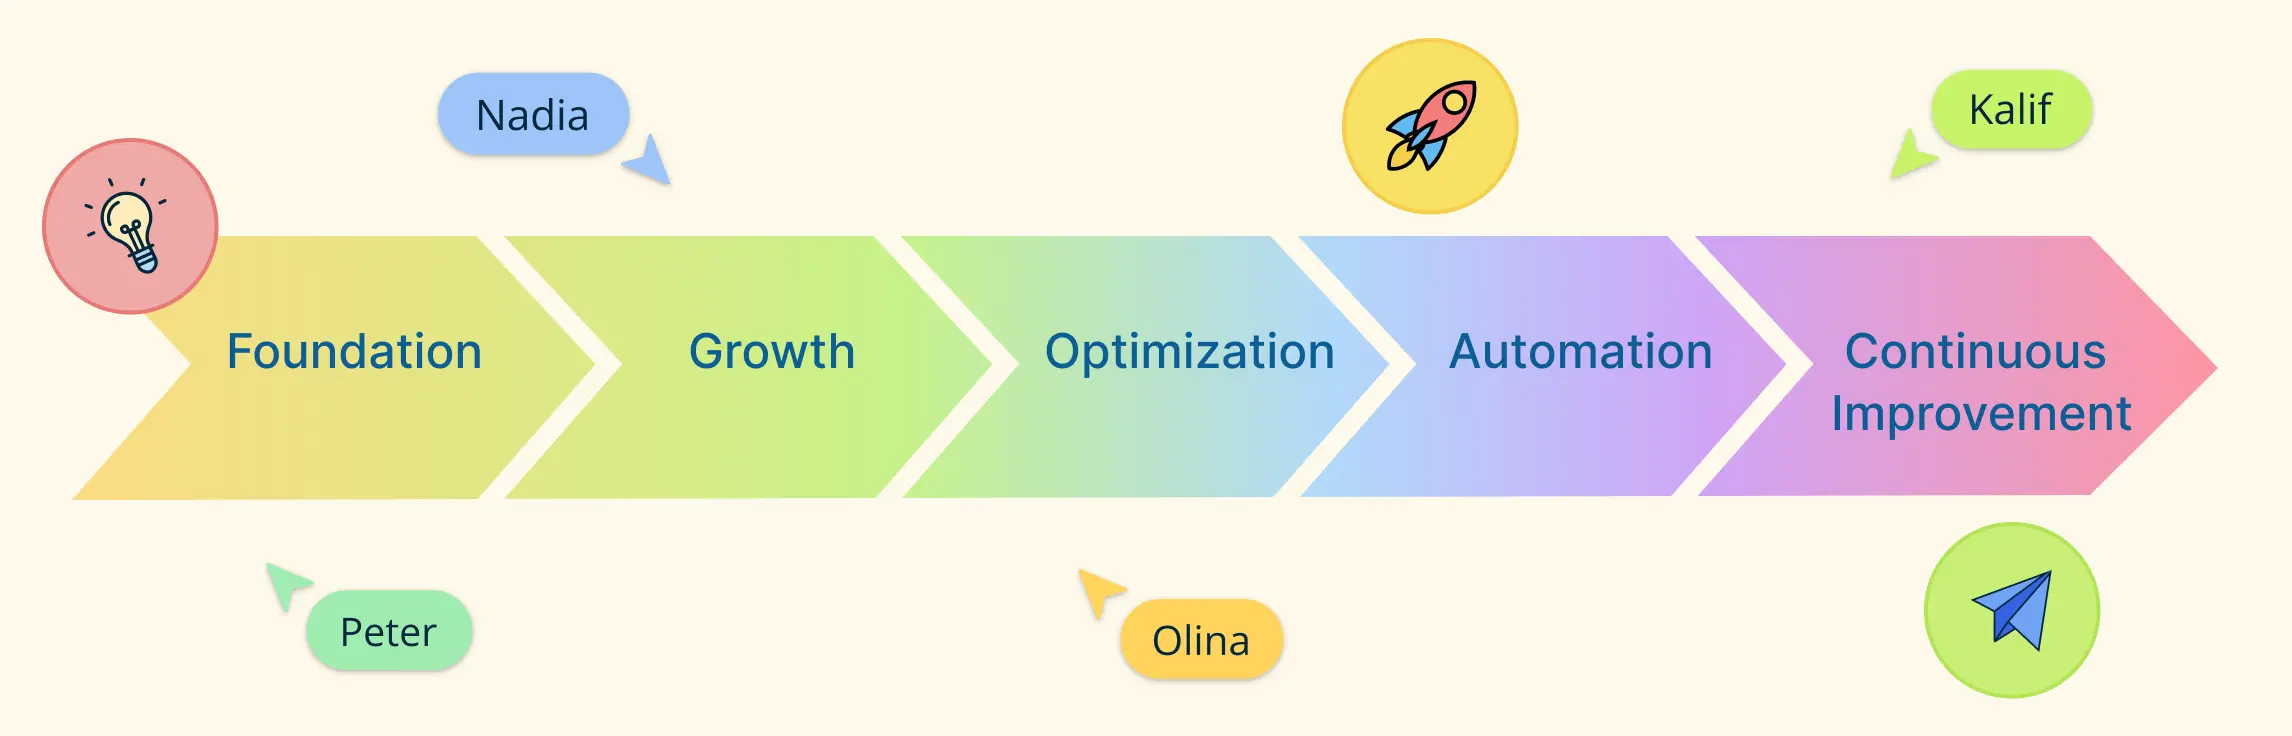
What Is Scaling Design Operations? Scaling design operations means orchestrating people, tools, workflows, and metrics to help design teams deliver consistent, high-quality outcomes across products, regions, and teams. Unlike traditional DesignOps, which focuses on optimizing for individual teams, scaling design operations supports growth by integrating governance, standardization, and measurement into the design process, ensuring brand consistency and operational efficiency across the enterprise. Read More
Strategic planning begins with asking the right questions—and choosing the right framework. Two of the most popular tools are SWOT analysis and the SOAR framework. While both help align your team and guide decision-making, they serve different purposes. Read More
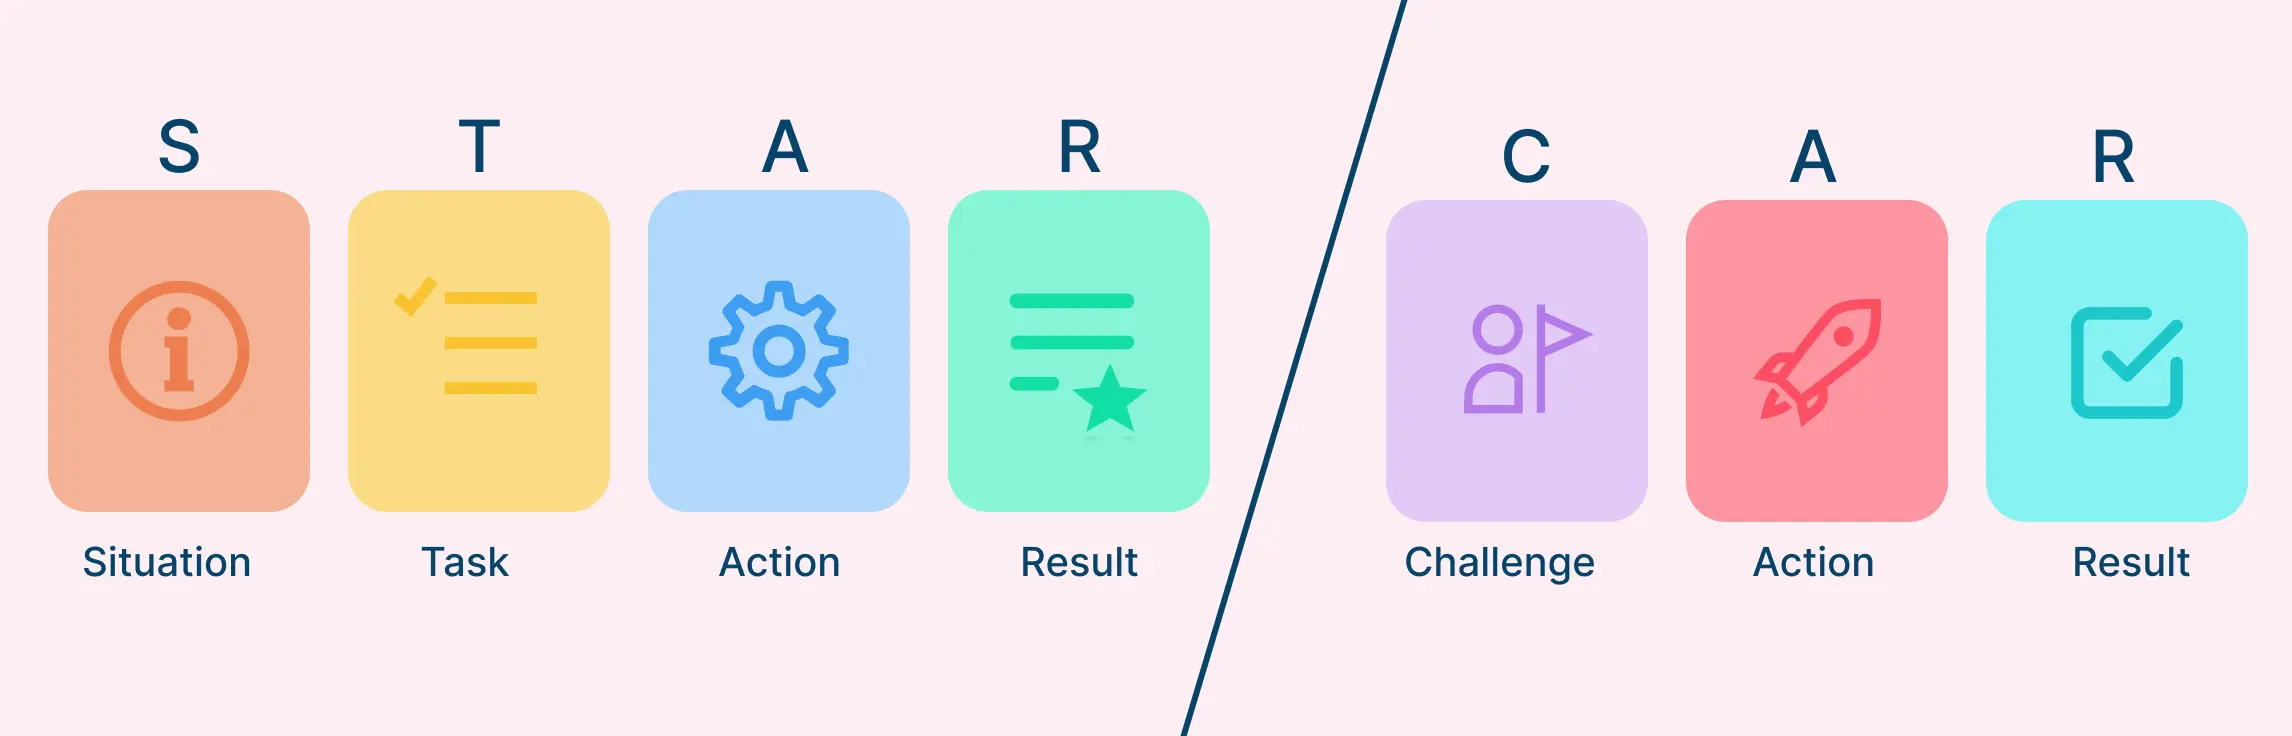
Behavioral interviews have become essential tools for employers aiming to evaluate how candidates handle real-world challenges. Unlike traditional interviews focused on qualifications, behavioral interviews assess past experiences to predict future performance. Read More
Design teams are growing, tools are multiplying, and deadlines are shrinking. Sound familiar? That’s where DesignOps steps in. Design Ops is the operational foundation that supports design teams. It standardizes tools, processes, people, and metrics to streamline collaboration between design, product, and engineering. Read More
Design is no longer just about pixels and prototypes—it’s a strategic force behind every successful product. But as teams grow and projects scale, creativity alone isn’t enough. Without the right structure, even the best design teams risk chaos, duplication, and delays. That’s where a Design Operations Framework comes in. It brings the order, efficiency, and alignment needed to turn great ideas into consistent, high-impact outcomes—fast. Read More
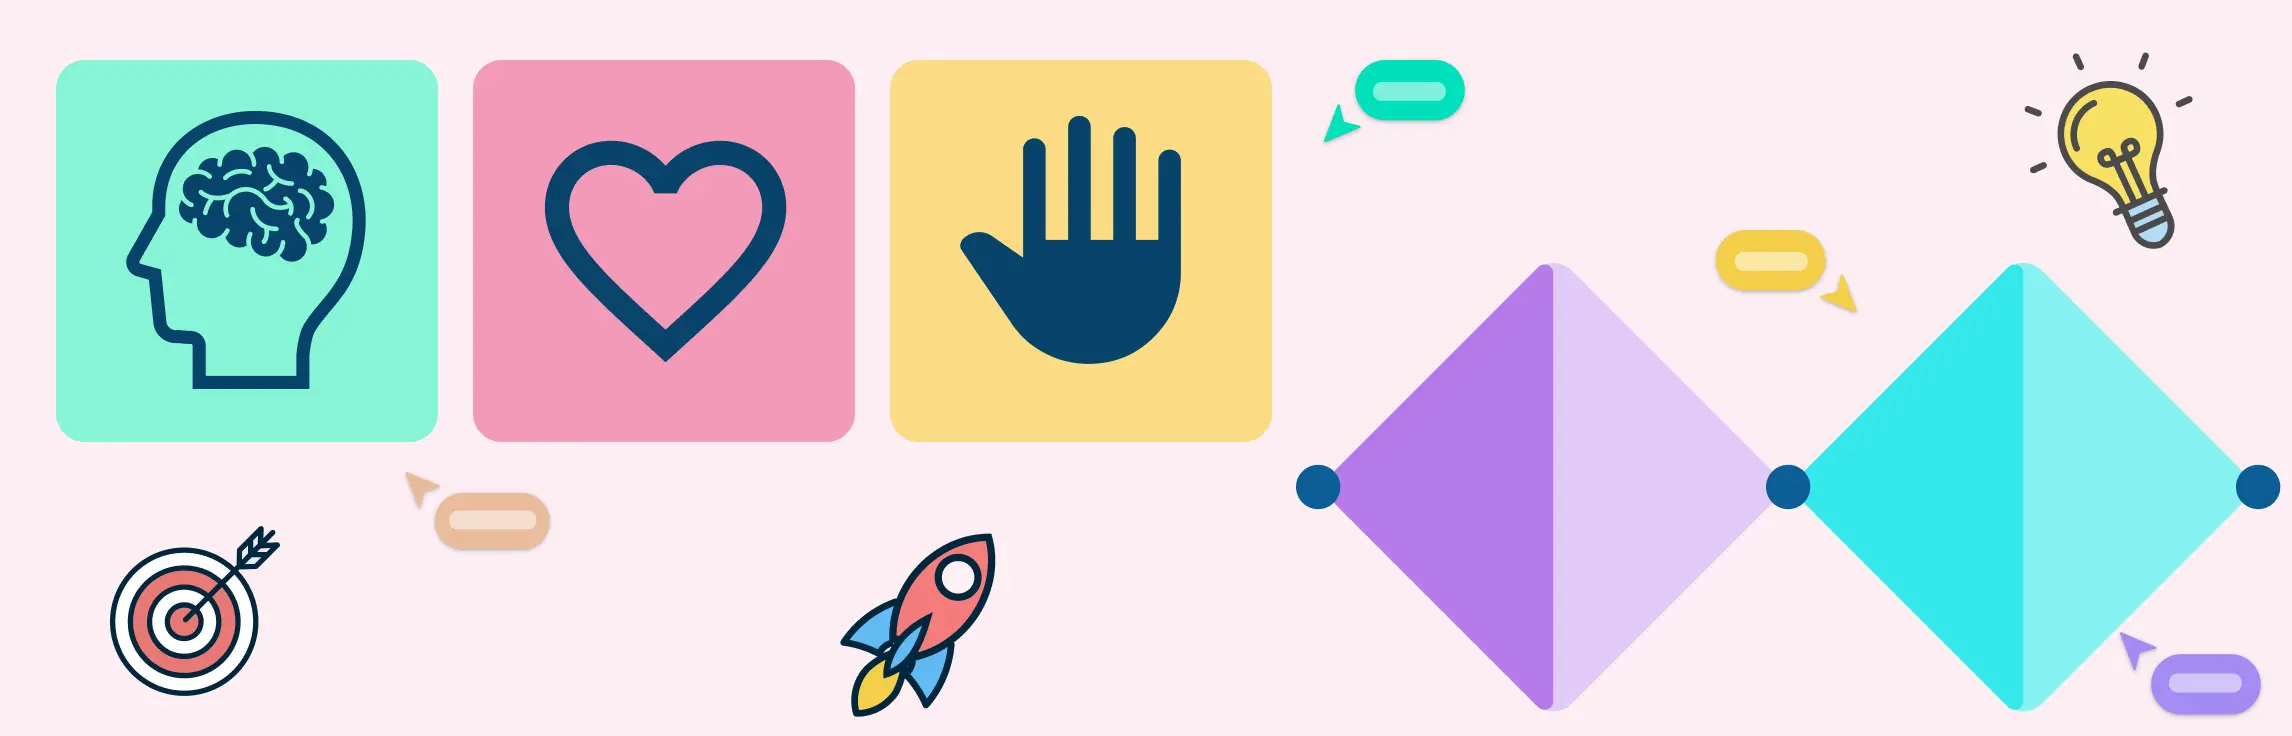
What Are the Principles of Design Thinking? Design thinking principles are human-centered mindsets that guide iterative problem-solving and innovation. Rather than following strict, linear steps, these core values—such as empathy and collaboration—promote flexibility, faster adaptation, and deeper team alignment. This approach reduces waste and drives meaningful solutions by focusing on real user needs. As demand for design thinking skills soars, professionals like product managers and UX designers use these principles to enhance impact and career growth. This guide explores the five key principles and shows how Creately’s tools help teams apply them effectively for better outcomes. Read More
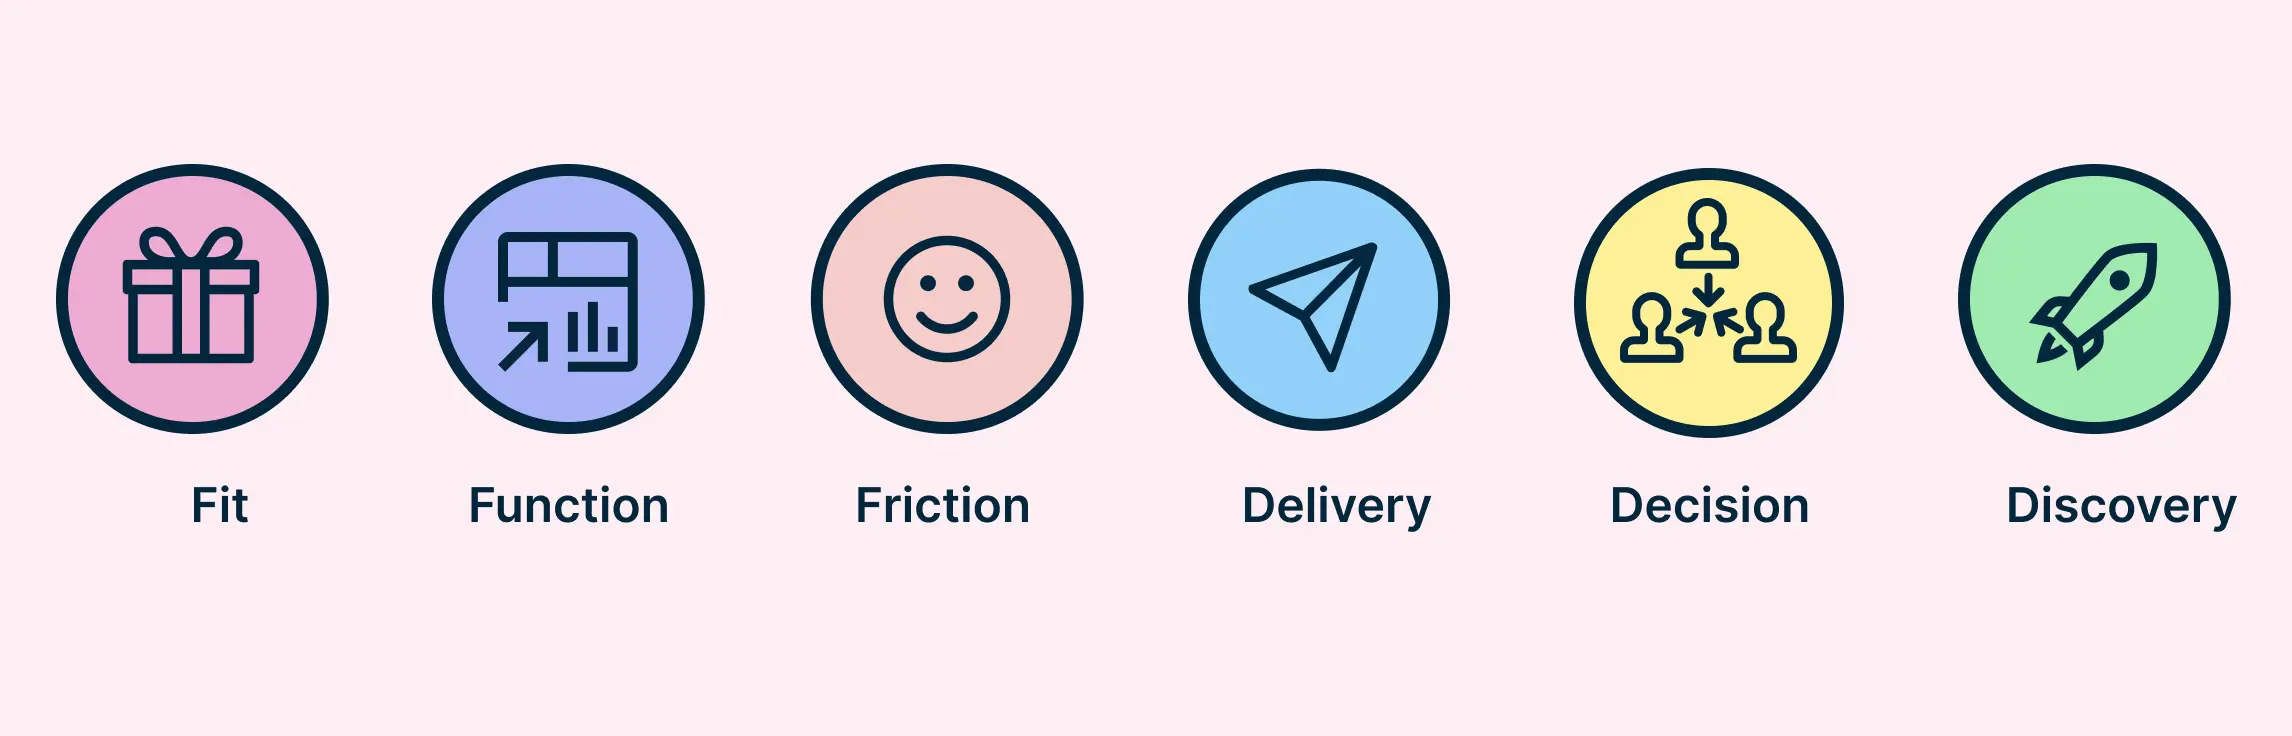
Is your design team seen as a strategic powerhouse—or just a cost center? Design teams today face mounting pressure to justify their impact. As creative work scales across products and channels, measuring design ops has become crucial for proving value, securing budgets, and optimizing processes. This guide breaks down how to measure ROI in design operations, track meaningful KPIs, and use frameworks and templates to maximize business outcomes. Read More
Organizations seeking a competitive advantage are increasingly adopting the Design Thinking Model—a structured, user-centered framework that fuels innovation. This iterative methodology breaks innovation into six phases: Empathize, Define, Ideate, Prototype, Test, and Implement. Read More
What Is Affinity Mapping? Affinity mapping—also known as affinity diagramming—is a powerful technique for synthesizing large volumes of qualitative data into actionable insights. Used in UX research, design thinking, agile retrospectives, and customer feedback analysis, this method transforms sticky notes and scattered ideas into structured themes that fuel innovation. Read More
Affinity mapping in UX brings structure to qualitative research, transforming raw observations into cohesive themes. It fuels actionable insights by clustering related observations, ideas, or pain points. This guide walks through core concepts, workflows, and tools, from basic affinity diagram UX to best practices. Read More
Traditional problem-solving often hits roadblocks in ambiguity and shifting user needs. That’s where design thinking methodology stands out—offering a flexible, human-centered approach to uncovering insights, prototyping quickly, and delivering solutions that truly resonate. Read More
In project management, especially within the PMP® methodology, organizing stakeholder input, requirements, and risks is critical for effective planning. An affinity diagram in PMP helps project managers visually cluster large volumes of qualitative data, revealing natural relationships and guiding strategic decisions. Read More
Stuck solving the same problems the same way? Design thinking flips the script. It’s a human-centered approach to innovation that helps teams uncover real user needs, spark fresh ideas, and test solutions fast. In this guide, we explore what design thinking is, why it matters, and how it’s used across industries. Read More
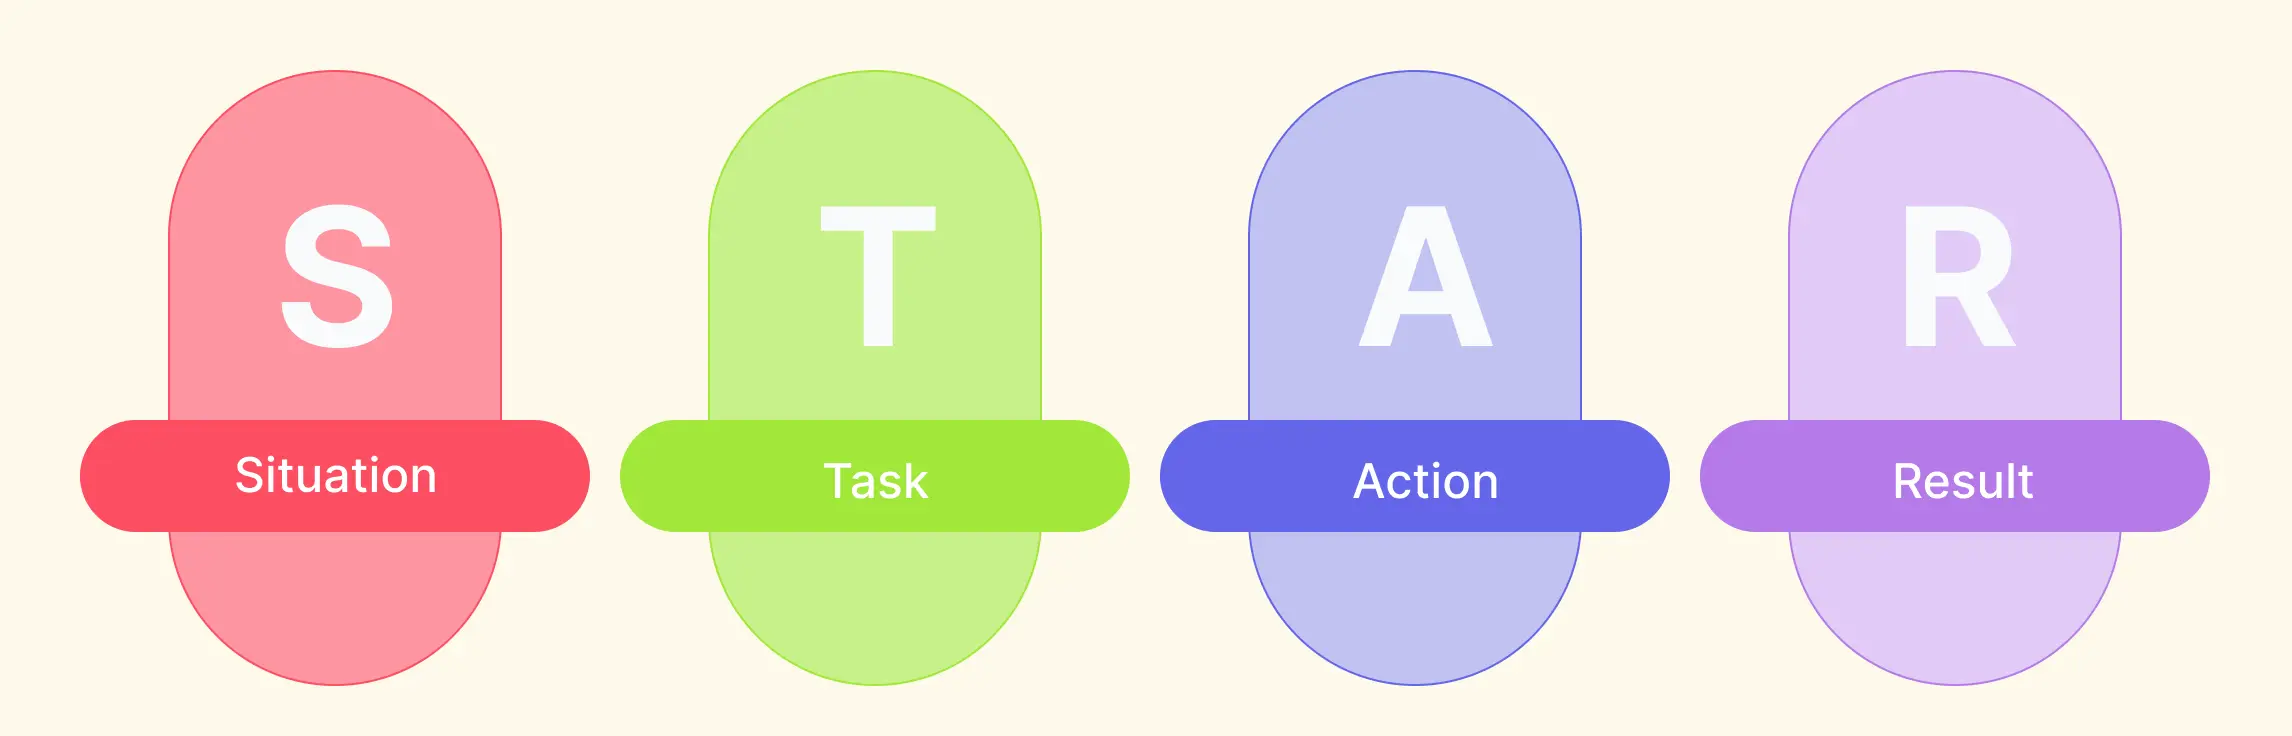
Ever been caught off guard by a question like, “Tell me about a time you faced a challenge at work”? You’re not alone. Behavioral interview questions can feel intimidating, but with the right approach, they become powerful opportunities to showcase your skills. In this guide, you’ll discover 30 essential STAR interview questions, a breakdown of how to structure winning answers, expert sample responses, and templates to help you prepare. Read More
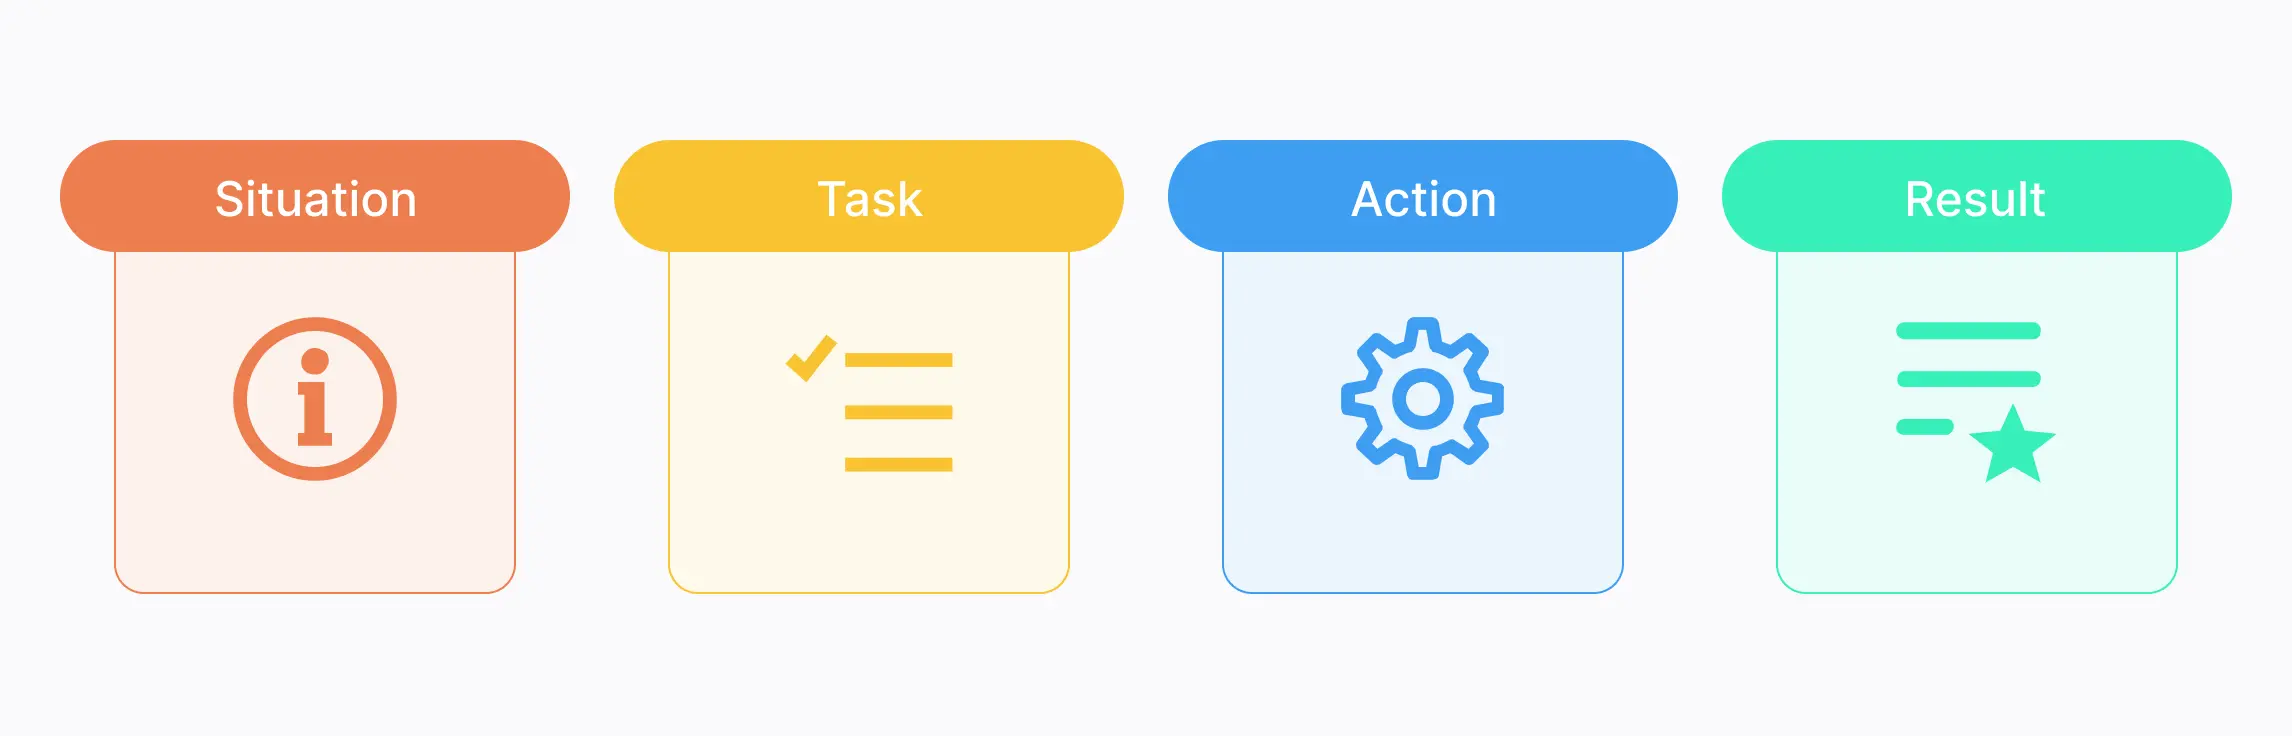
Ever found yourself blanking in an interview when asked to “tell me about a time you faced a challenge”? You’re not alone. Behavioral interview questions can be tricky — unless you have a solid framework to guide your answers. That’s where the STAR interview method comes in. Read More
When teams are flooded with ideas, data, or feedback, it’s easy to lose clarity. That’s where Affinity Diagram Examples come in handy. These visual tools help you organize information into logical groups, making it easier to identify patterns, prioritize tasks, and drive decisions. Read More
Ever wondered how the world’s most innovative teams consistently solve problems that truly matter? It all starts with the design thinking process—a user-centered, repeatable approach that sparks creativity, uncovers real needs, and leads to solutions that make a difference. Read More
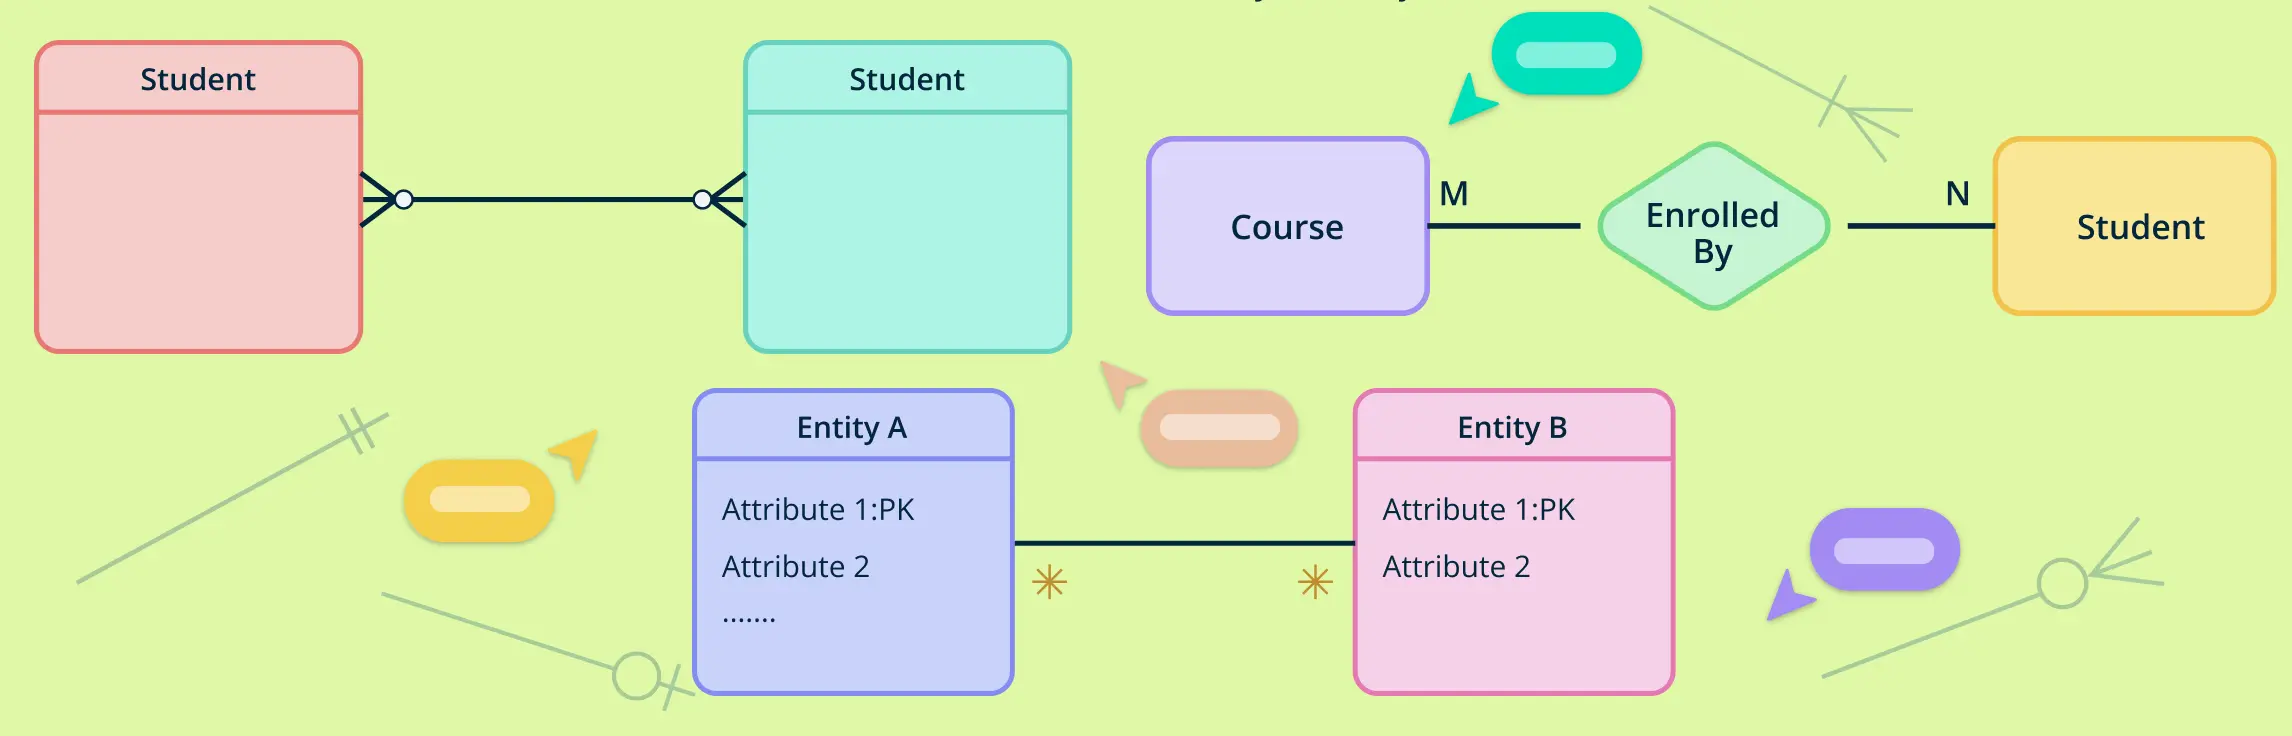
Understanding how entities relate to each other is at the heart of data modeling. That’s where cardinality symbols come in. These visual indicators define how many instances of one entity can or must be associated with instances of another, forming the backbone of accurate, meaningful ER diagrams. Read More
When designing a relational database, understanding how entities connect is just as important as defining the entities themselves. That’s where the foreign key in ER diagrams comes in. It serves as the critical link that binds different tables together, helping you create a structured, meaningful database model. Read More
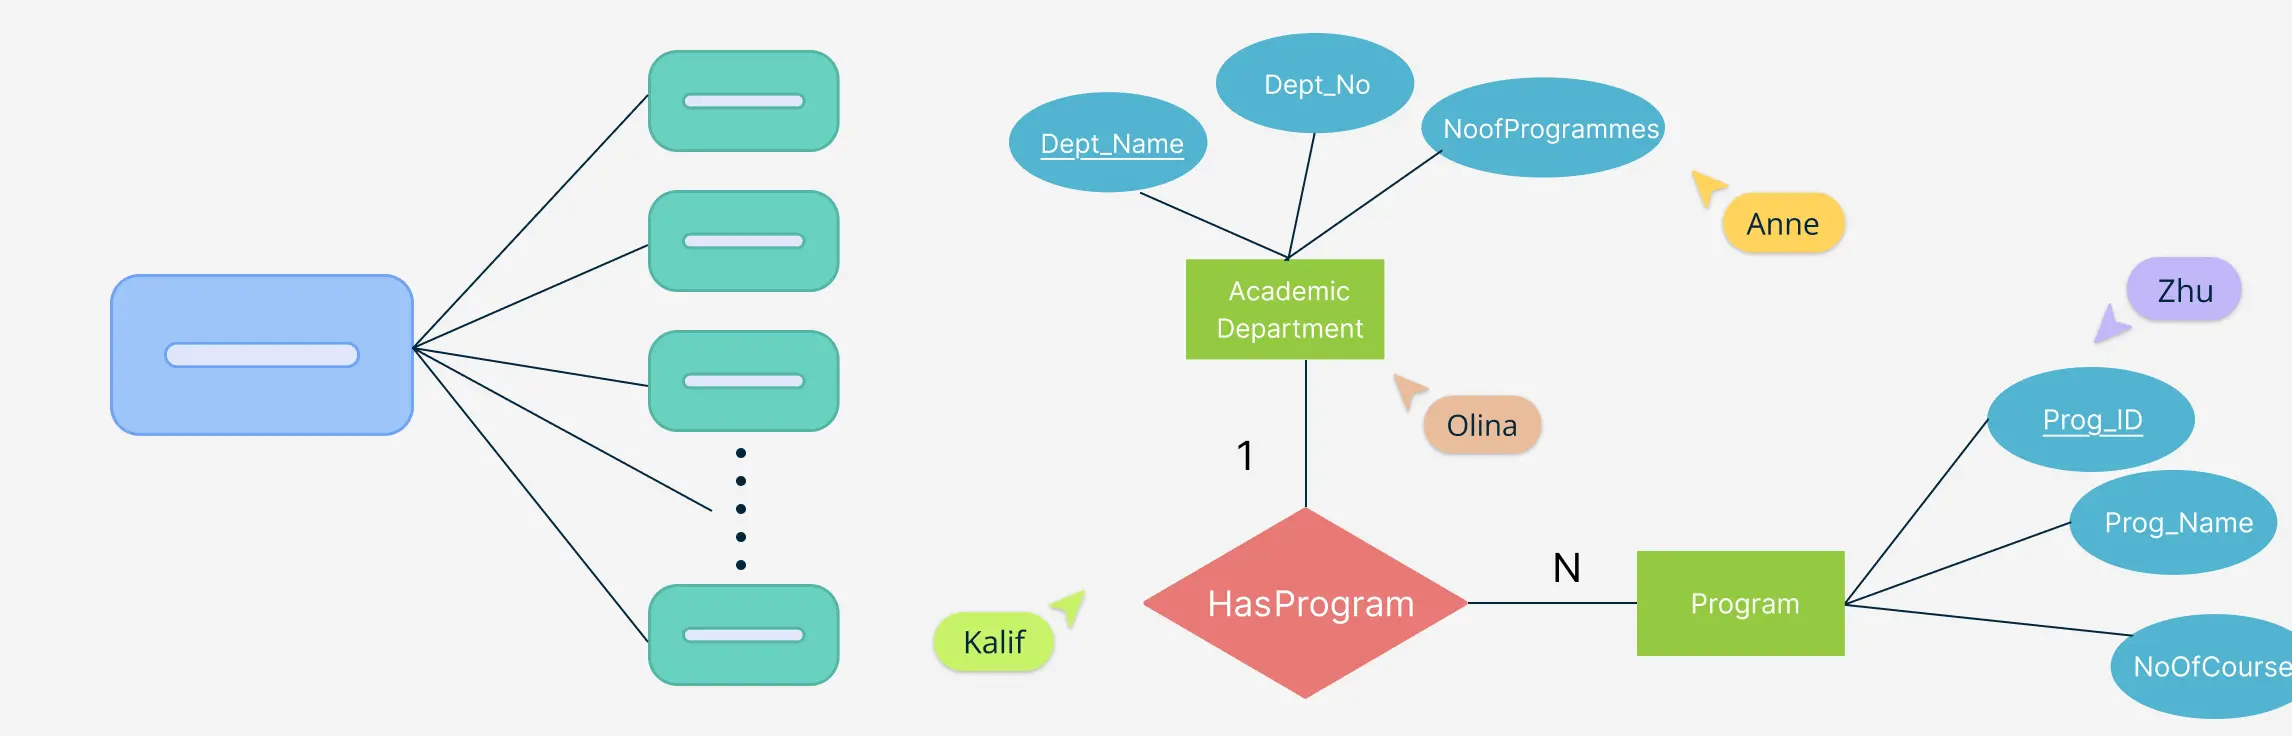
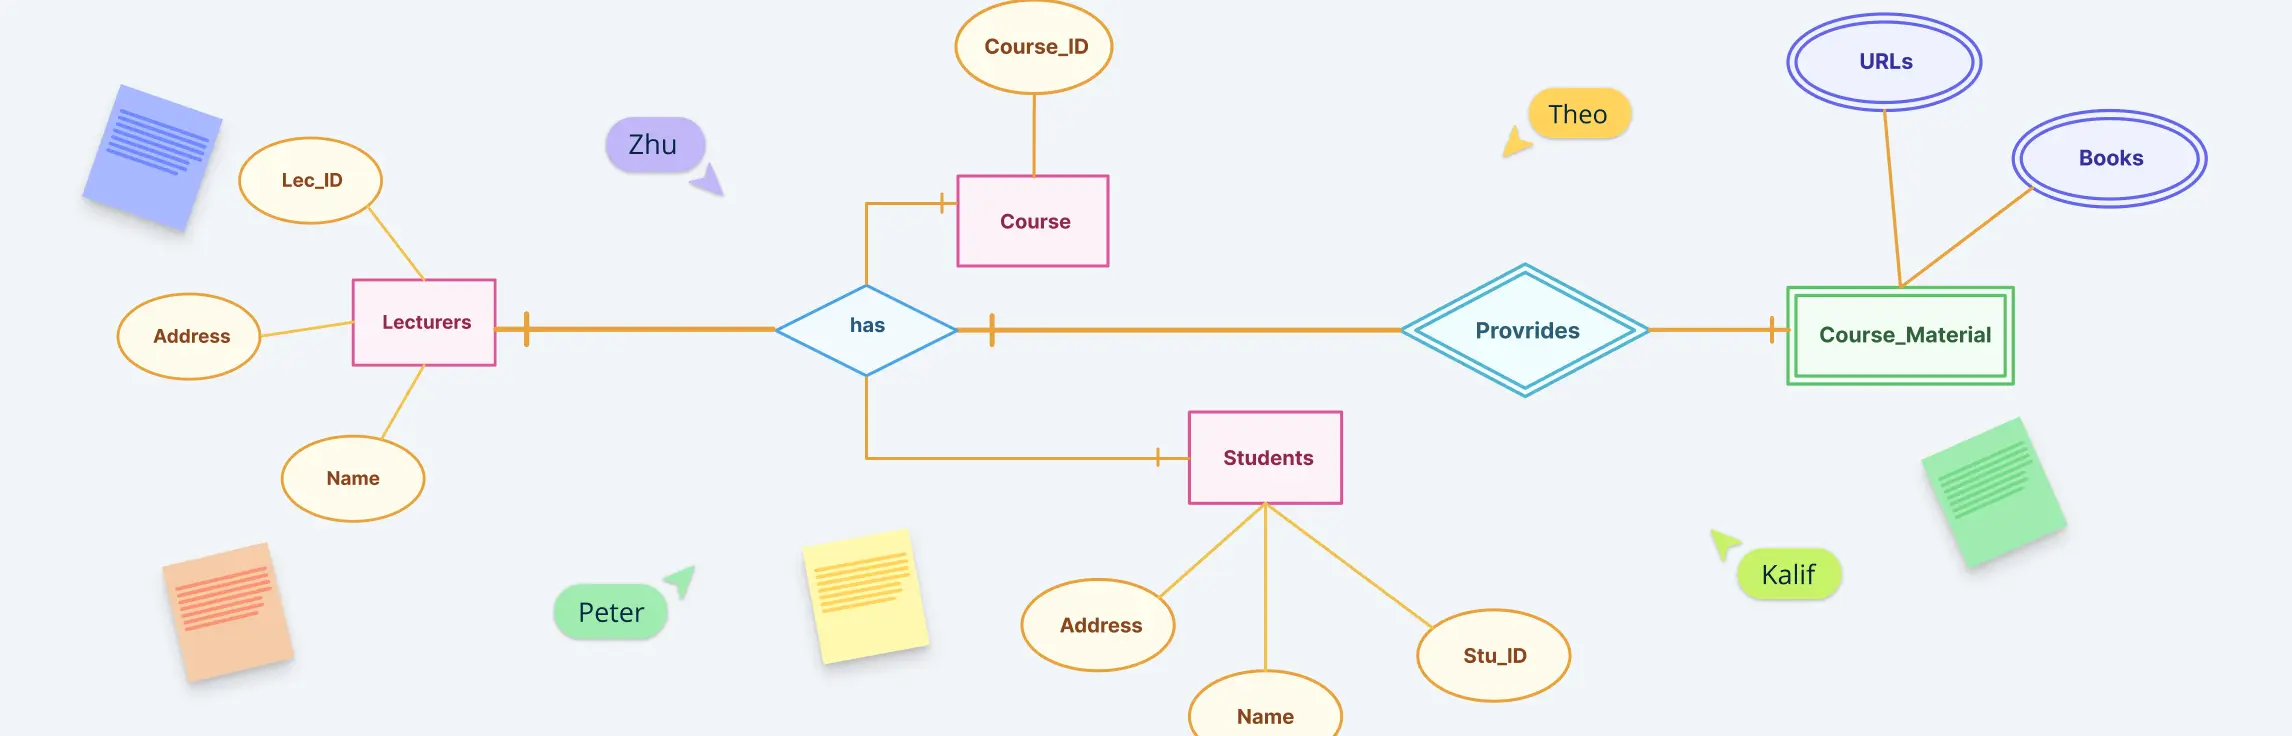
When designing a database, the relationships between entities are just as important as the entities themselves. Among these, one-to-many relationships are the most commonly used and foundational in building scalable, logical, and normalized data models. This guide explains what one-to-many relationships in ER diagrams are, how to represent them using different notations, how to identify them correctly during data modeling, and why they matter in real-world database design. This will help you understand how ERD relationships shape a database system’s overall structure and efficiency. Read More
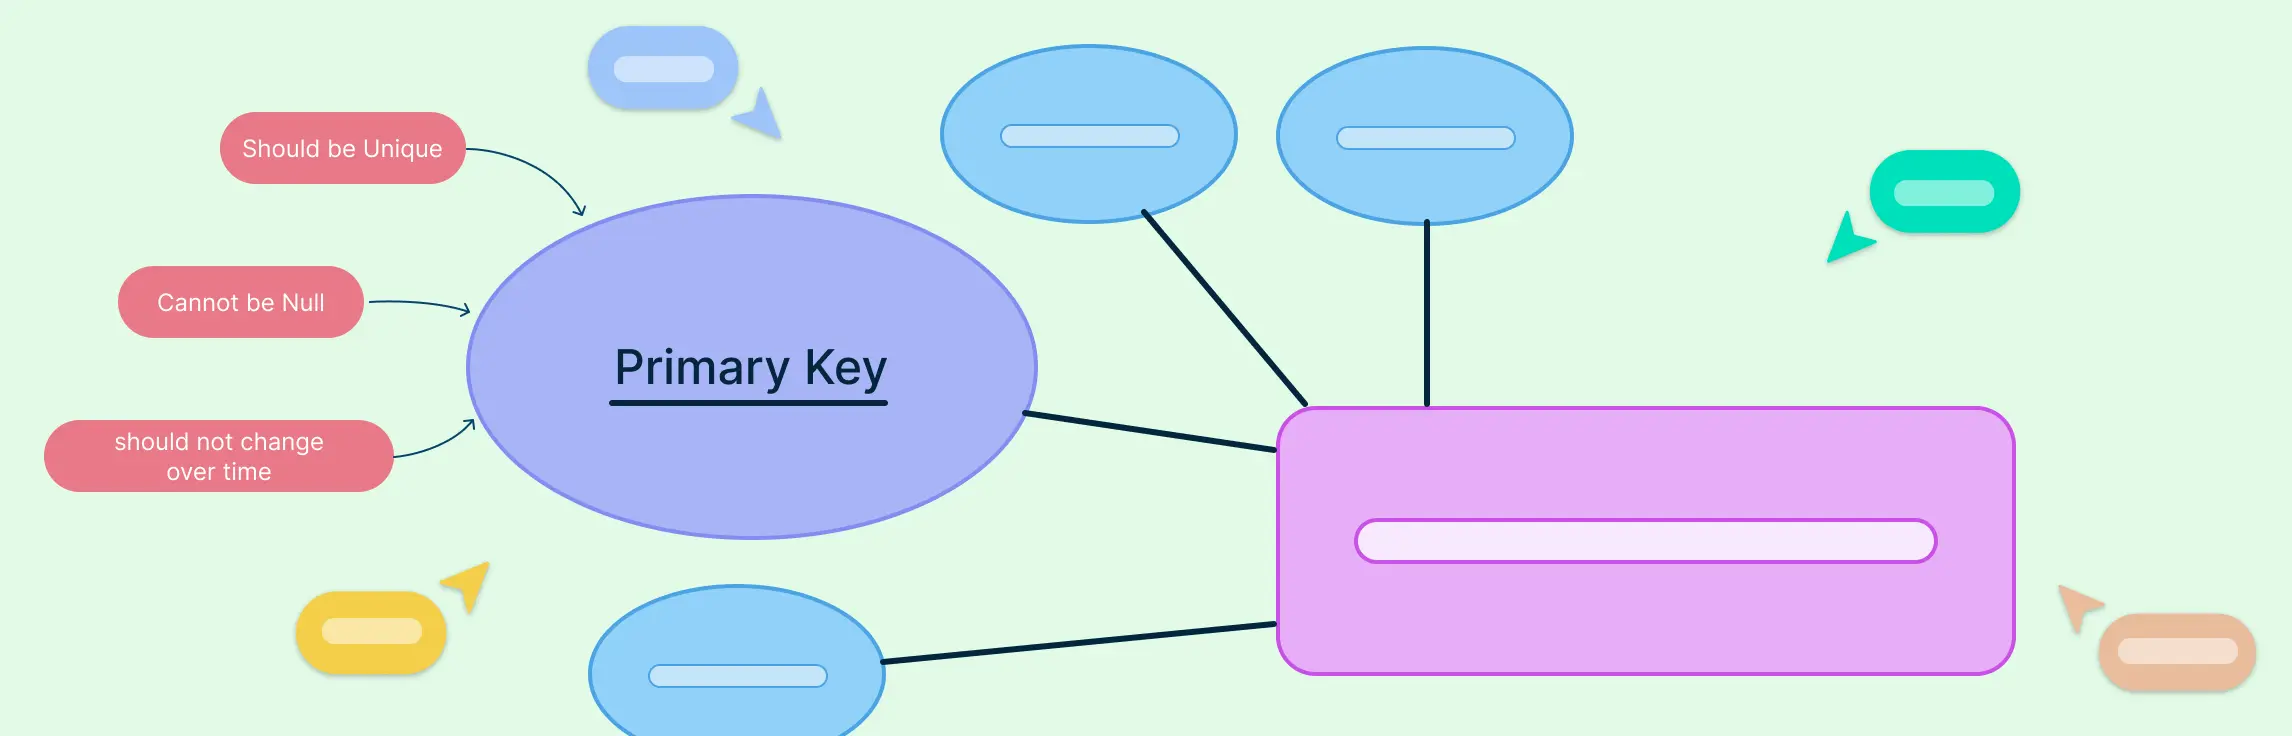
In any well-structured database, the primary key in ERD (Entity Relationship Diagram) plays a vital role in ensuring data accuracy and integrity. Whether you’re a database designer, developer, or student, understanding how primary keys work and how to represent them in ER diagrams is crucial for building efficient relational models. Read More
Process Flow Diagram (PFD) software is essential for businesses looking to visualize workflows, map out operations, and improve efficiency. These tools help teams create structured diagrams that simplify complex processes, making it easier to identify bottlenecks, optimize performance, and enhance collaboration. Read More
Many-to-many relationships are a fundamental concept in Entity-Relationship (ER) modeling. They represent scenarios where multiple instances of one entity can be associated with multiple instances of another. In this guide, you’ll learn how to illustrate many-to-many relationships in ER diagrams using best practices. Read More
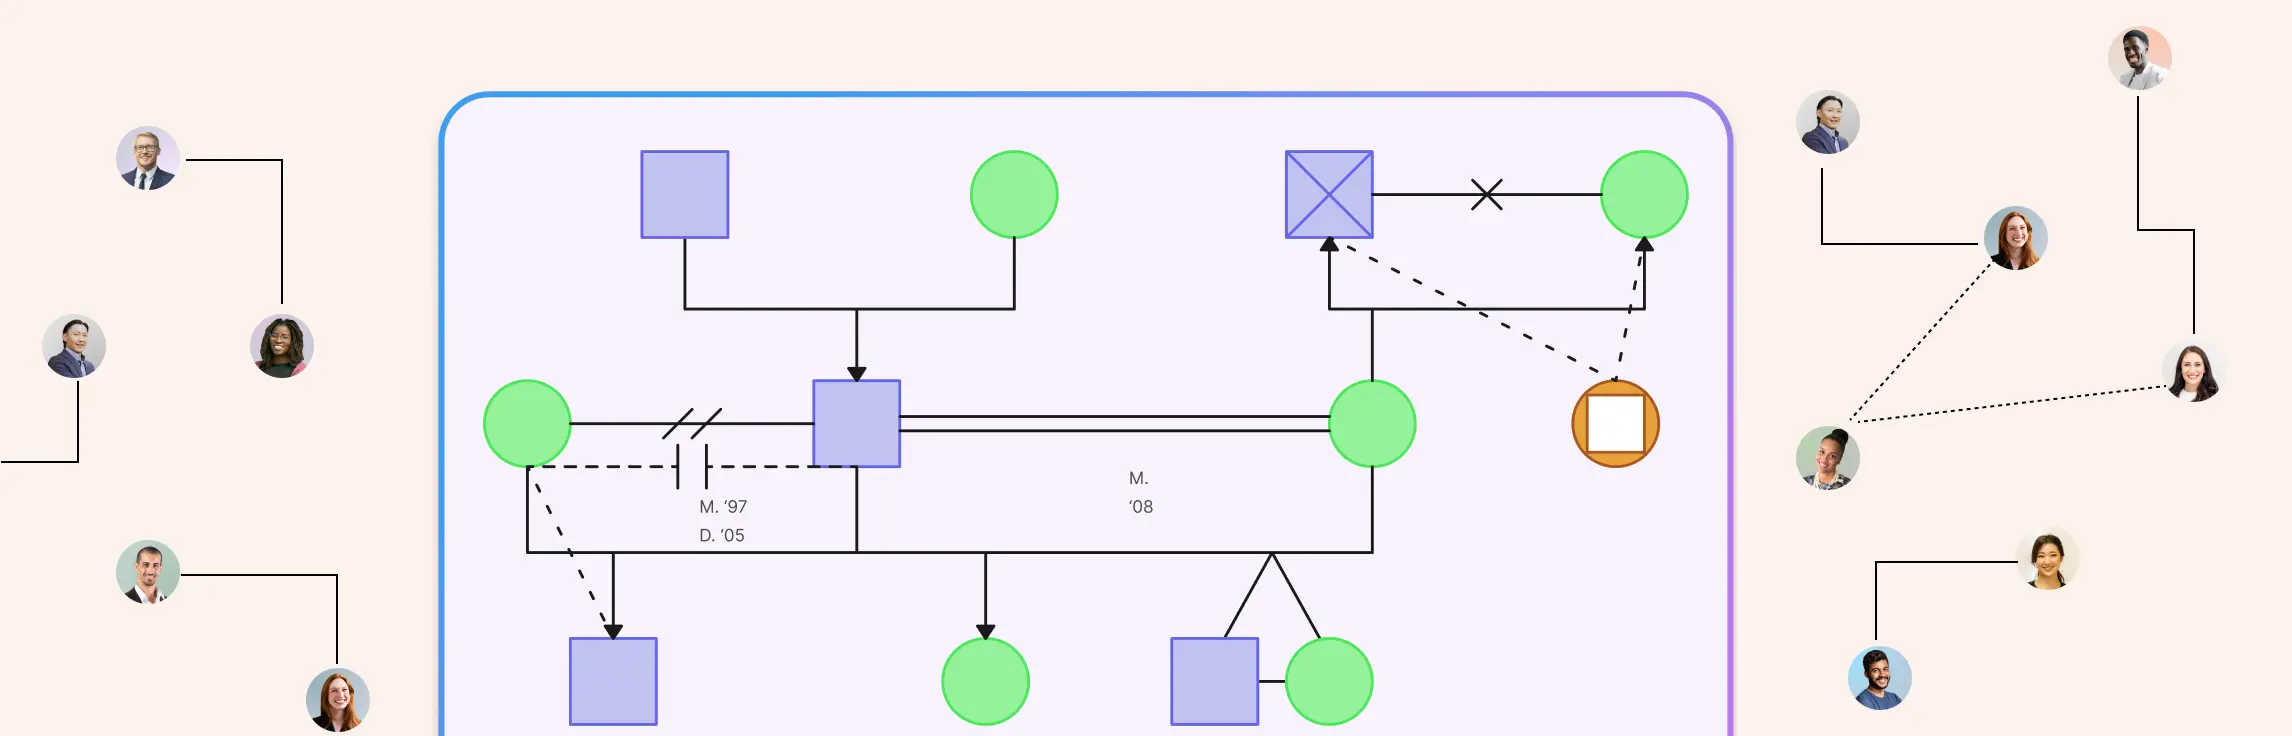
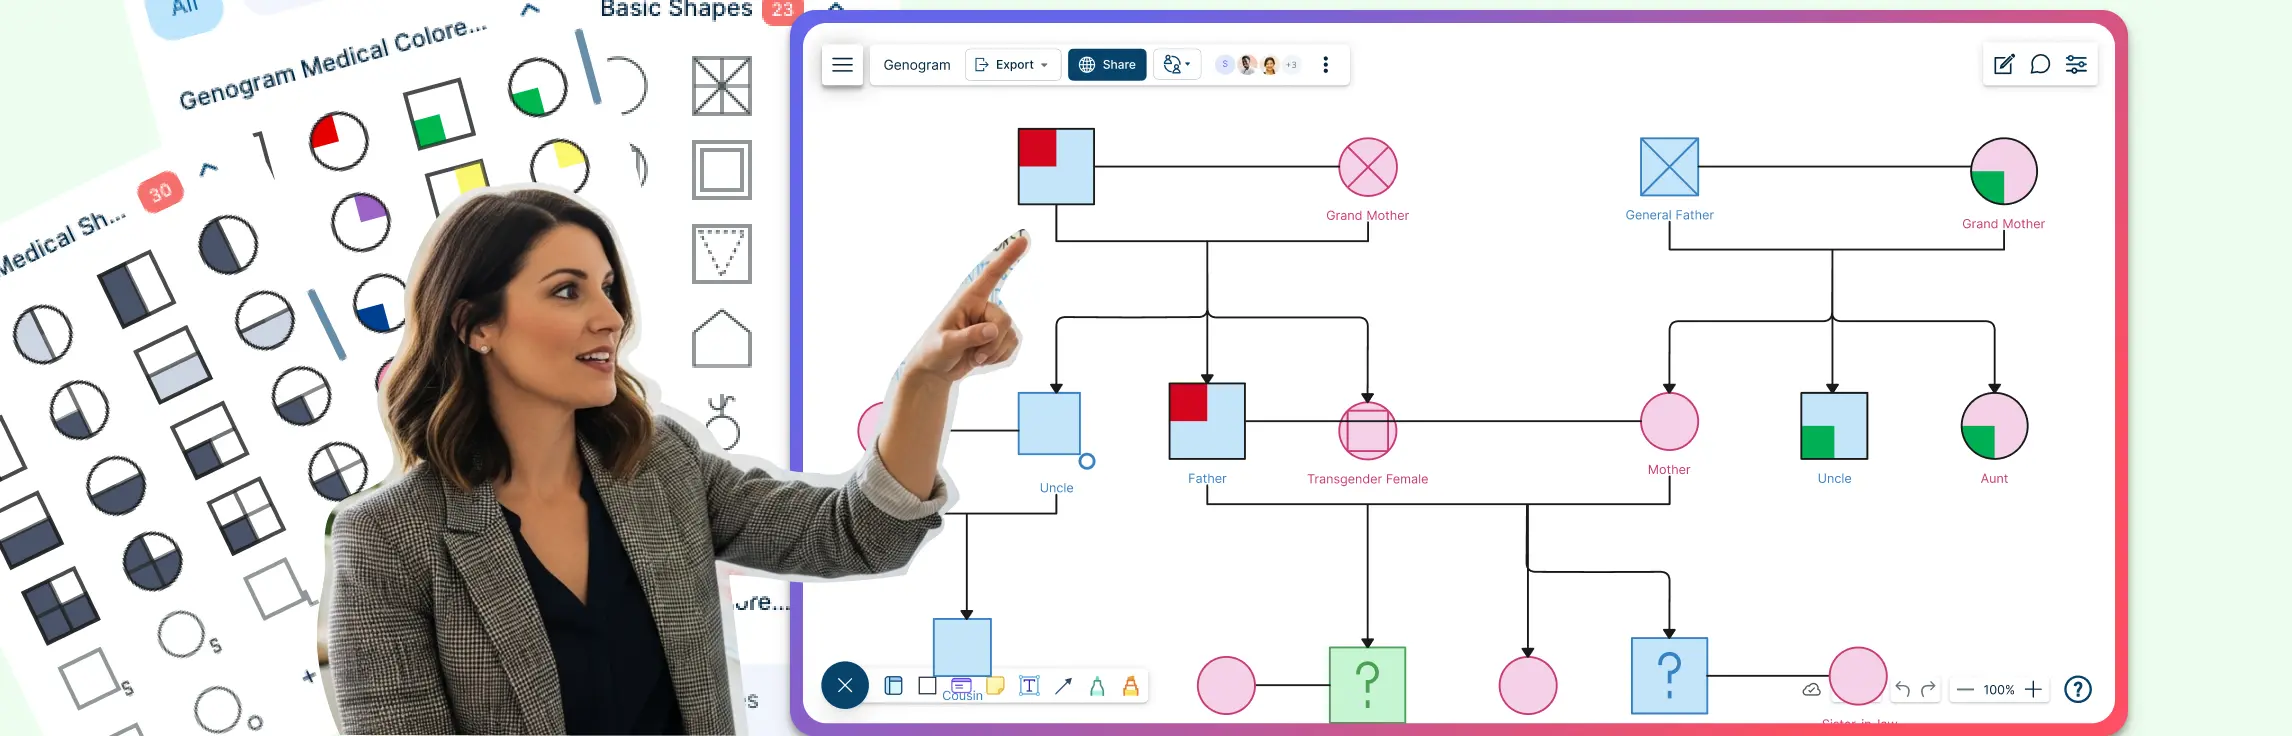
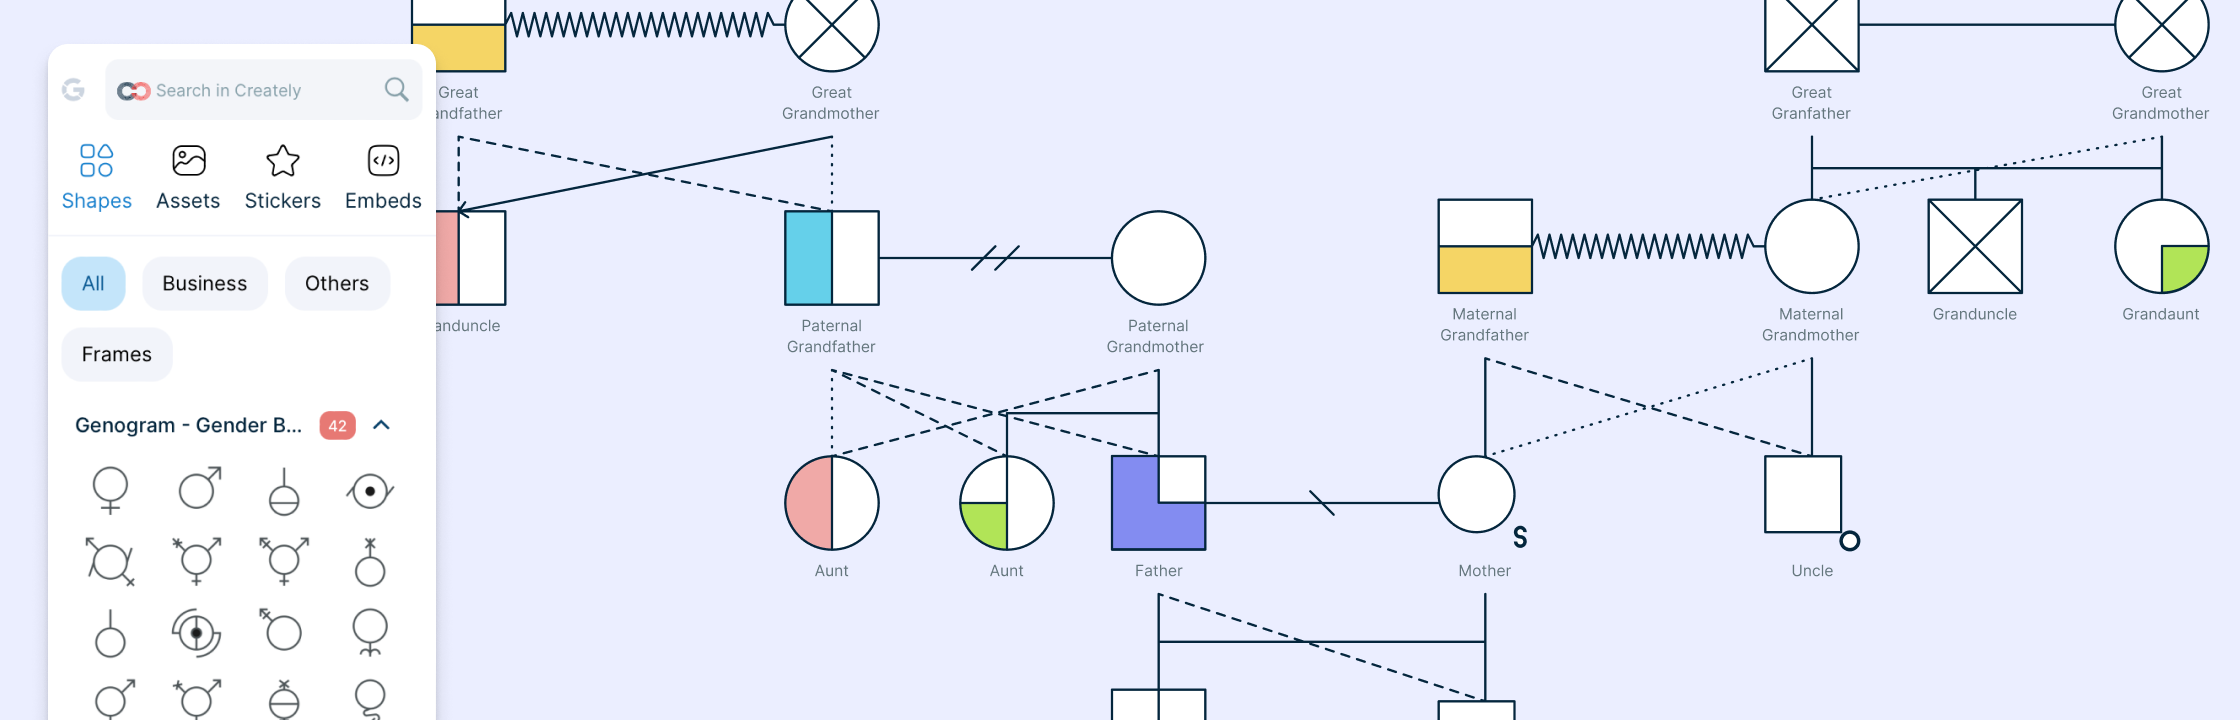
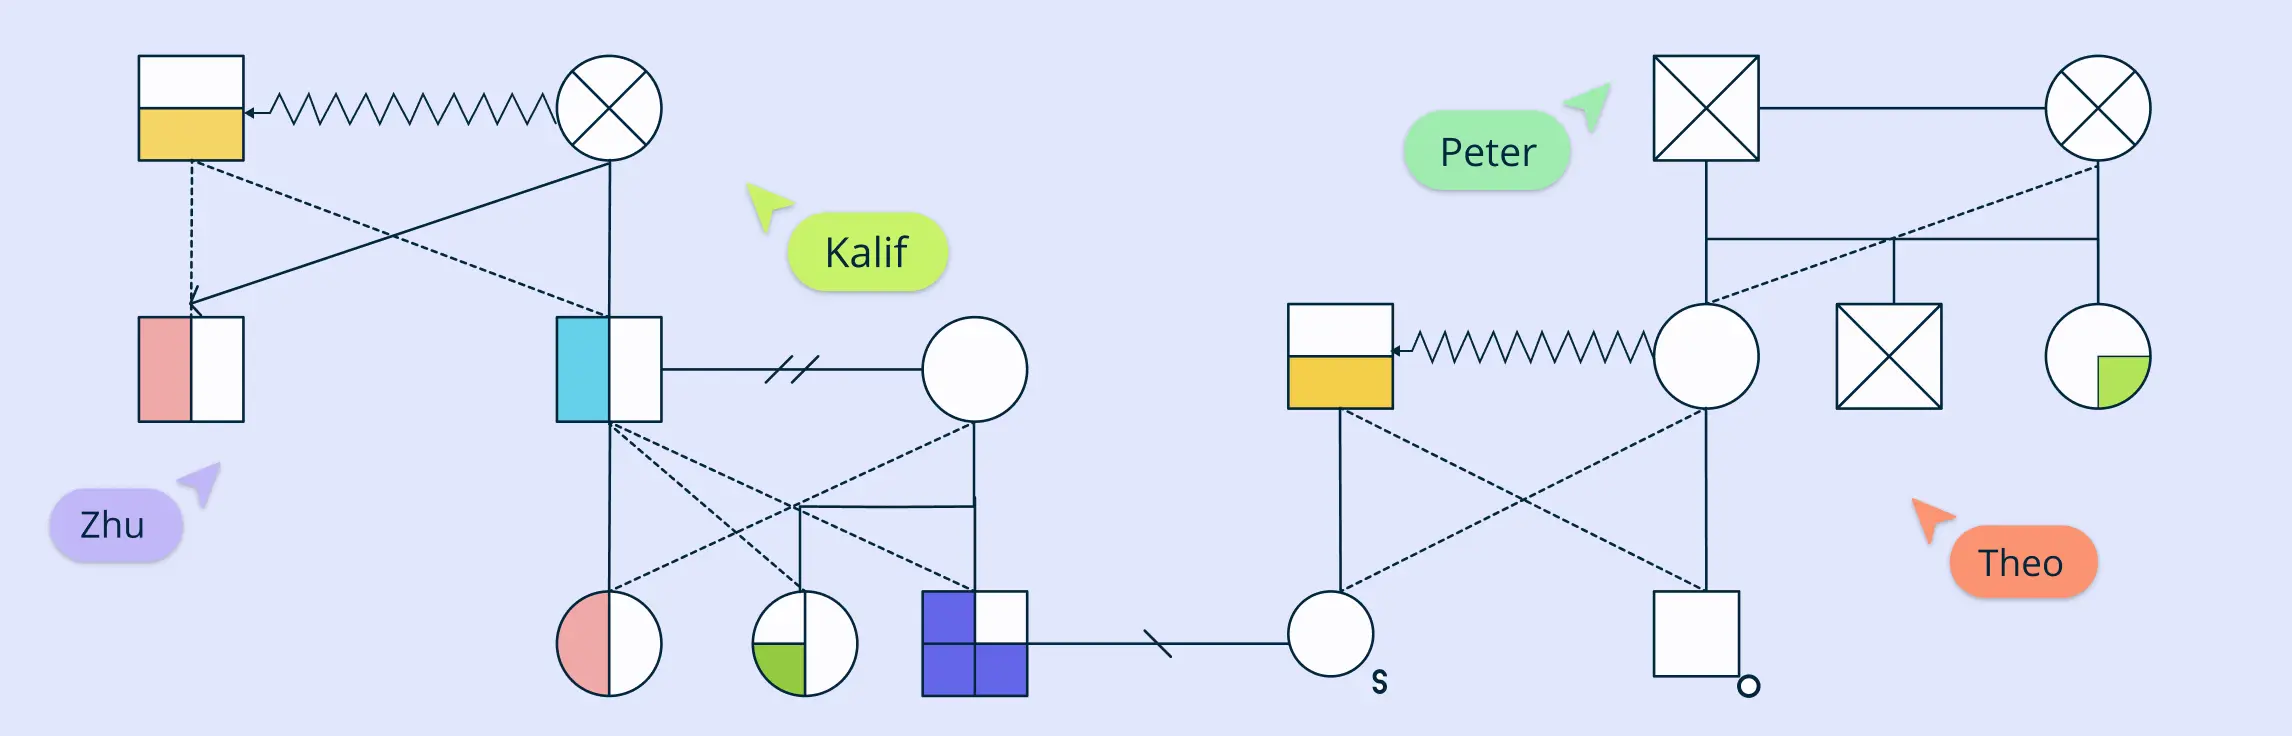
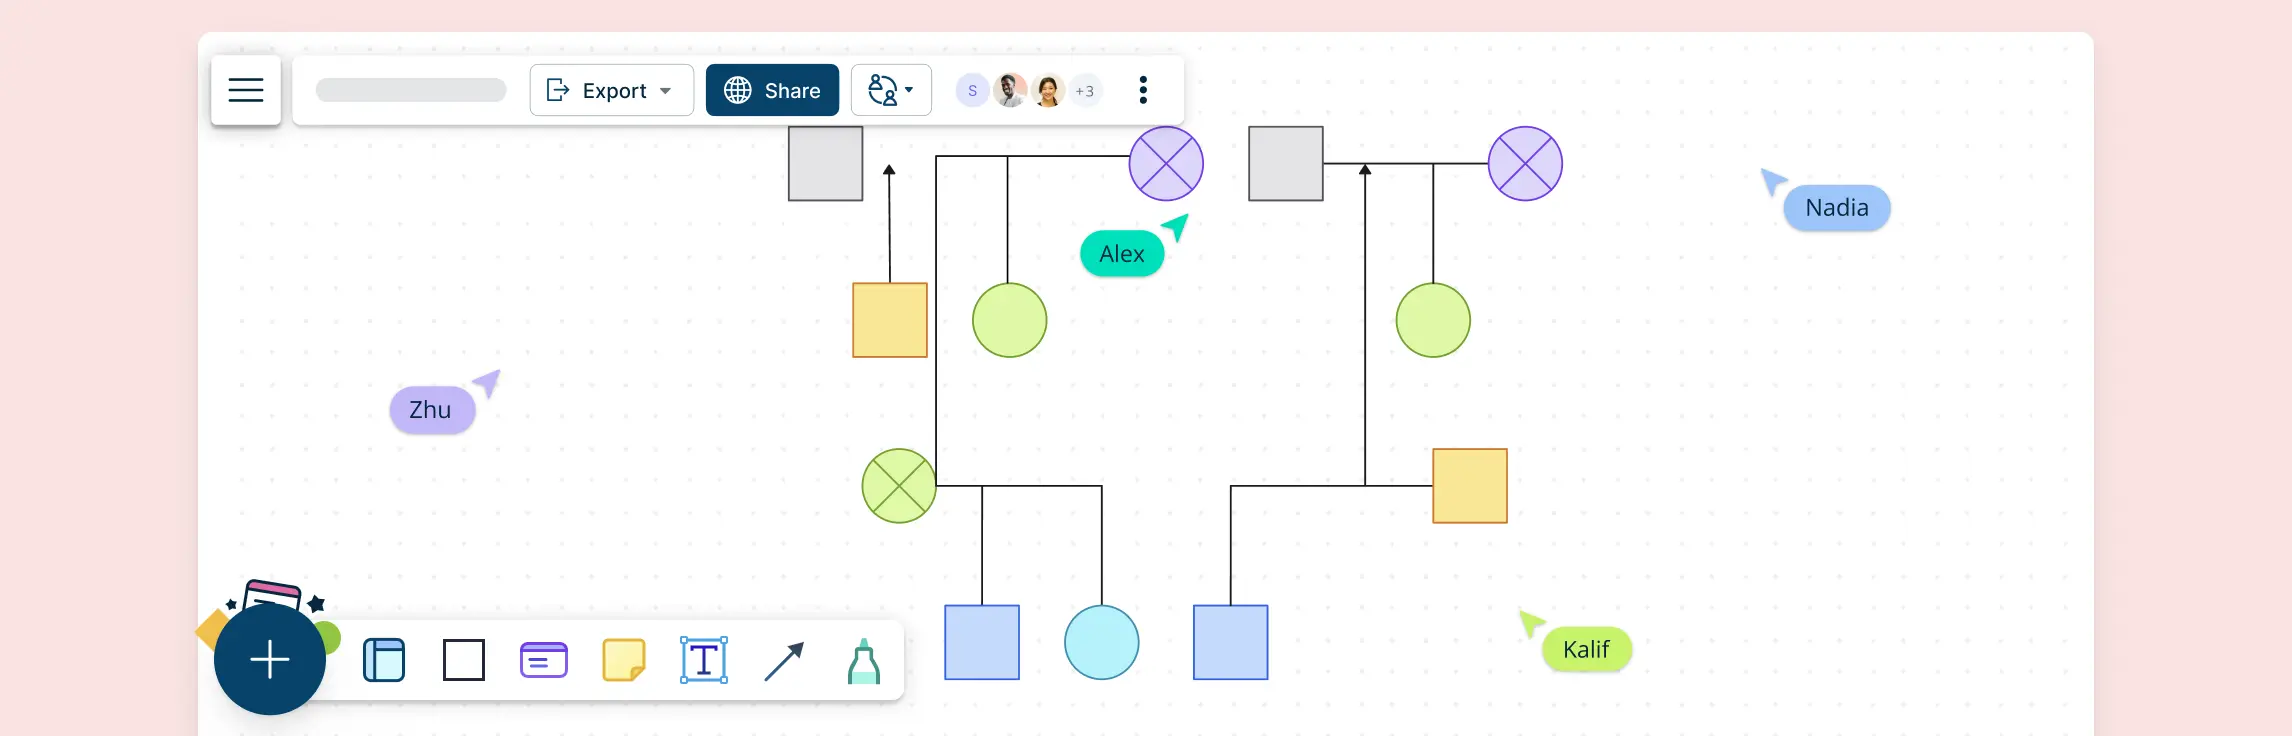
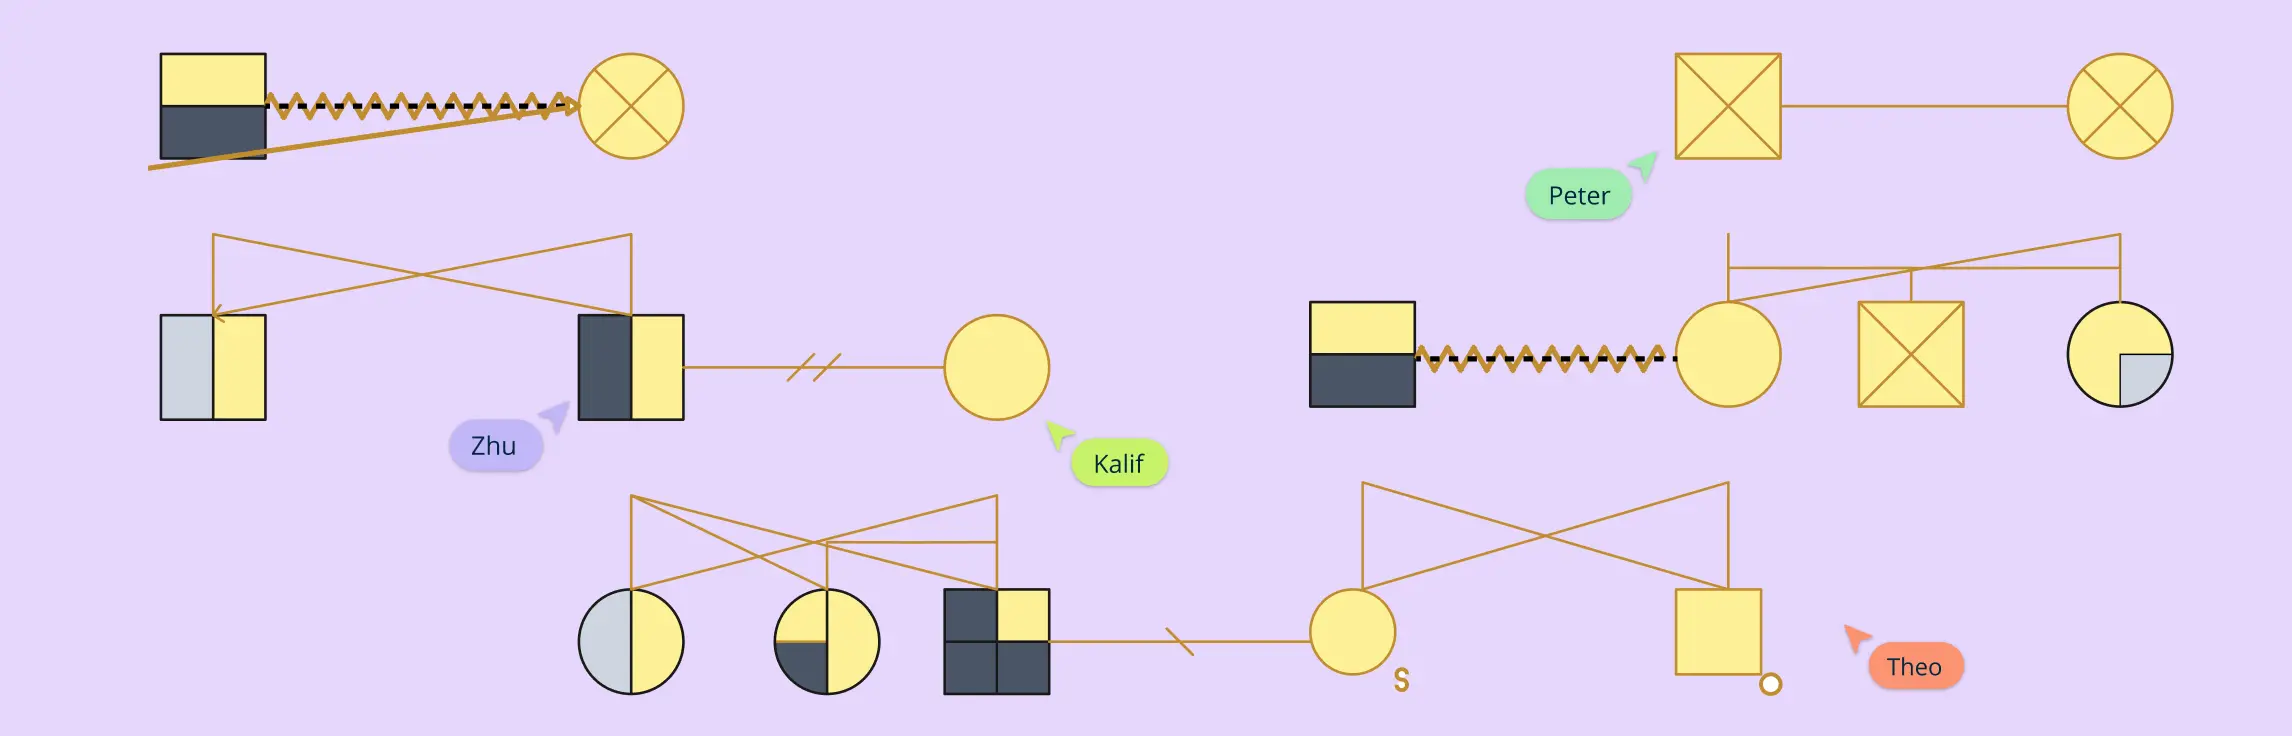
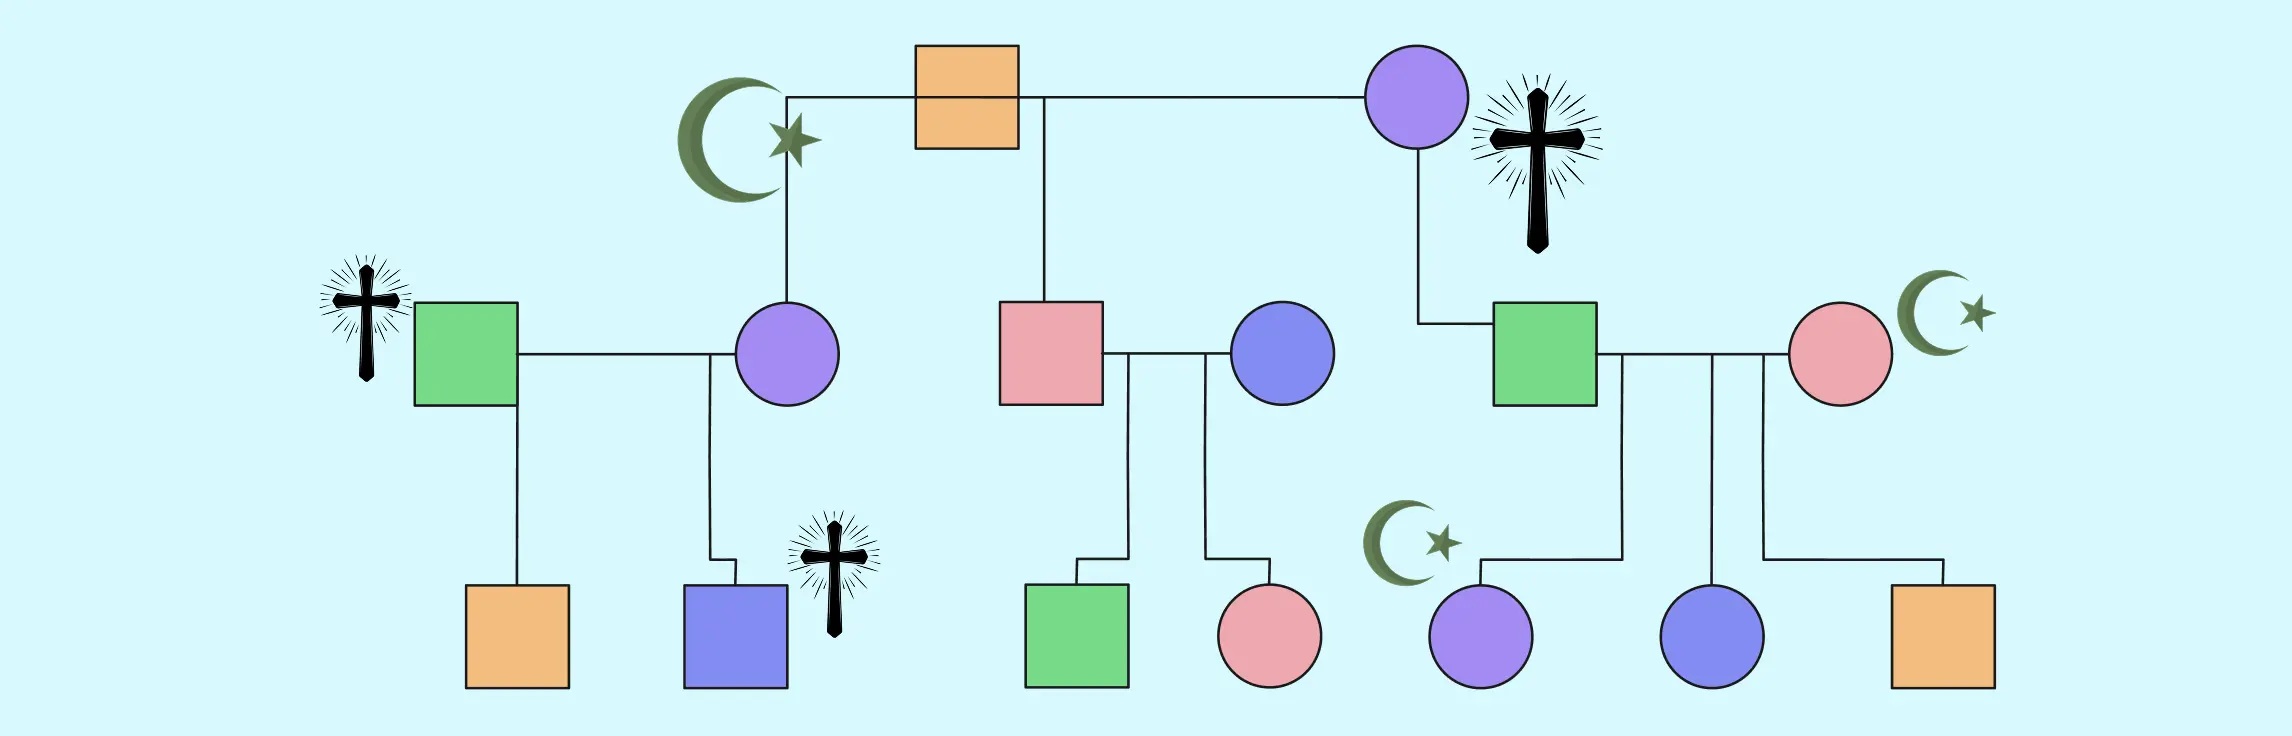
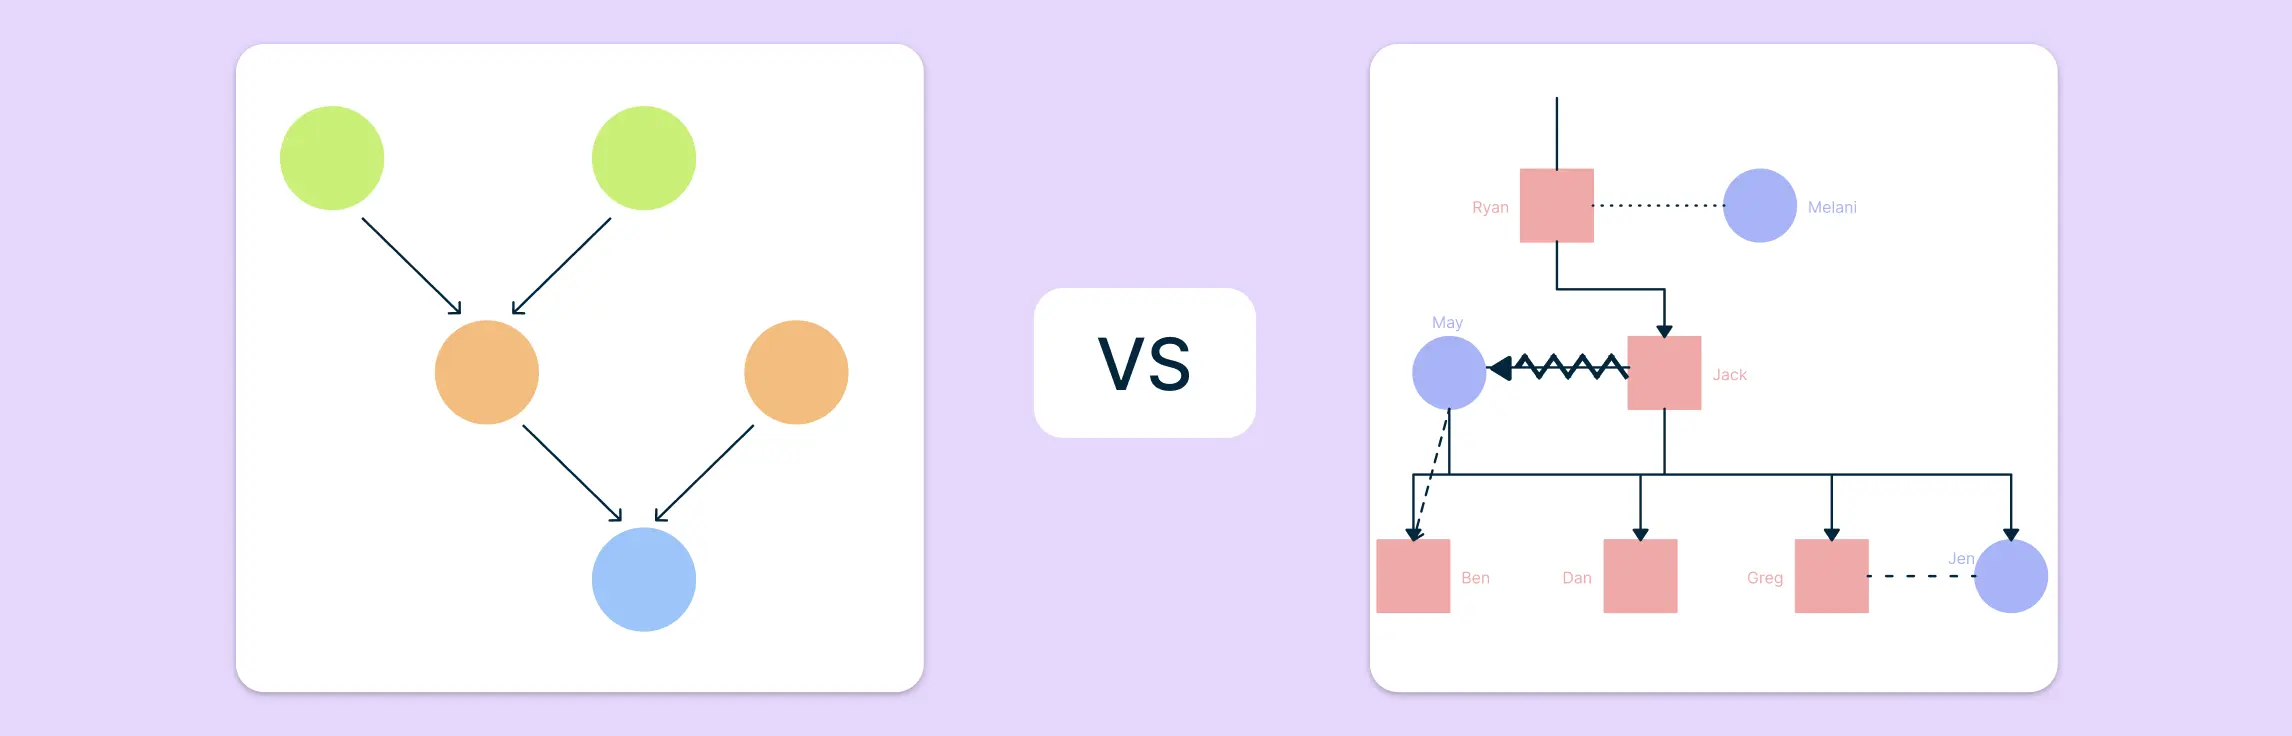
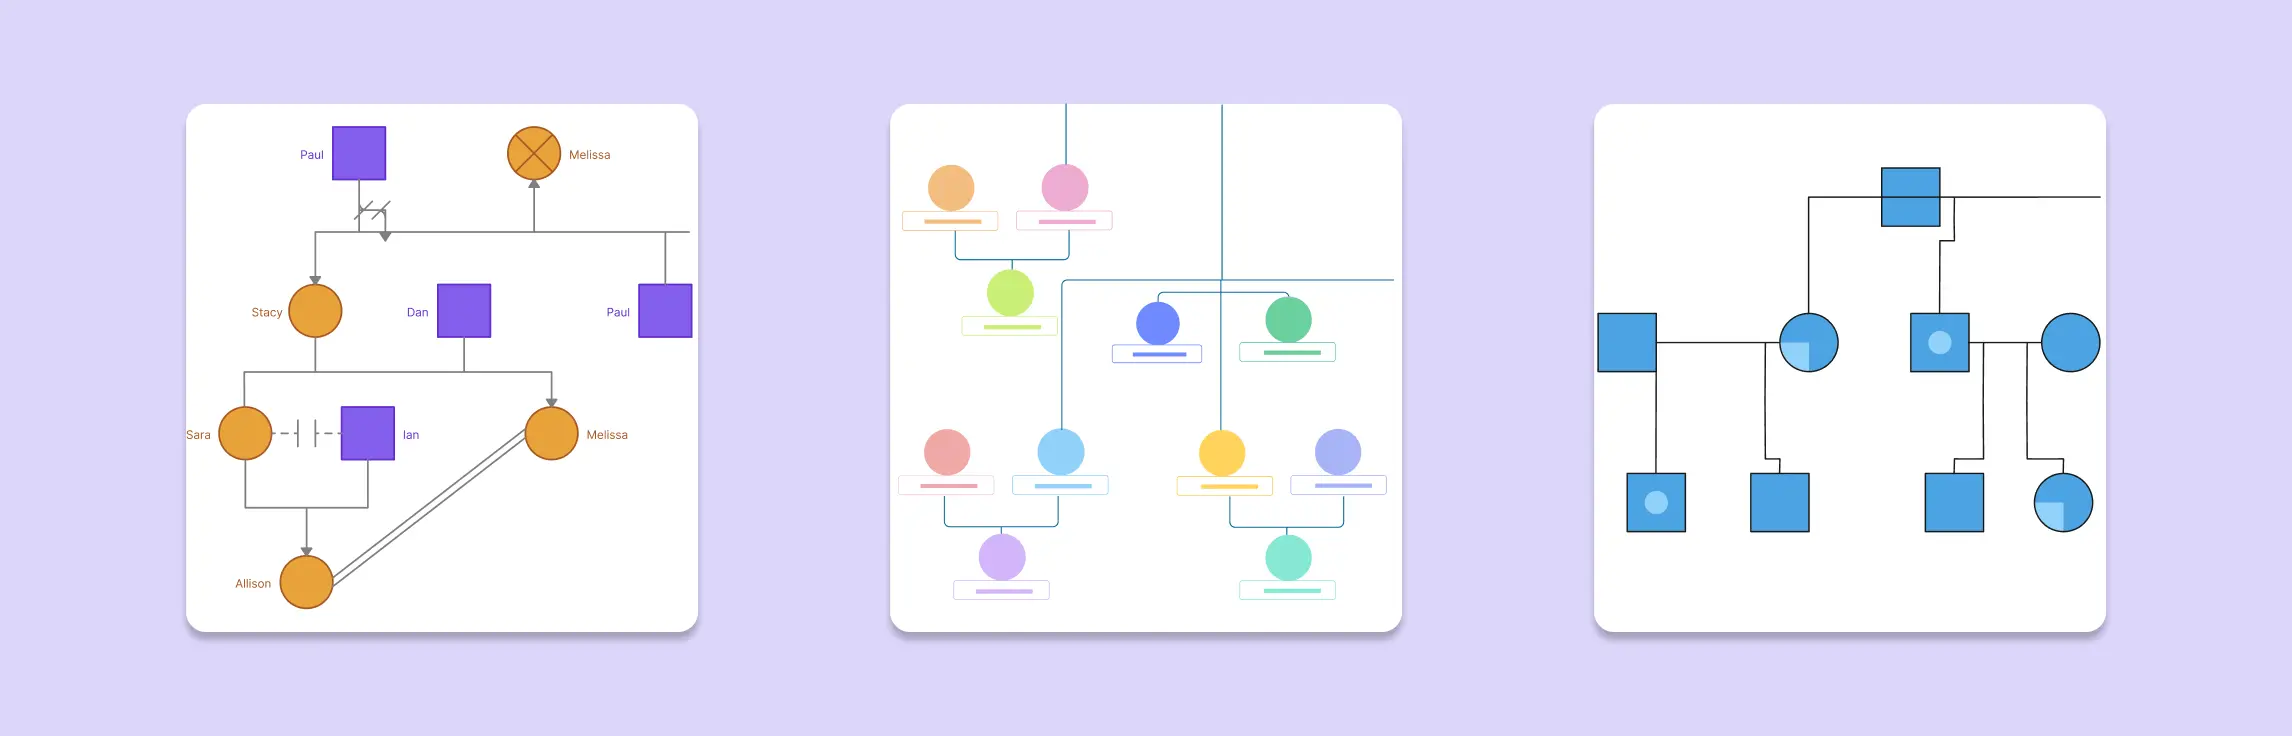
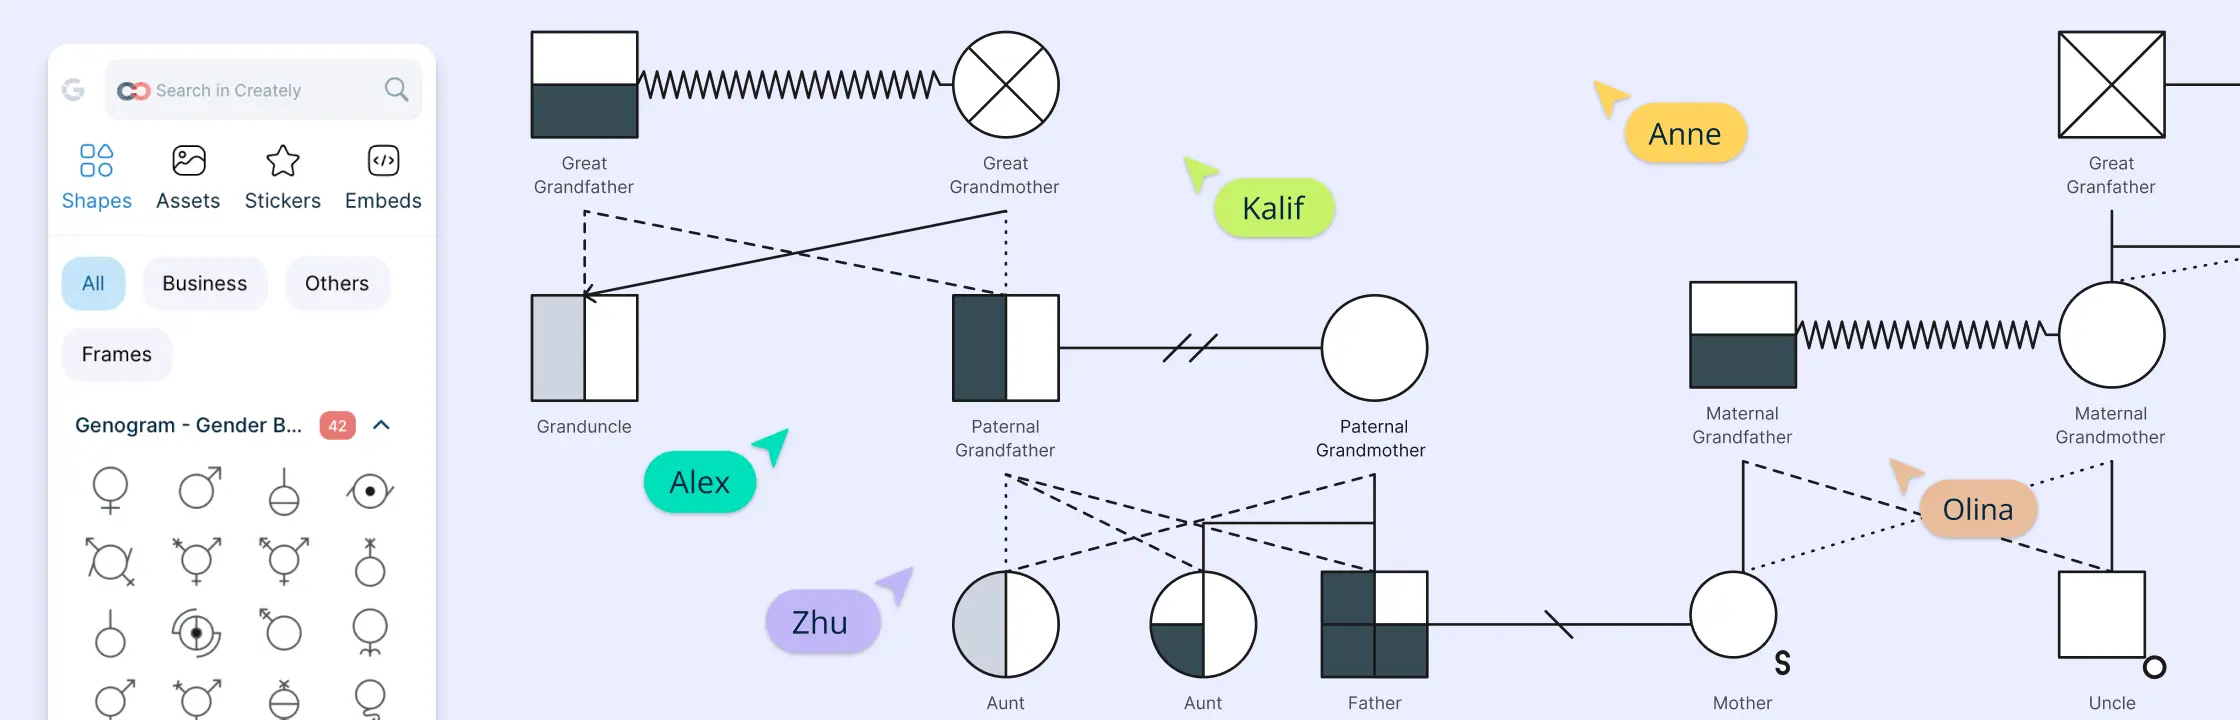
Genogram symbols help you show who is in a family, how people are connected, and which relationship, emotional, or medical patterns matter. This guide explains the most common genogram symbol groups, how to read them, and how to use a legend so others can interpret your genogram accurately. Read More
A cultural genogram helps therapists-in-training see how culture, migration, religion, language, and family history shape both clinical understanding and self-awareness. In practical training settings, it is often used to support reflection, supervision, classroom discussion, and intake practice. This guide explains what a cultural genogram shows, what the main symbols represent, and 10 useful ways educators and trainees can apply it. Read More
In the field of social work, understanding a client’s environment is just as important as understanding the client themselves. This is where an ecomap in social work becomes an invaluable tool. It provides a visual snapshot of the client’s social and environmental world, mapping out connections to family, friends, work, community resources, and other influential systems. This guide will help you better understand and apply the ecomap in social work to enhance client systems and support informed intervention planning. Read More
A simple genogram is a powerful visual tool used to map out family relationships, behaviors, and patterns over multiple generations. Unlike a basic family tree, a genogram offers deeper insights into the dynamics of family connections—including emotional ties, medical histories, and even career paths. Whether you’re a counselor, healthcare professional, or simply seeking to understand your family’s history, creating a simple genogram can help uncover important patterns and connections that influence behavior and decision-making. Read More
A genogram in psychology is more than a family tree—it’s a visual tool for therapists, counselors, and mental health professionals to explore emotional patterns and relationships. This guide explains how to create a genogram psychology step-by-step, its benefits in therapy, and why Creately is ideal for accurate professional psychology genograms with free real world examples. Read More
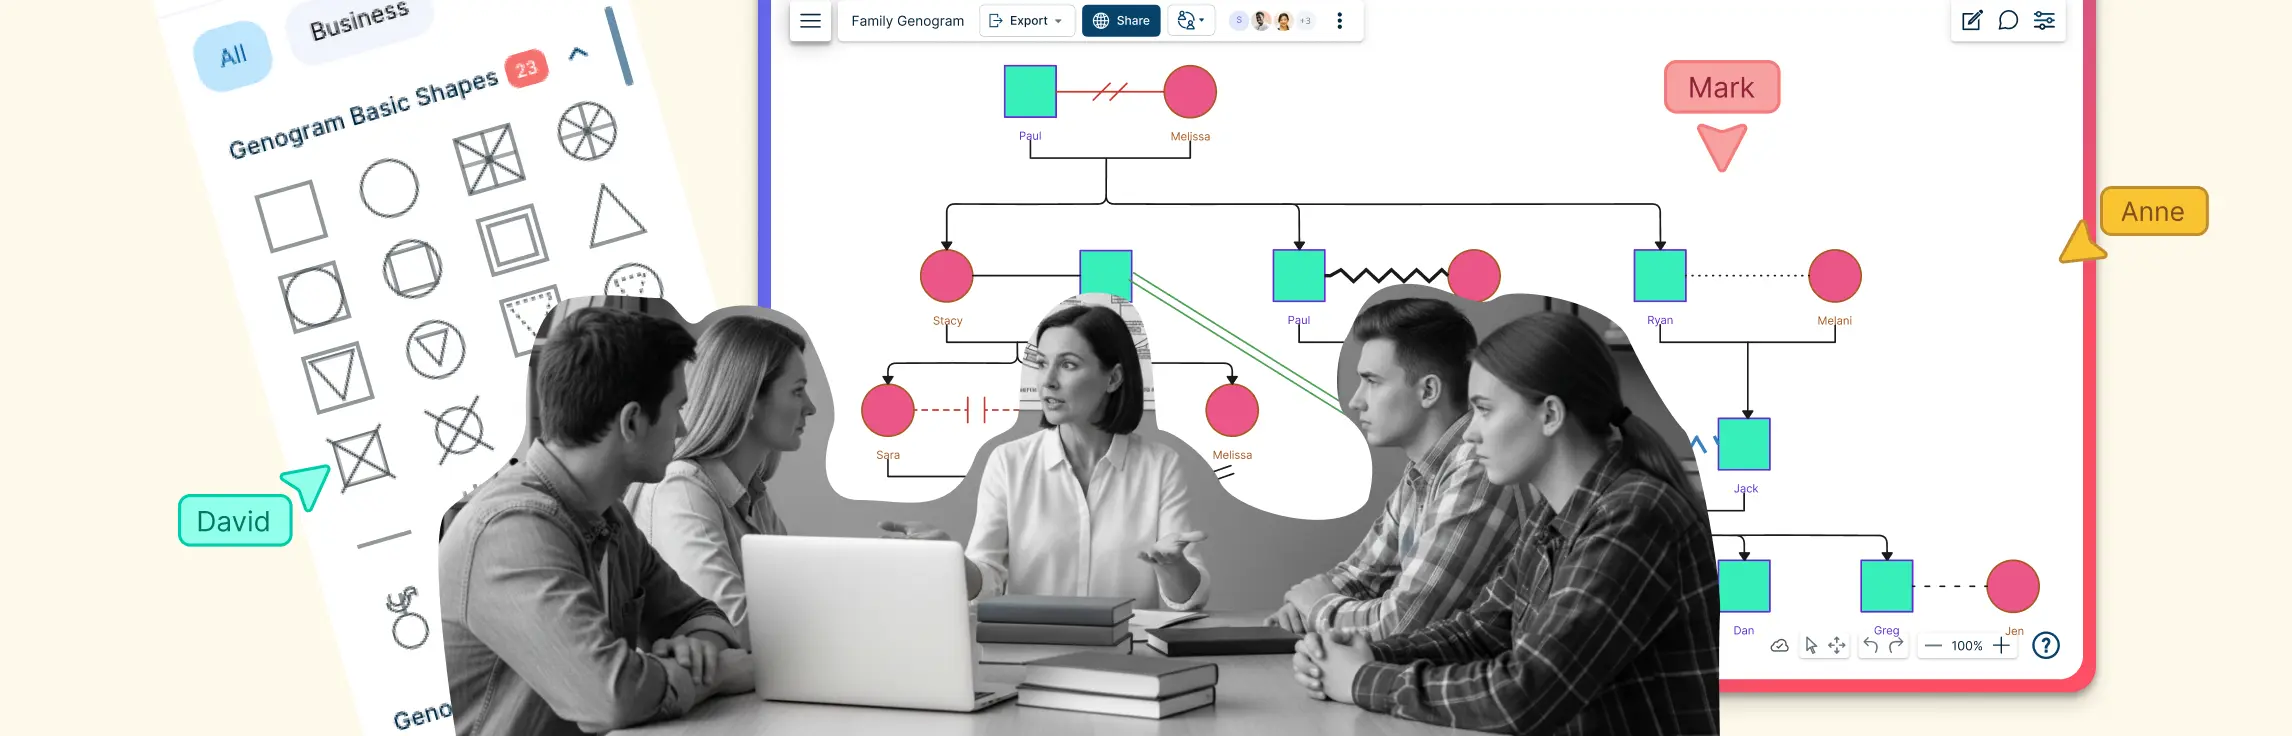
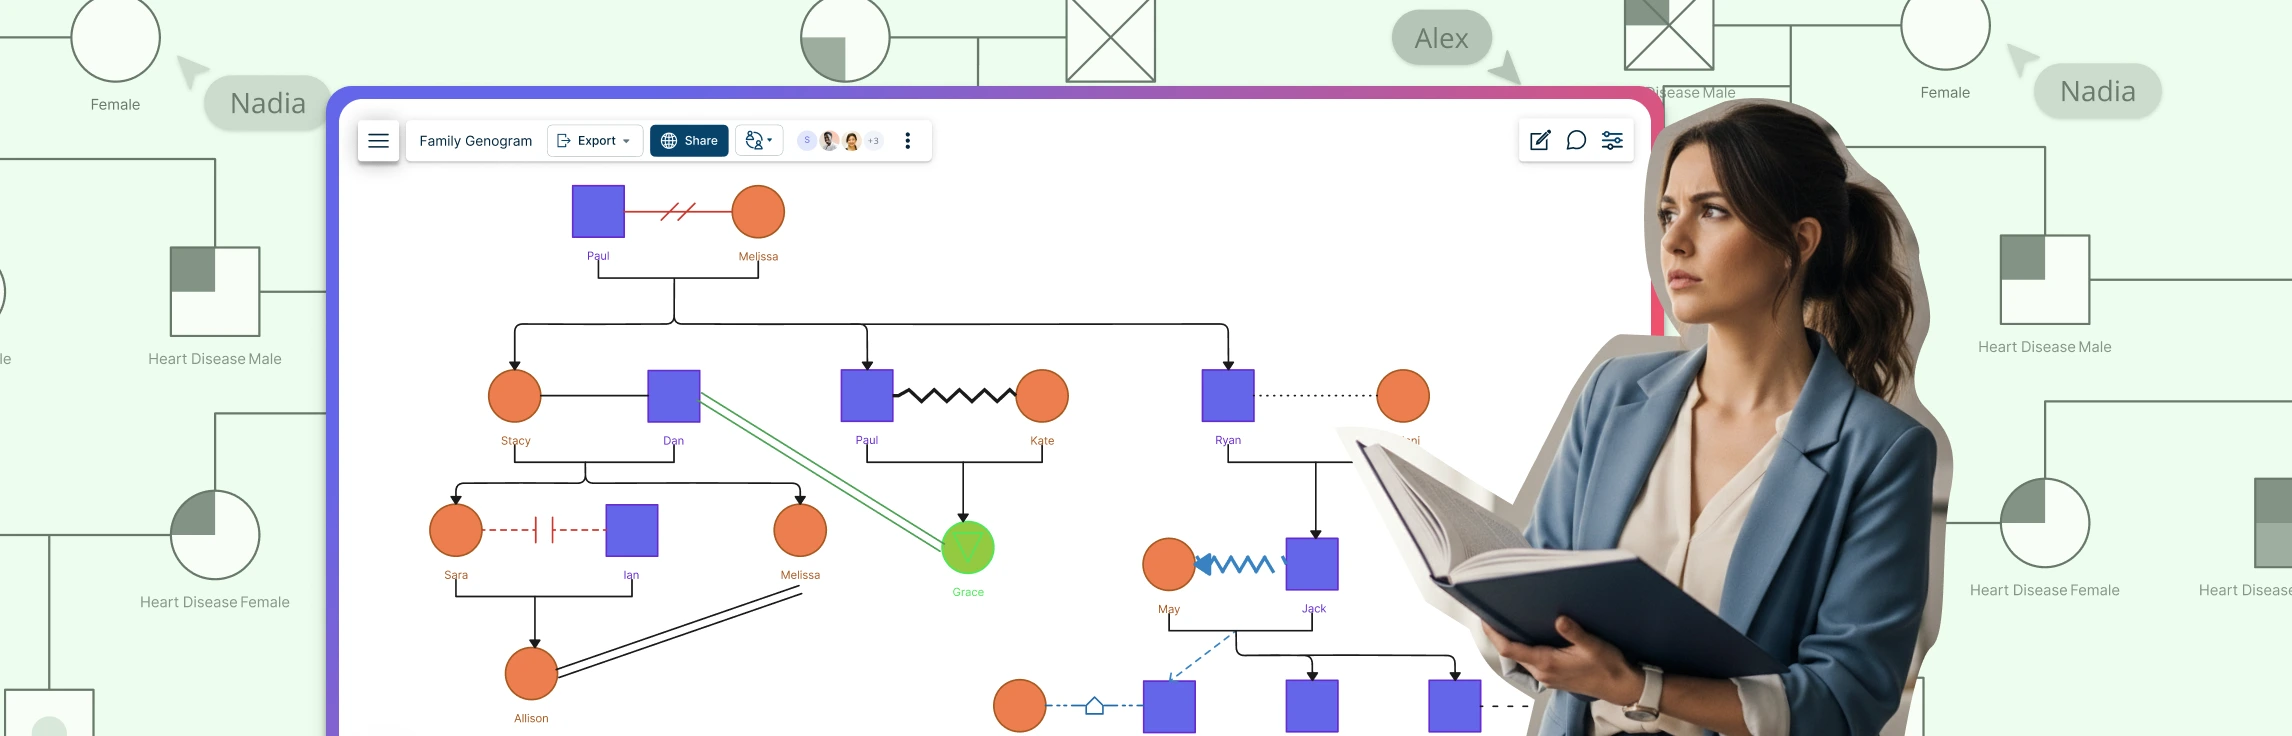
A family genogram goes beyond a traditional family tree by visually mapping relationships, health patterns, and emotional dynamics across generations. This guide explains what a family genogram is, how to create one step by step, and its practical uses in therapy, education, and healthcare. It also highlights the key benefits of building a genogram and introduces Creately as a simple, effective platform for designing your own. Read More
What Are Spiritual Genograms? spiritual genograms are a visual representation of an individual’s or family’s spiritual and religious history across multiple generations. It maps out significant spiritual events, denominational affiliations, religious beliefs, practices, and spiritual orientations within a family. Much like a family genogram, which focuses on family relationships, a spiritual genogram emphasizes the spiritual connections and influences that shape a person’s worldview and spiritual identity. Read More
Understanding your family’s history involves more than just names and dates, it’s about uncovering the stories and connections that define your lineage. This guide explains the differences between genograms and family tree diagrams, their importance, and how Creately can help you create them. Read More
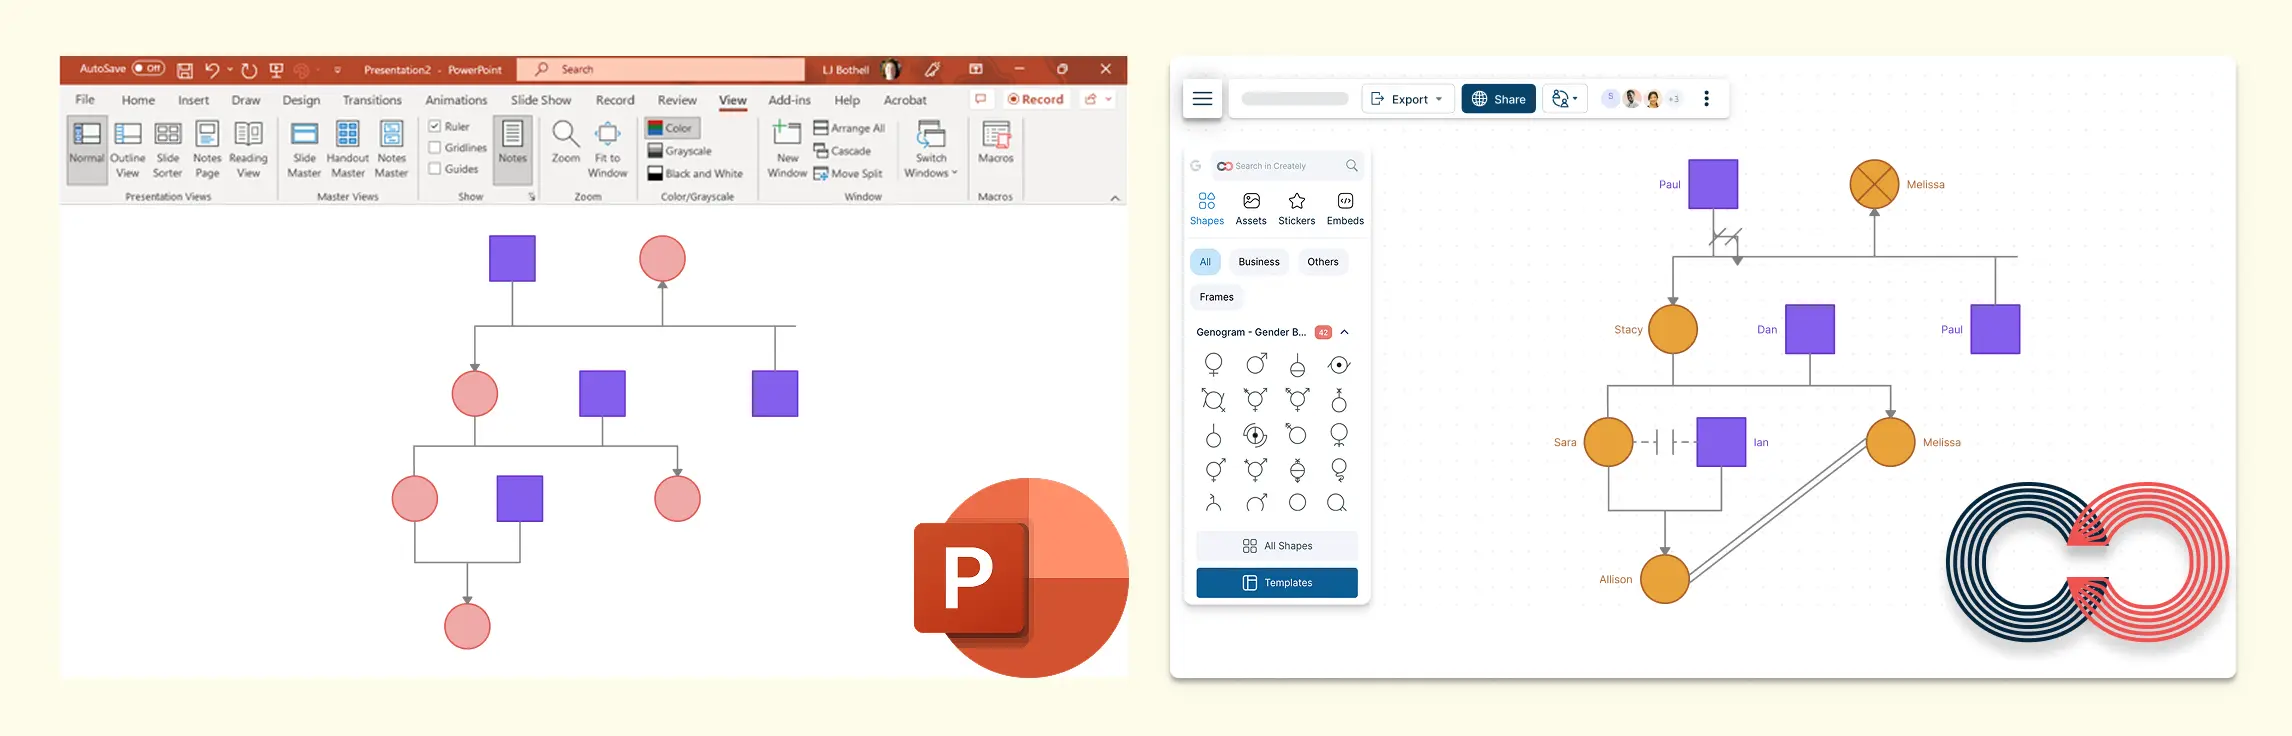
If you’ve tried building a genogram in PowerPoint, you’ve probably run into the same friction points: manually duplicating shapes, aligning connection lines, and trying to represent complex family dynamics with tools that weren’t built for genograms. That’s where Creately offers a major advantage. Instead of treating a genogram like a slide drawing, it gives you purpose-built genogram tools such as clinically meaningful relationship types, AI-assisted generation, structured family data fields, and export options that work better for documentation, collaboration, and presentations. Read More
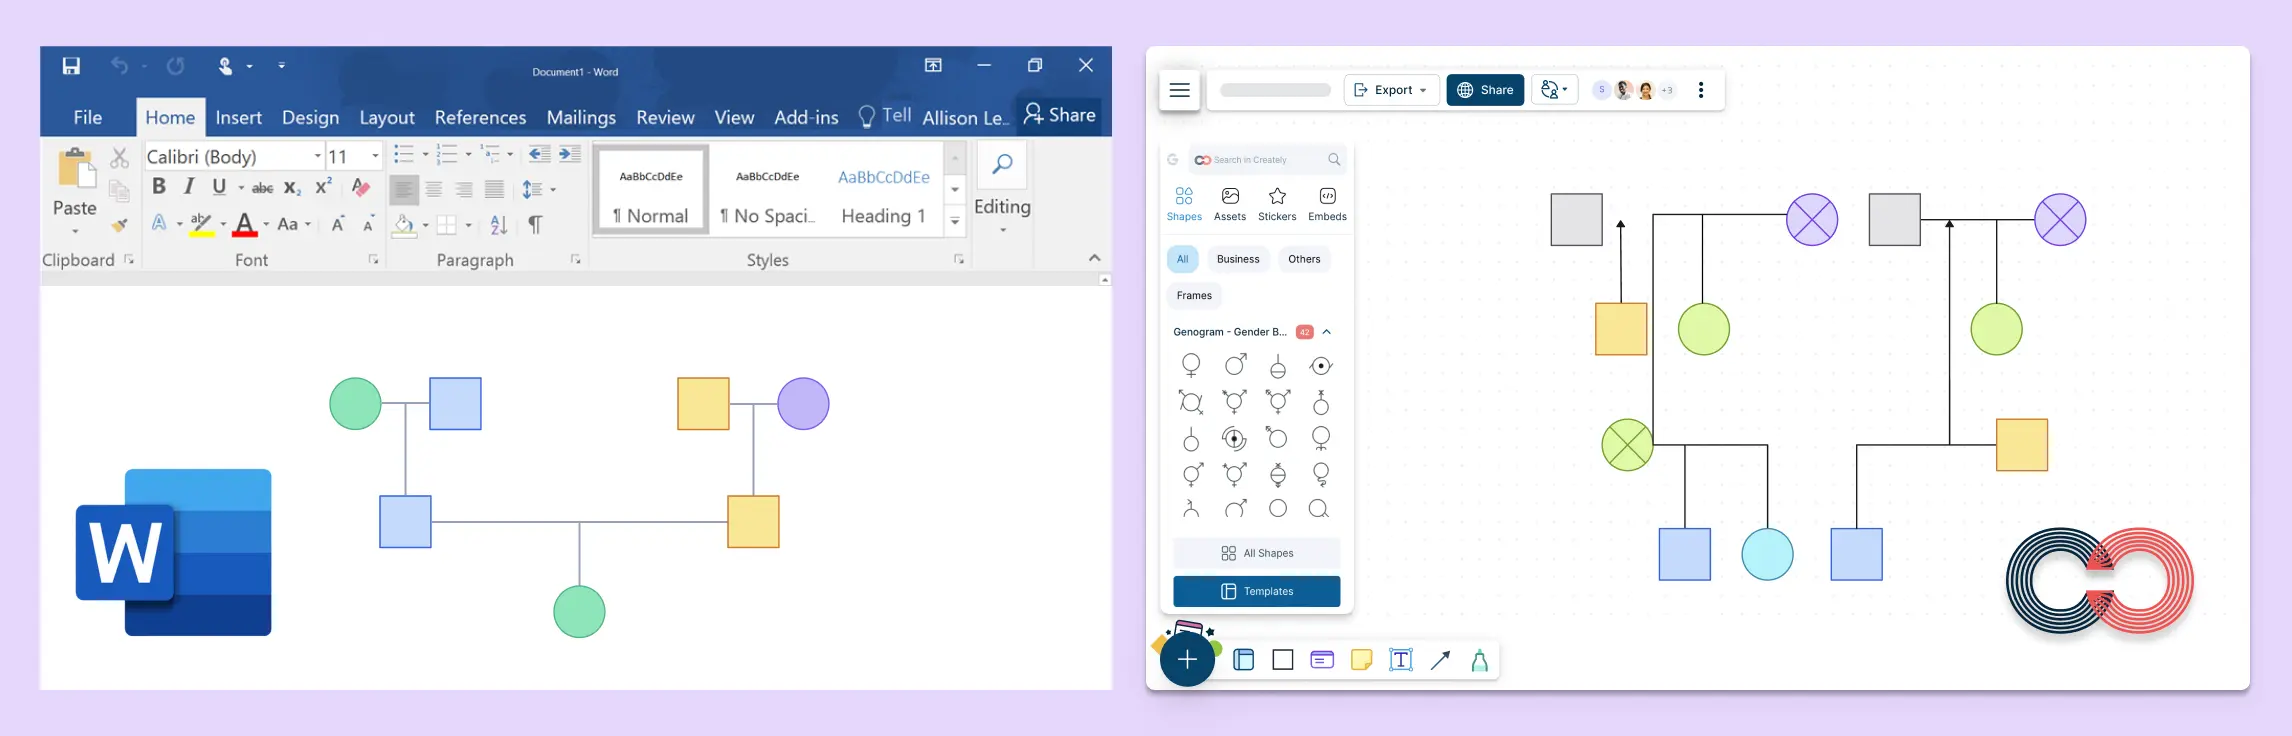
You can create a genogram in Microsoft Word by adding shapes for family members, labeling them, and manually drawing relationship lines. That works for simple family maps, but it gets slow once you need standardized symbols, multi-generation edits, or detailed emotional and medical relationships. This guide shows the basic Word workflow, its main limitations, and when a dedicated genogram tool is easier to manage. Read More
A creative genogram is a dynamic and visually engaging way to map family histories, emotional relationships, and generational patterns. Unlike traditional genograms, which focus primarily on lineage and medical history, creative genograms incorporate colors, symbols, and other elements to provide a deeper understanding of family dynamics and emotional connections. Read More
Graphic organizers for math help students break down problems, compare concepts, organize data, and see relationships visually. For teachers, they are also useful classroom resources for lesson planning, small-group work, guided practice, homework support, and math intervention. Read More
A flowchart loop is a fundamental concept in process automation and programming, allowing tasks to repeat based on a defined condition. Whether used in software development, workflow optimization, or decision-making processes, flowchart loops help visualize repetitive actions clearly and efficiently. Read More
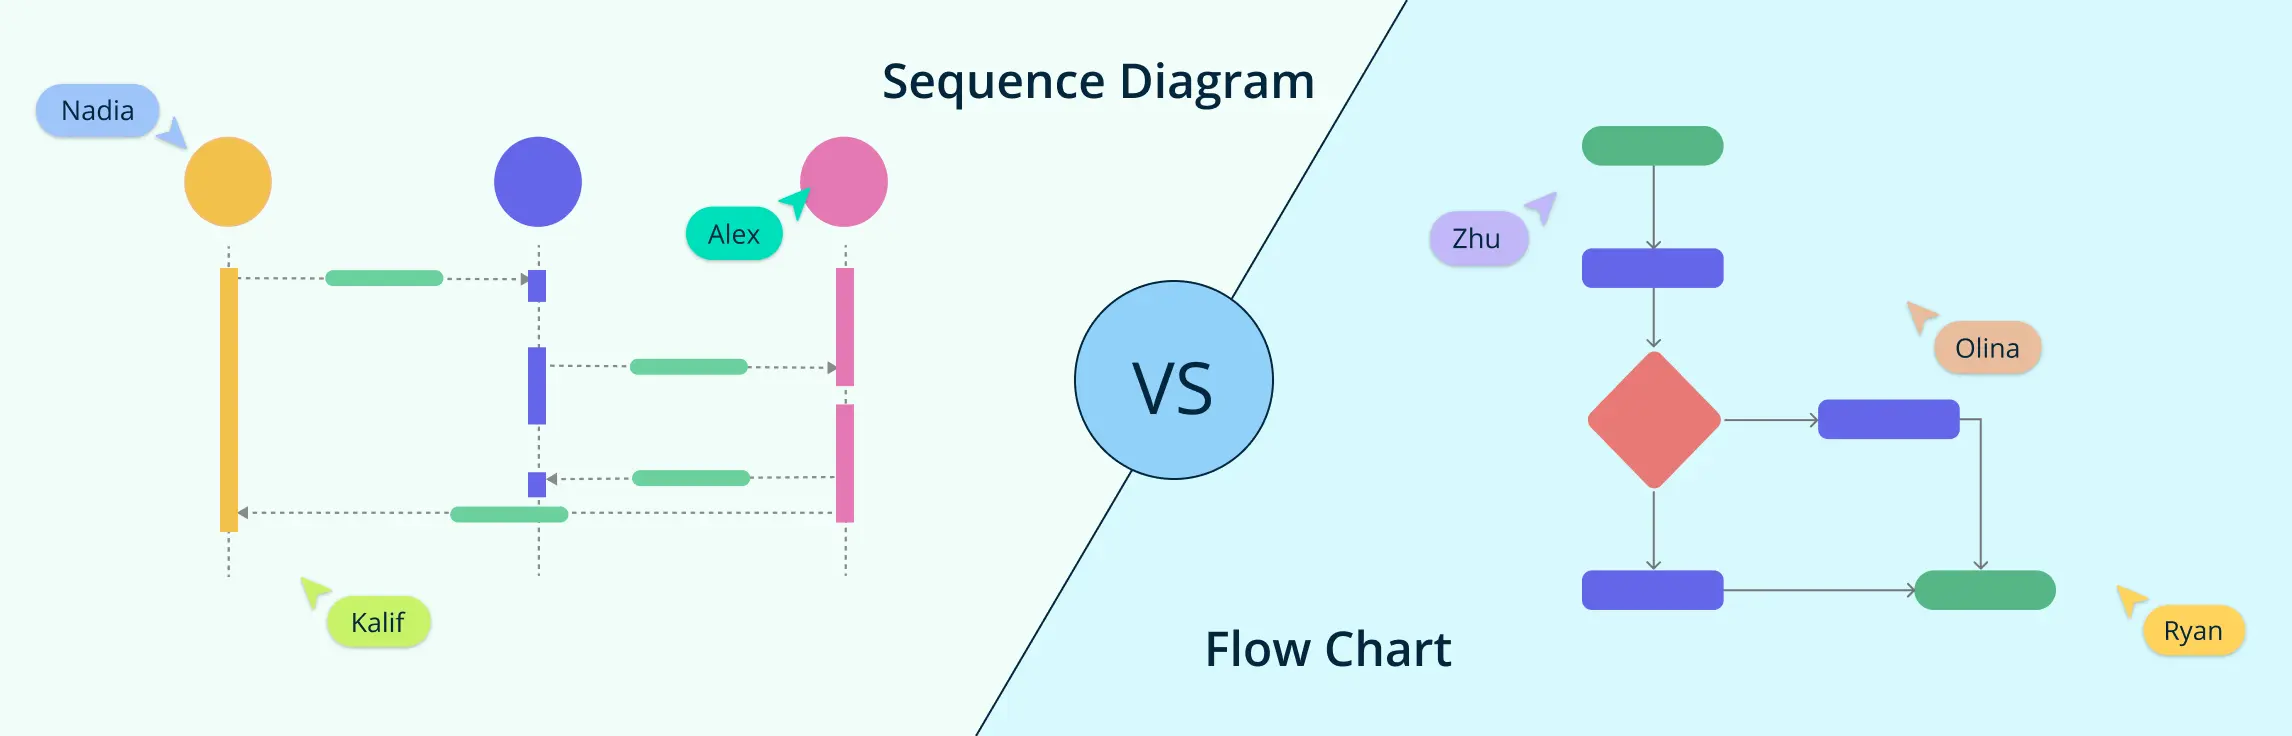
When it comes to visualizing processes and system interactions, two of the most commonly used diagramming methods are flowcharts and sequence diagrams. While both are powerful tools for representing workflows and system behaviors, they serve distinct purposes and follow different structures. Read More
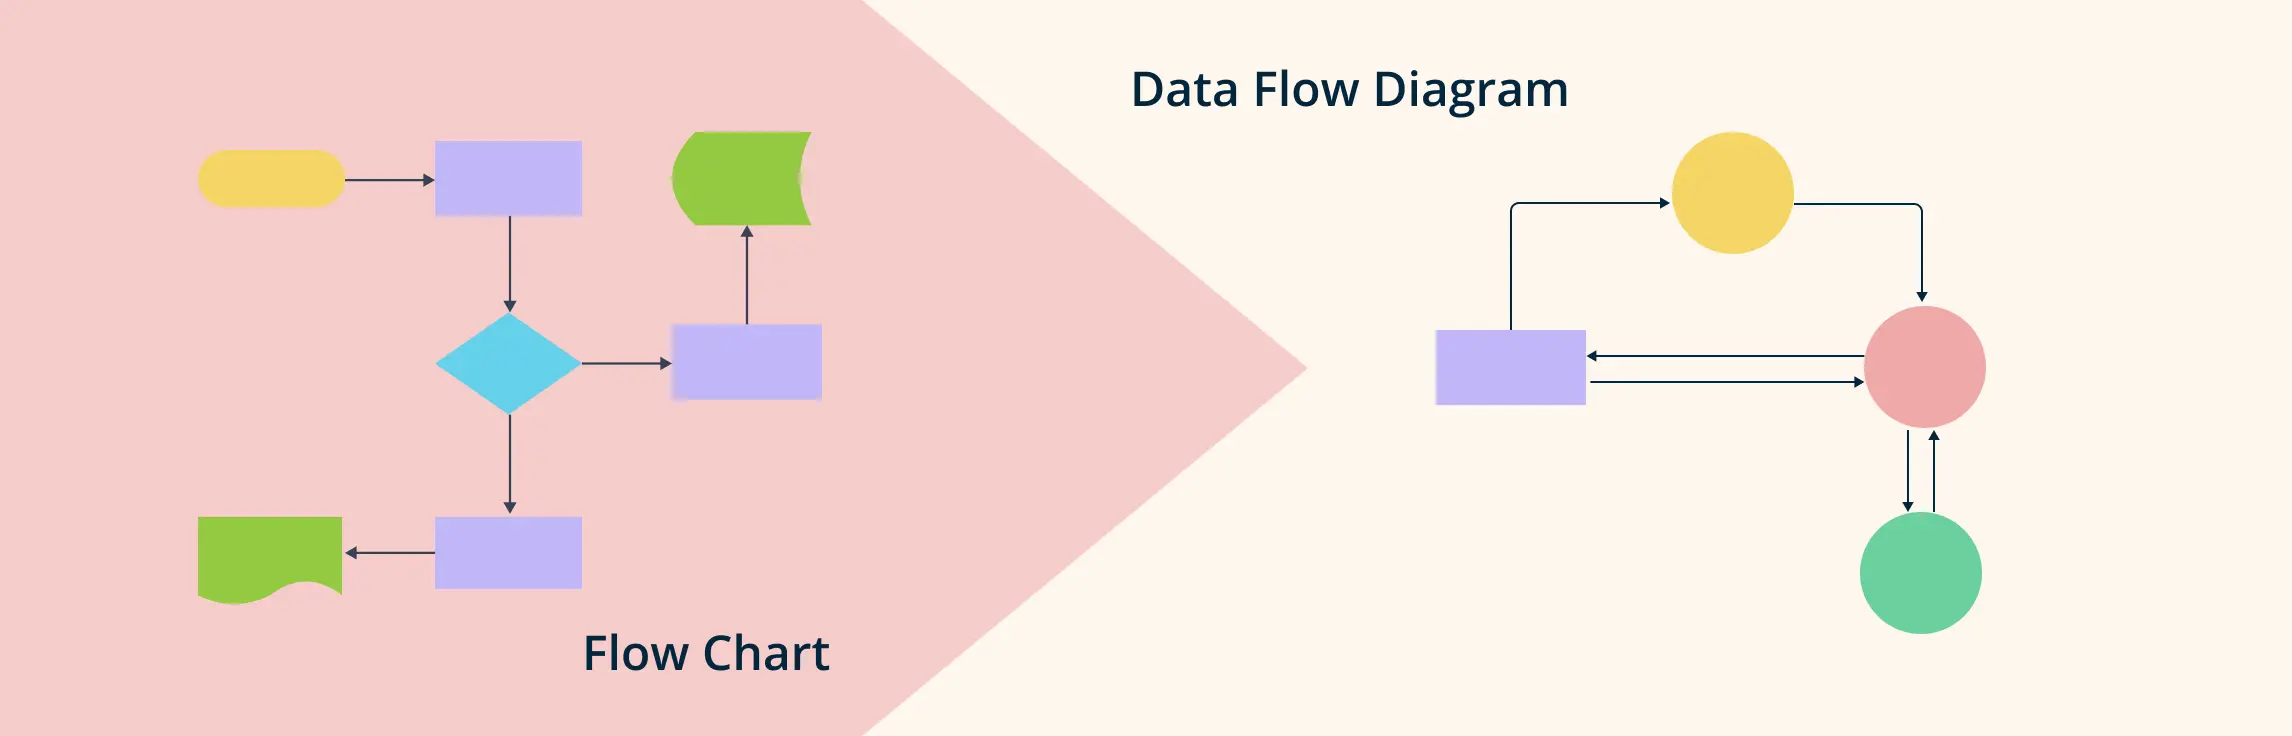
In today’s fast-paced world, visualizing data and processes is essential for clear communication and effective decision-making. Flowcharts and Data Flow Diagrams (DFDs) are powerful tools that help break down complex workflows, making them easier to understand and analyze. Whether you’re looking to map out a business process, analyze a data system, or improve communication within your team, flowcharts and DFDs can simplify the process and enhance collaboration. Read More
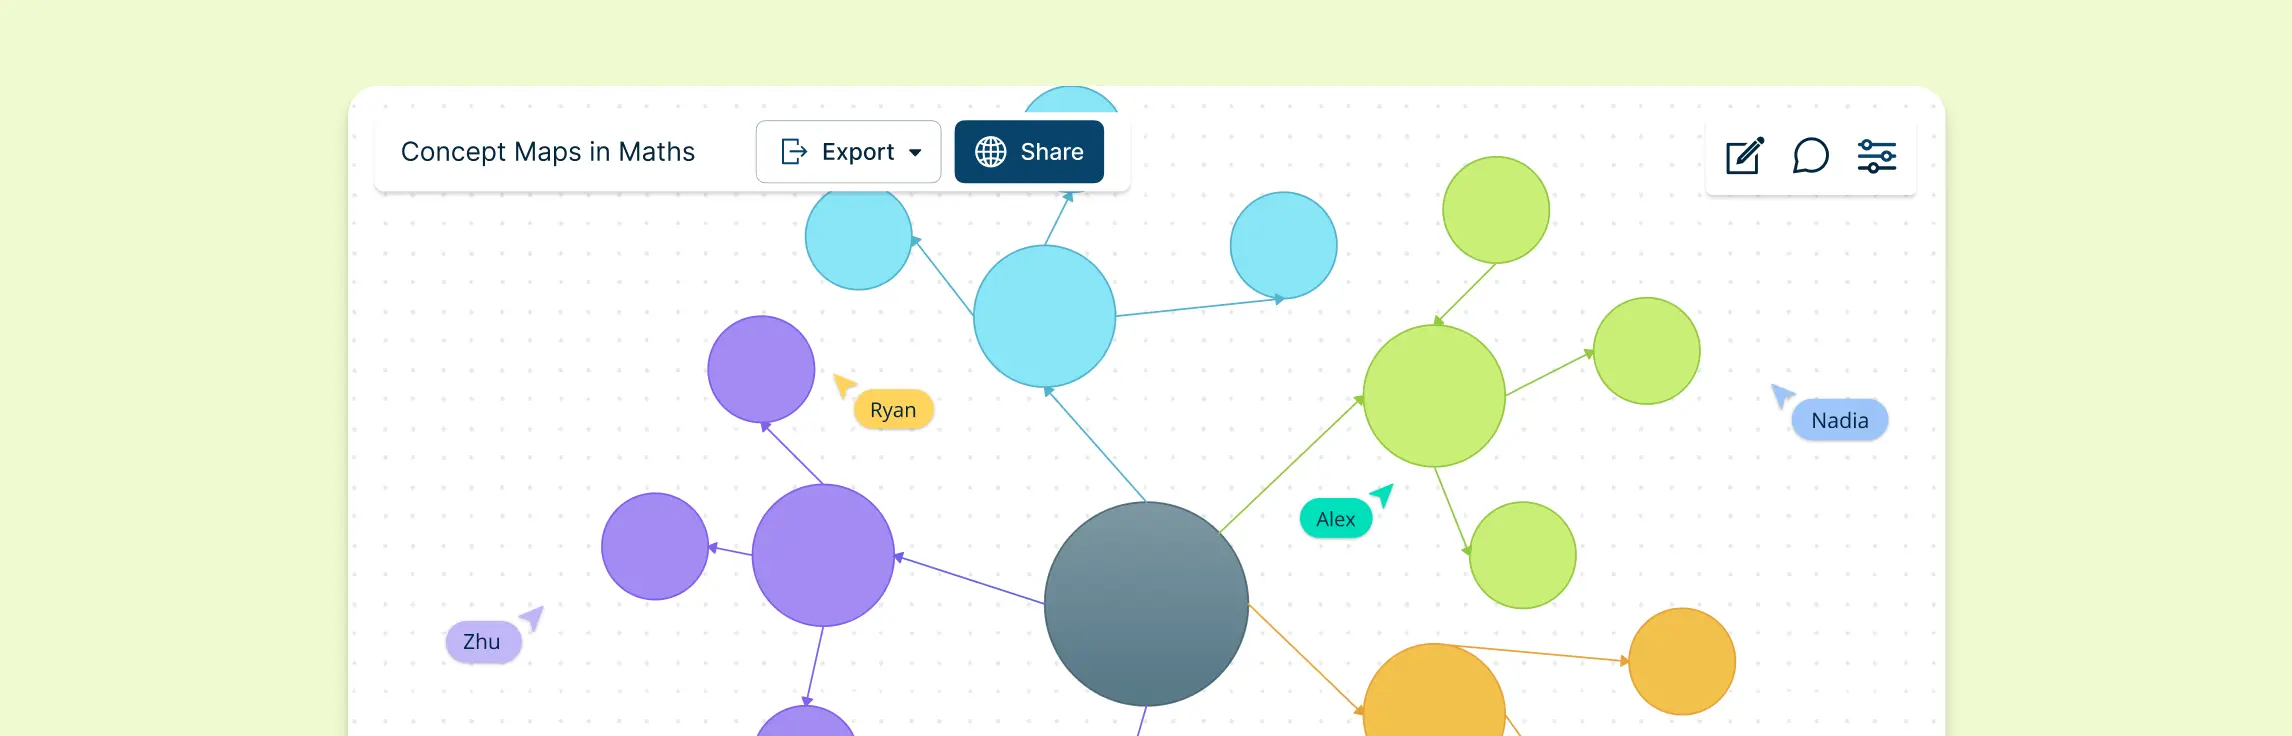
Mathematics can often feel overwhelming due to its abstract concepts, complex formulas, and intricate relationships between ideas. However, one powerful tool can simplify these challenges: concept maps.In this guide, we’ll explore how concept mapping maths can transform the way you learn and teach mathematics, offering step-by-step guidance and real-world examples to help you get started. Read More
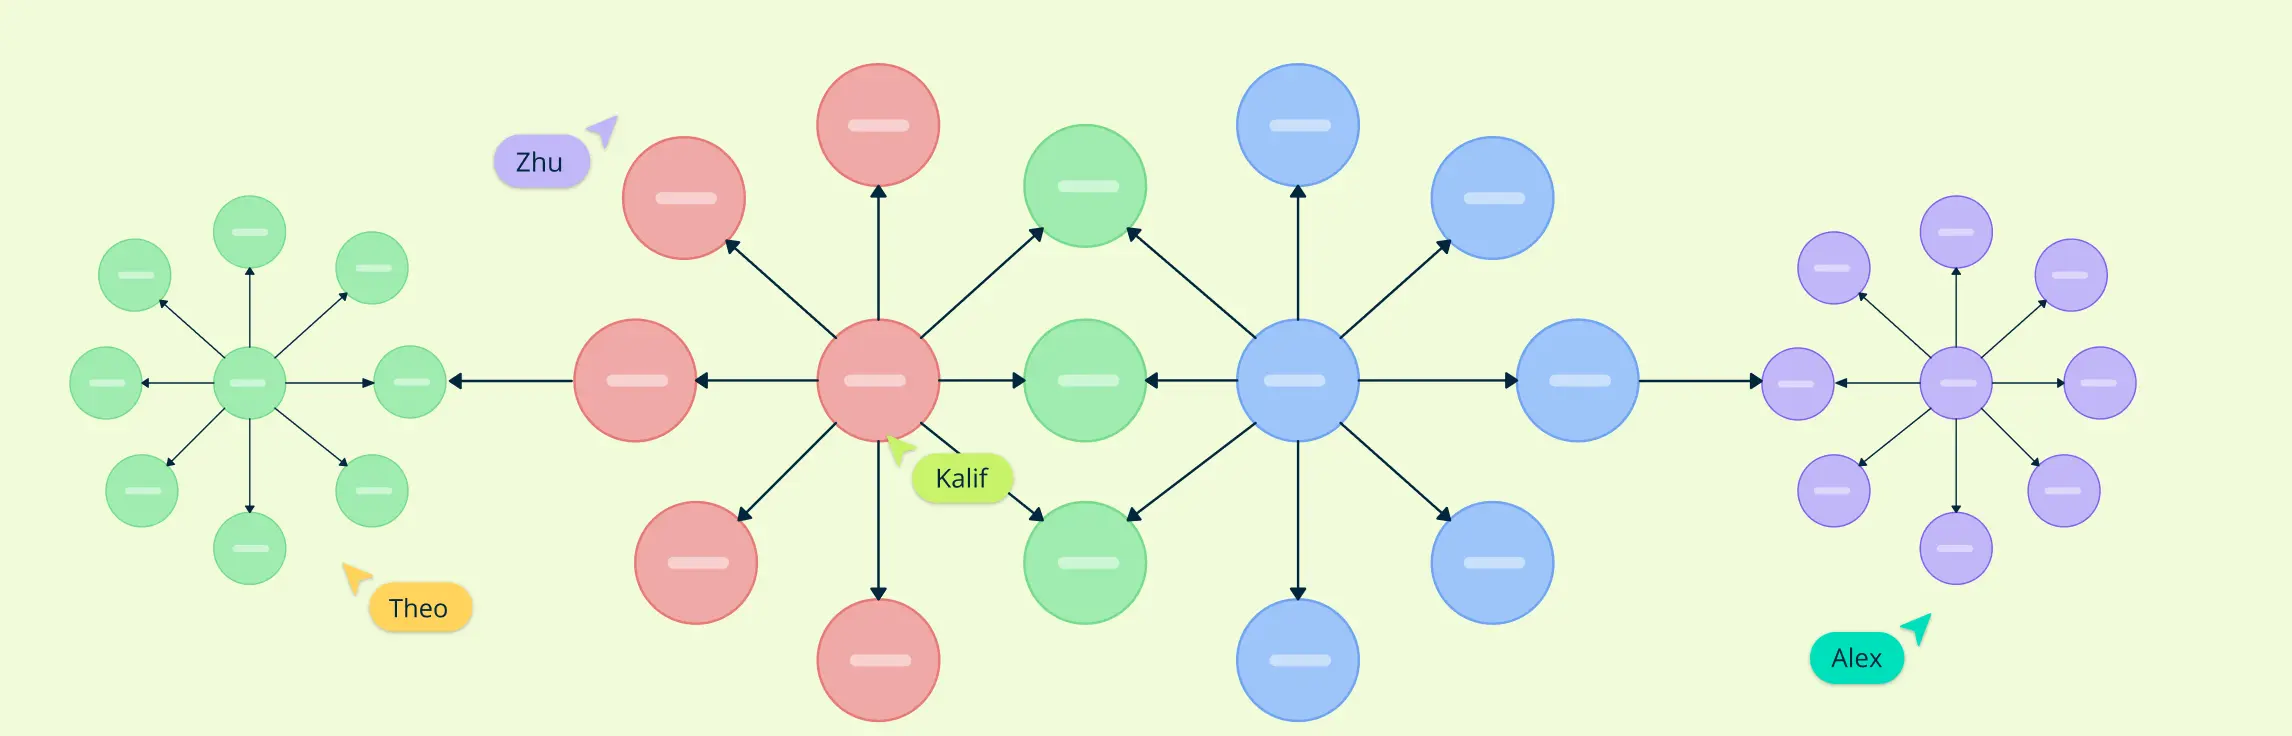
Using a concept map for research helps researchers organize and represent ideas, concepts, and their relationships within a research project. In this guide, we will explore how concept mapping in research can simplify the process of visualizing your ideas, enhance your critical thinking, and improve your research outcomes. Read More
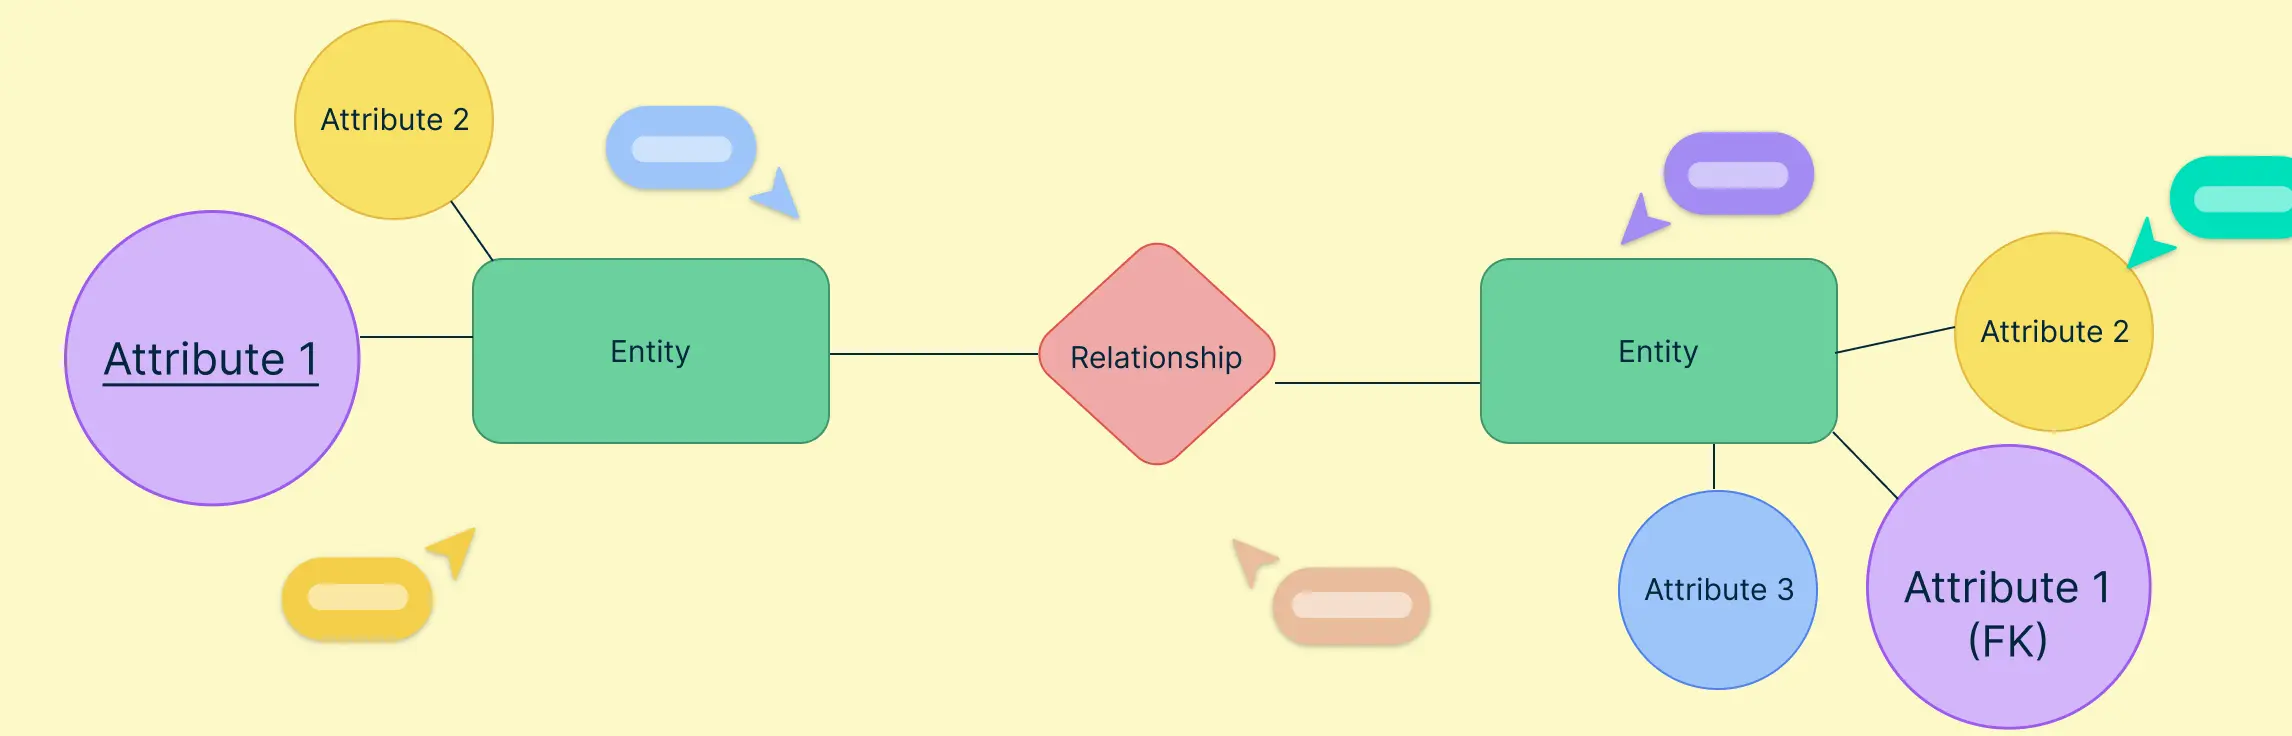
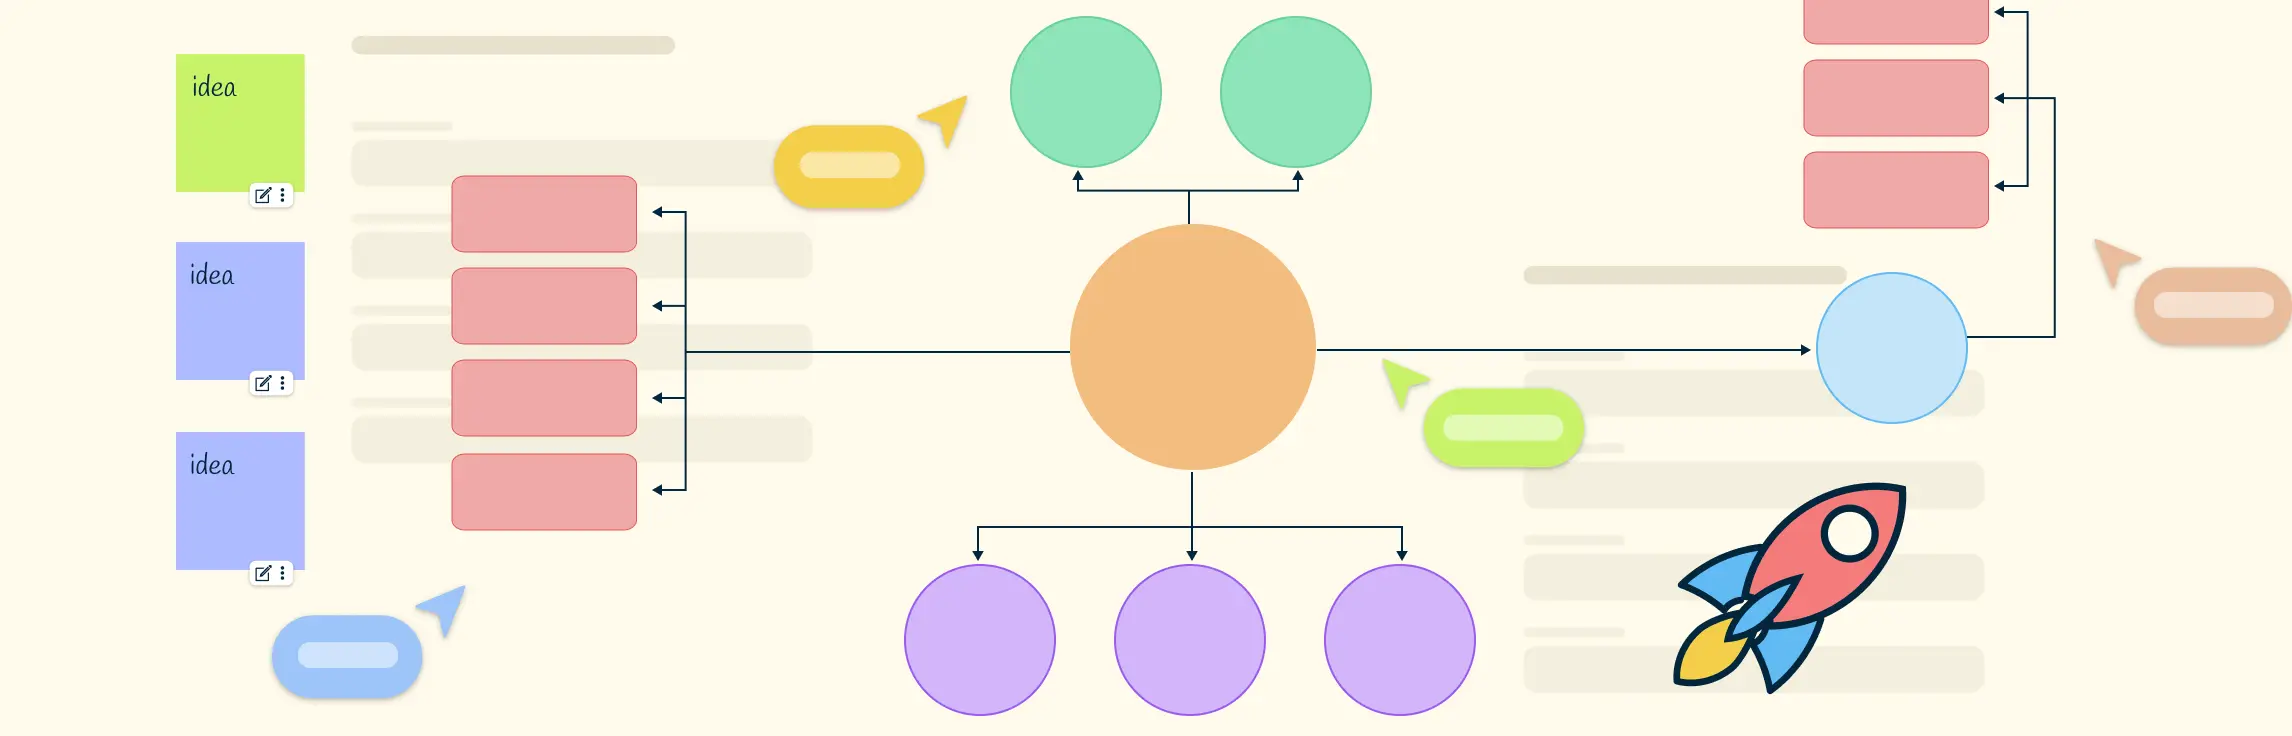
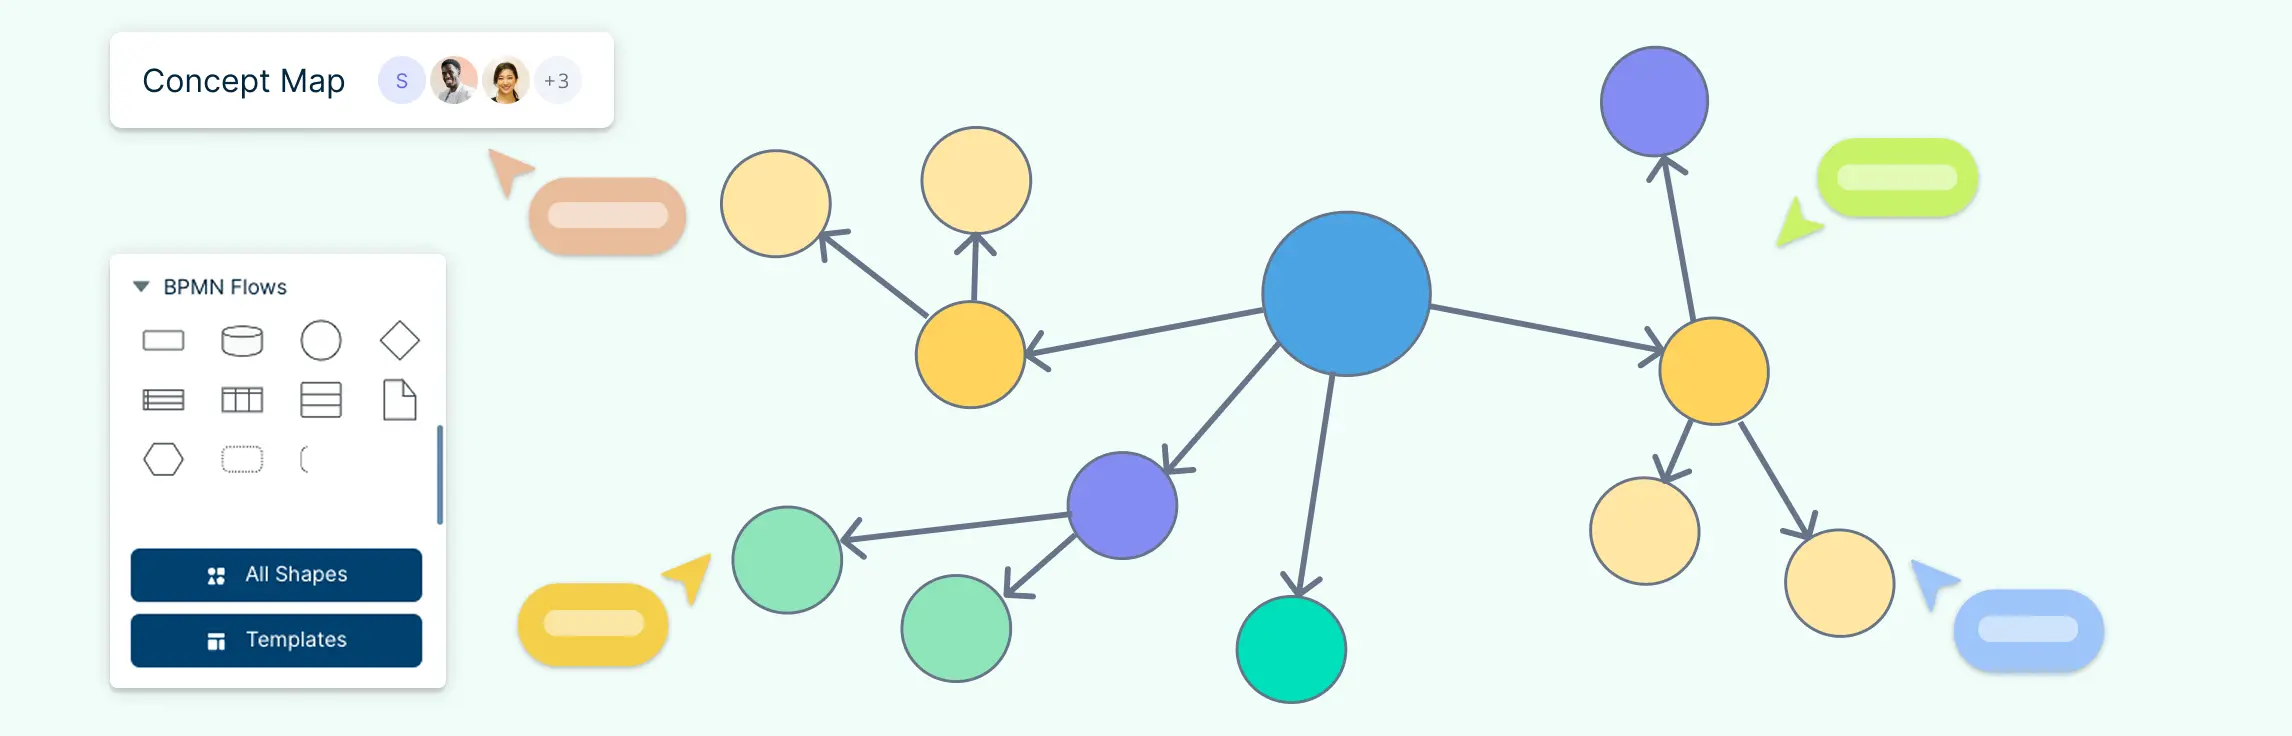
Definition of a Concept Map Concept map is a visual tool used to represent relationships between different concepts. They help organize and structure knowledge in a way that makes connections and hierarchies clear. They contain, Read More
A Corrective Action Plan (CAP) is essential in quality management for addressing issues at their root and driving long-term improvements aligned with organizational goals. Commonly used in industries like manufacturing, healthcare, IT, and food safety, CAPs help meet industry standards, enhance customer satisfaction, and ensure compliance. This guide covers everything you need to know about corrective action plans—from understanding their purpose and key components to step-by-step instructions on how to develop, implement, and monitor them for sustained success. Read More
In today’s digital-first world, businesses rely on software, apps, and online platforms to deliver value to their customers. Digital product management is the strategic process of overseeing the lifecycle of these digital products—from ideation to launch and continuous improvement. It involves aligning business objectives, user needs, and technology to create products that drive growth, engagement, and customer satisfaction. Read More
This guide is your roadmap to navigating the complexities of a digital project, with a focus on crafting a winning digital product strategy. Whether you’re launching a new digital product or optimizing an existing one, having a clear strategy is key to ensuring success. We’ll walk you through the essential steps, from setting objectives and understanding your target audience to using digital tools and agile methodologies for seamless execution. By the end of this guide, you’ll be equipped with practical insights to develop and implement a digital product strategy that drives your project forward and ensures lasting impact. Read More
Every successful business thrives on clear goals, well-defined processes, and efficient execution. An operational plan serves as a structured roadmap that bridges strategy and execution, ensuring that tasks are completed on time and aligned with business objectives. Whether you’re streamlining daily operations, improving team productivity, or driving long-term growth, a well-crafted operational plan provides the clarity and direction needed for success. Read More
A Corrective Action Plan (CAP) is a structured approach to identifying, addressing, and preventing recurring issues in an organization. Whether dealing with compliance violations, operational inefficiencies, or quality concerns, a well-designed CAP helps resolve problems at their root cause while improving processes and accountability. This guide provides a step-by-step approach to how to write a Corrective Action Plan to enhance efficiency, minimize risks, and drive continuous improvement. Read More
In today’s fast-paced work environment, effective collaborative team meetings play a crucial role in boosting both productivity and engagement. As team structures become more dynamic and work processes more complex, creating a collaborative team meeting culture is indispensable. These meetings serve as a platform where ideas are not only exchanged but enhanced, leading to innovative solutions and strategic advancements. Read More
Planning multiple projects at once can feel overwhelming, especially when trying to keep everything aligned with your business goals. That’s where portfolio roadmaps come in—they provide a clear, high-level view of your initiatives, ensuring resources are used wisely and teams stay on track. By mapping out projects, timelines, and dependencies, a portfolio roadmap helps organizations make informed decisions, manage risks, and adapt to changing priorities. In this guide, we’ll explore the key elements of portfolio roadmaps, why they matter, and how you can create one effortlessly using Creately’s visual collaboration platform. Read More
In today’s fast-paced digital world, organizations generate vast amounts of knowledge daily. However, without a structured approach to managing this knowledge, valuable insights can be lost, leading to inefficiencies and missed opportunities. Knowledge management is the systematic process of capturing, organizing, sharing, and utilizing information to enhance decision-making, innovation, and overall business performance. Read More
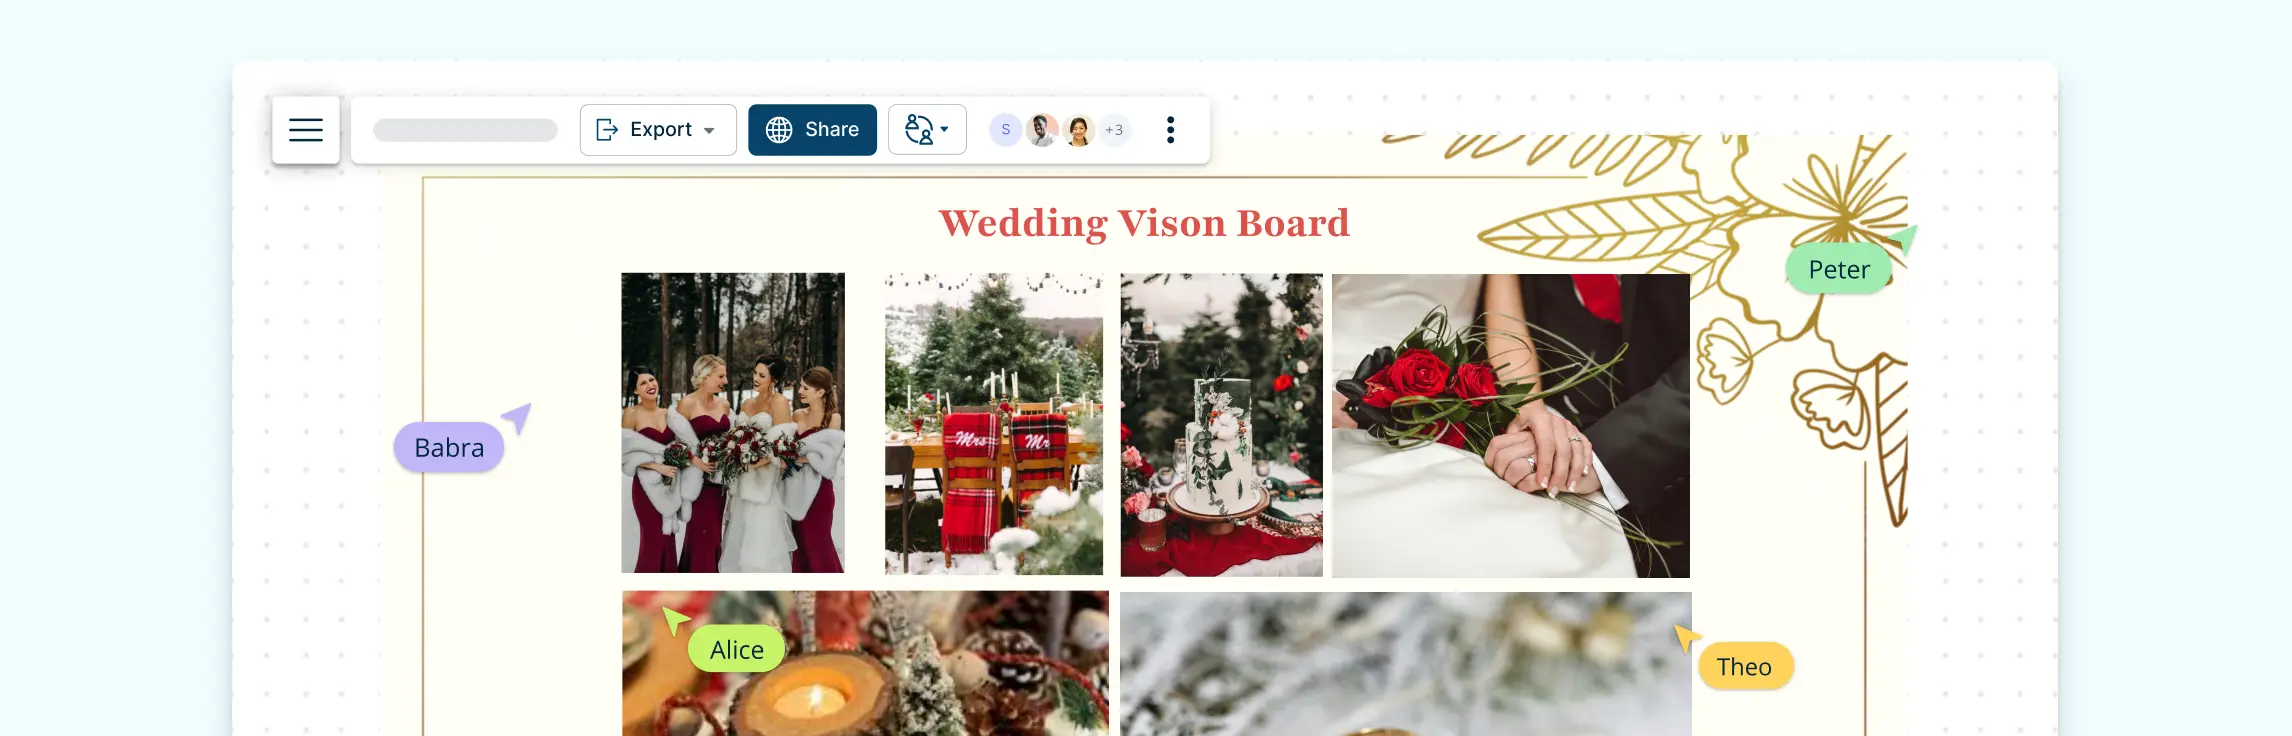
Planning a wedding can be an exciting yet overwhelming experience. However, maintaining organization throughout this process is essential for ensuring a memorable, stress-free event. By utilizing wedding planning templates, you can simplify the intricate details involved, keeping every aspect of your special day on track. Read More
In today’s rapidly evolving business landscape, effective knowledge management (KM) is crucial for driving innovation, improving efficiency, and enhancing decision-making. At the core of a successful KM strategy is the understanding that not all knowledge is the same. Knowledge within an organization can take many forms, from structured data and documented processes to personal expertise and intuitive insights. To harness the full potential of knowledge, organizations must recognize and manage different types of knowledge effectively. Read More
The Knowledge Management process involves capturing, organizing, sharing, and utilizing knowledge within an organization to enhance decision-making, innovation, and efficiency. An effective KM process eliminates silos, reduces redundancies, and fosters collaboration, driving productivity and a culture of continuous learning. A visual collaboration tool like Creately simplifies KM by providing intuitive visual solutions, such as flowcharts and knowledge maps, to capture and share information seamlessly. By making knowledge accessible and actionable, Creately helps organizations transform scattered insights into a cohesive, collaborative resource for improved performance. Read More
A brace map is a powerful visual tool that helps break down complex concepts into smaller, manageable parts. Whether you’re in education, business, or problem-solving, brace maps allow you to clearly understand relationships by visualizing components in a structured way. In this guide, we’ll dive into what a brace map is, how to create one, and how you can use brace maps to organize your thoughts and ideas. Let’s explore how this tool can enhance your workflow with Creately’s versatile platform. Read More
Often, when we make decisions, we need to compare between two options. Visualizing the similarities and differences of the two options can be a better way to make a decision. A double bubble map is a powerful visual tool designed to compare and contrast two ideas, concepts, or items in a structured and engaging way. This versatile tool enhances comprehension, critical thinking, and collaboration. Unlike traditional charts or lists, double bubble maps offer a dynamic framework to organize similarities and differences clearly. In this guide, we’ll explore what a double bubble map is, how it differs from tools like Venn diagrams, practical applications, and step-by-step instructions for creating one using tools like Creately. Read on to discover how this versatile tool can simplify complex topics, enhance decision-making, and become a go-to resource for visualizing comparisons. Read More
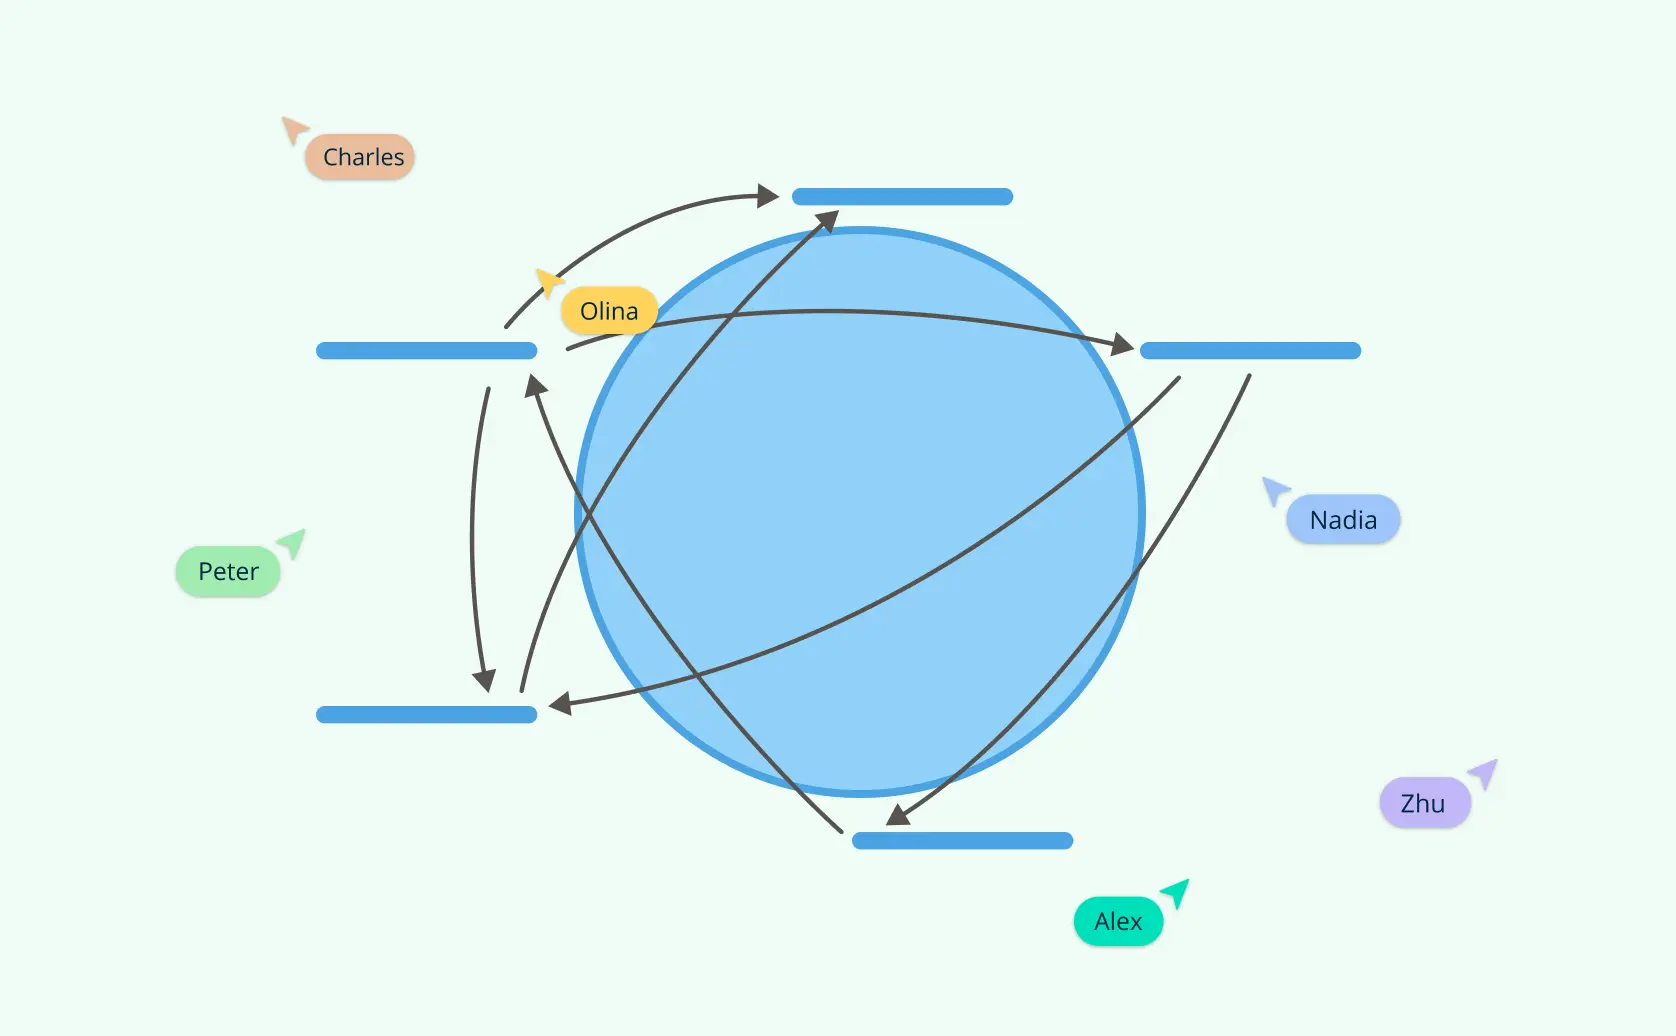
In an increasingly complex world, managing risks and ensuring safety are critical for businesses across all industries. Event Tree Analysis (ETA) is a systematic and powerful method for evaluating the outcomes of initiating events and understanding potential risks by visually mapping possible scenarios and their probabilities. For professionals responsible for risk assessment, safety management, or compliance, mastering Event Tree Analysis is a valuable skill. This guide not only explains the fundamentals of ETA but also shows how tools like Creately make the process efficient and collaborative, ensuring that teams can focus on delivering better safety outcomes. Read More
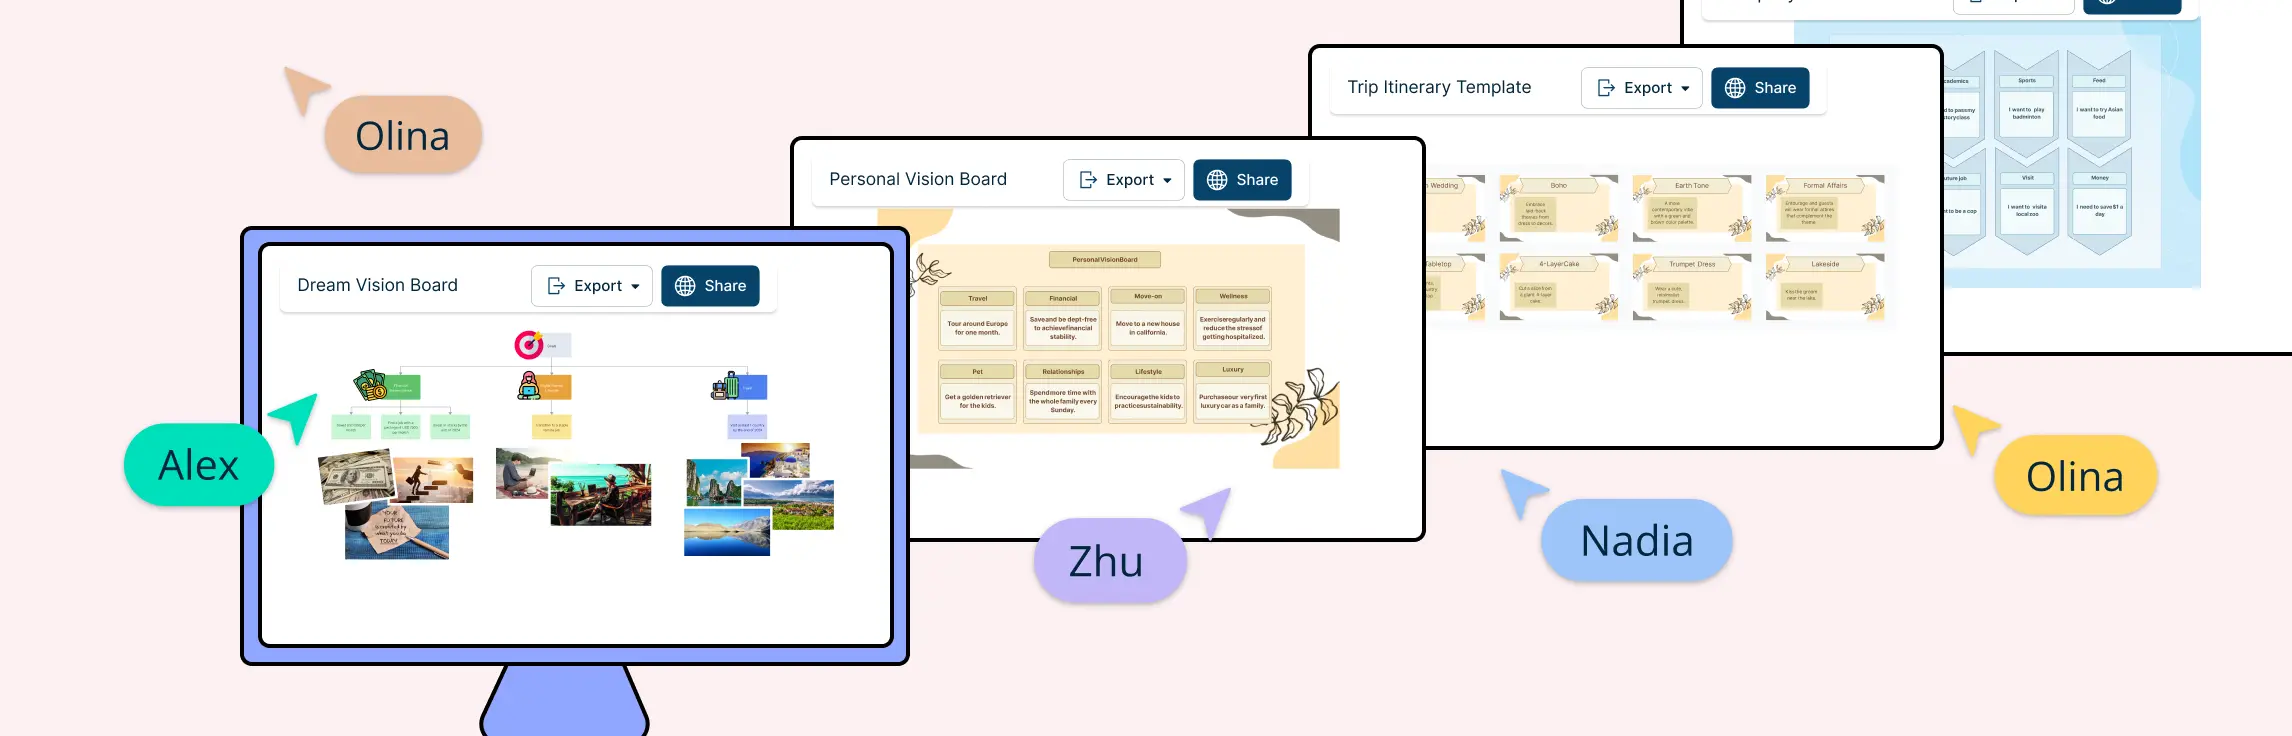
Achieving your dreams requires more than just ambition—it takes clear goals, focused planning, and consistent motivation. Vision boards and goal setting are powerful tools to help you visualize your objectives and stay on track. Whether you’re striving for personal growth, professional success, or team achievements, combining these techniques can unlock your full potential. Read on to discover the transformative power of vision boards and how Creately can make your goal-setting journey seamless and effective. Read More
Knowledge management (KM) is a systematic approach to capturing, organizing, sharing, and analyzing an organization’s knowledge to enhance its overall efficiency and effectiveness. It involves leveraging organizational knowledge as a strategic asset to improve decision-making, collaboration, and innovation. In this comprehensive guide, we delve into the definition, process, examples, strategies, and best practices associated with knowledge management. Read More
In today’s fast-paced business environment, understanding and managing risks is crucial for sustaining success. A risk heat map offers a powerful way to visualize and assess risks, providing a clear overview of their likelihood and impact. This simple yet effective tool helps organizations identify potential threats, prioritize actions, and allocate resources efficiently. Whether you’re navigating operational challenges or preparing for future uncertainties, risk heat maps are an essential component of modern risk management. In this guide, we’ll explore what risk heat maps are, why they matter, and how to create and use them effectively. Read More
A new year brings new opportunities, and the key to making the most of 2026 lies in effective planning. A well-organized planner for 2026 not only helps you manage your time but also ensures you stay focused on your goals, whether personal or professional. From daily schedules to long-term objectives, having a clear roadmap can significantly enhance your productivity and peace of mind. Read More
Mural has established itself as a go-to platform for teams looking to collaborate visually through whiteboards, brainstorming sessions, and design thinking workshops. Its intuitive interface and real-time collaboration features make it a favorite for creative and agile teams. However, like any tool, Mural has its limitations—whether it’s the lack of certain advanced features, challenges with scalability for larger organizations, or pricing concerns. Read More
When it comes to managing workflows and fostering collaboration, ClickUp has earned a reputation as a versatile tool. However, not every team’s needs are the same. Whether you’re looking for a more intuitive diagramming platform, a specialized tool for brainstorming, or a simpler solution for visual collaboration, there are plenty of alternatives to consider. Read More
SmartDraw is a widely used diagramming tool known for its ease of use and powerful diagramming capabilities. However, it may not be the perfect fit for every user, especially those looking for more specialized features, flexible pricing, or specific integration options. If you’re considering switching from SmartDraw or looking for alternatives that provide a more tailored experience, this list will help guide your decision. Read More
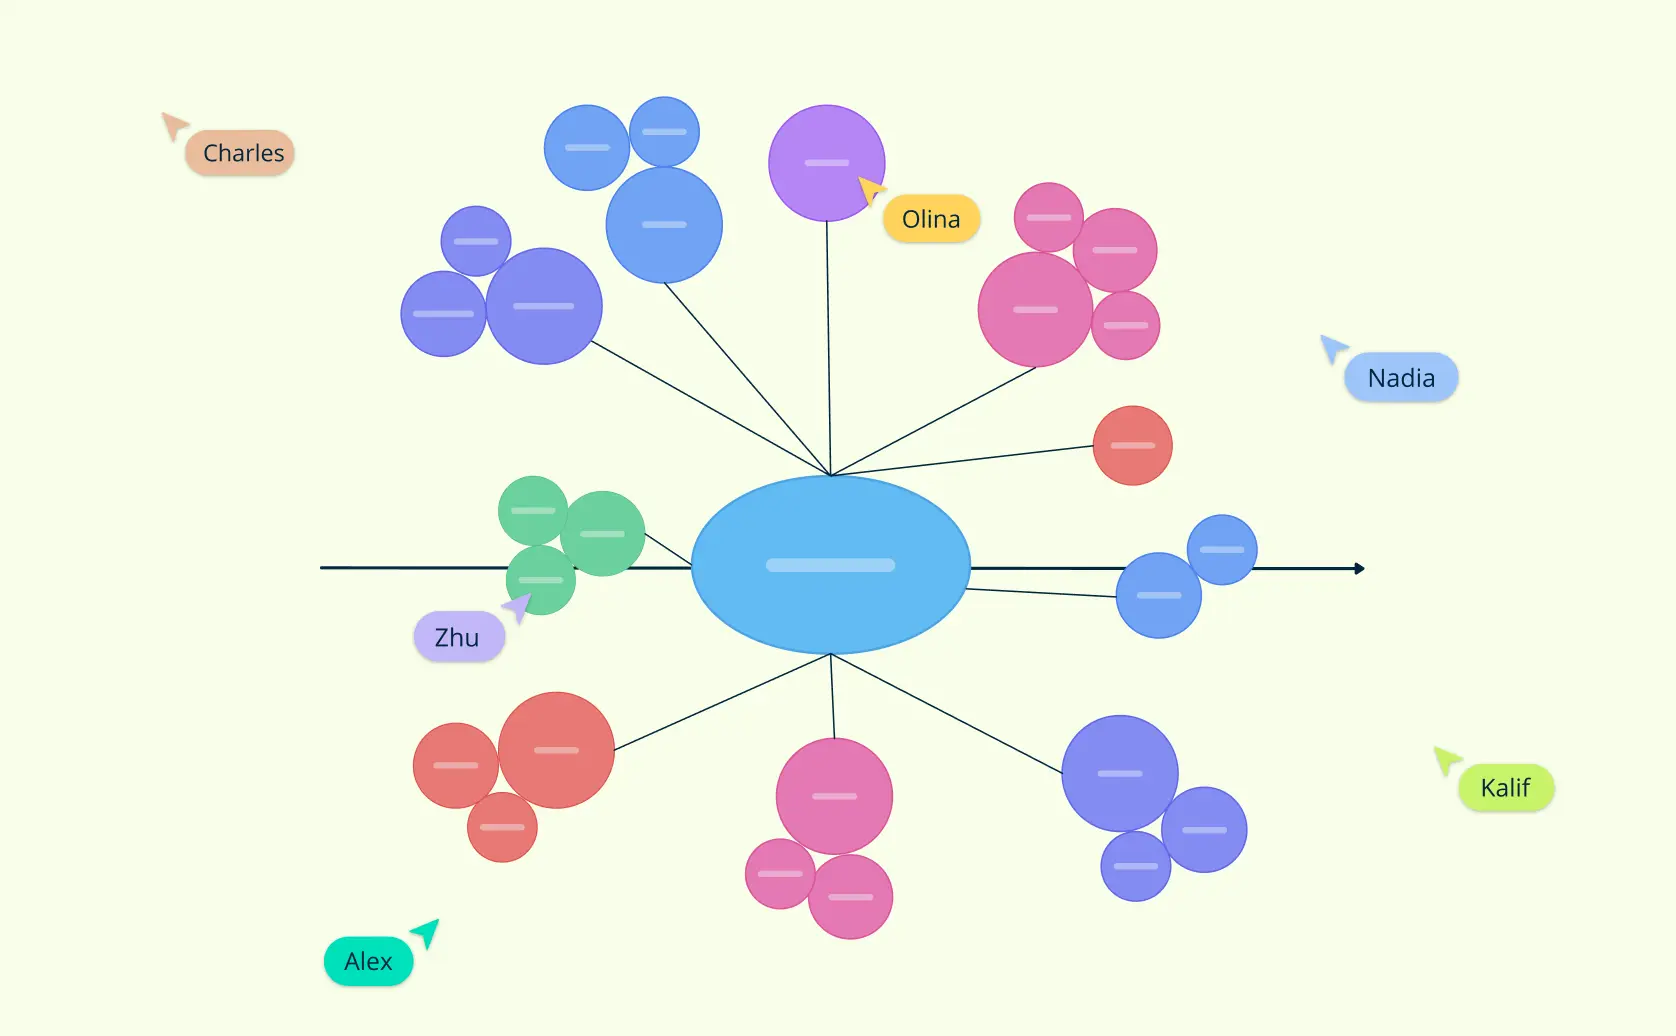
Studying effectively is a challenge many students face, especially when dealing with large volumes of information. A mind map for studying offers a powerful solution by turning complex concepts into visually organized diagrams. This technique not only enhances understanding but also improves memory retention and encourages creative thinking. Whether you’re preparing for exams, brainstorming essay ideas, or grasping intricate theories, mind mapping can transform your study routine. In this guide, we’ll explore what a mind map for studying is, its benefits, and how to create one step-by-step. Plus, you’ll discover practical templates and tools to integrate mind mapping into your academic journey. Read More
The stock and flow diagram is a powerful tool used in system dynamics to visualize and analyze complex systems. These diagrams help us understand how different elements within a system interact over time, making them invaluable in various fields, including business, economics, and environmental science. This guide will delve into the intricacies of stock and flow diagrams, their applications, how to create them, and provide templates to assist you in your modeling endeavors. Read More
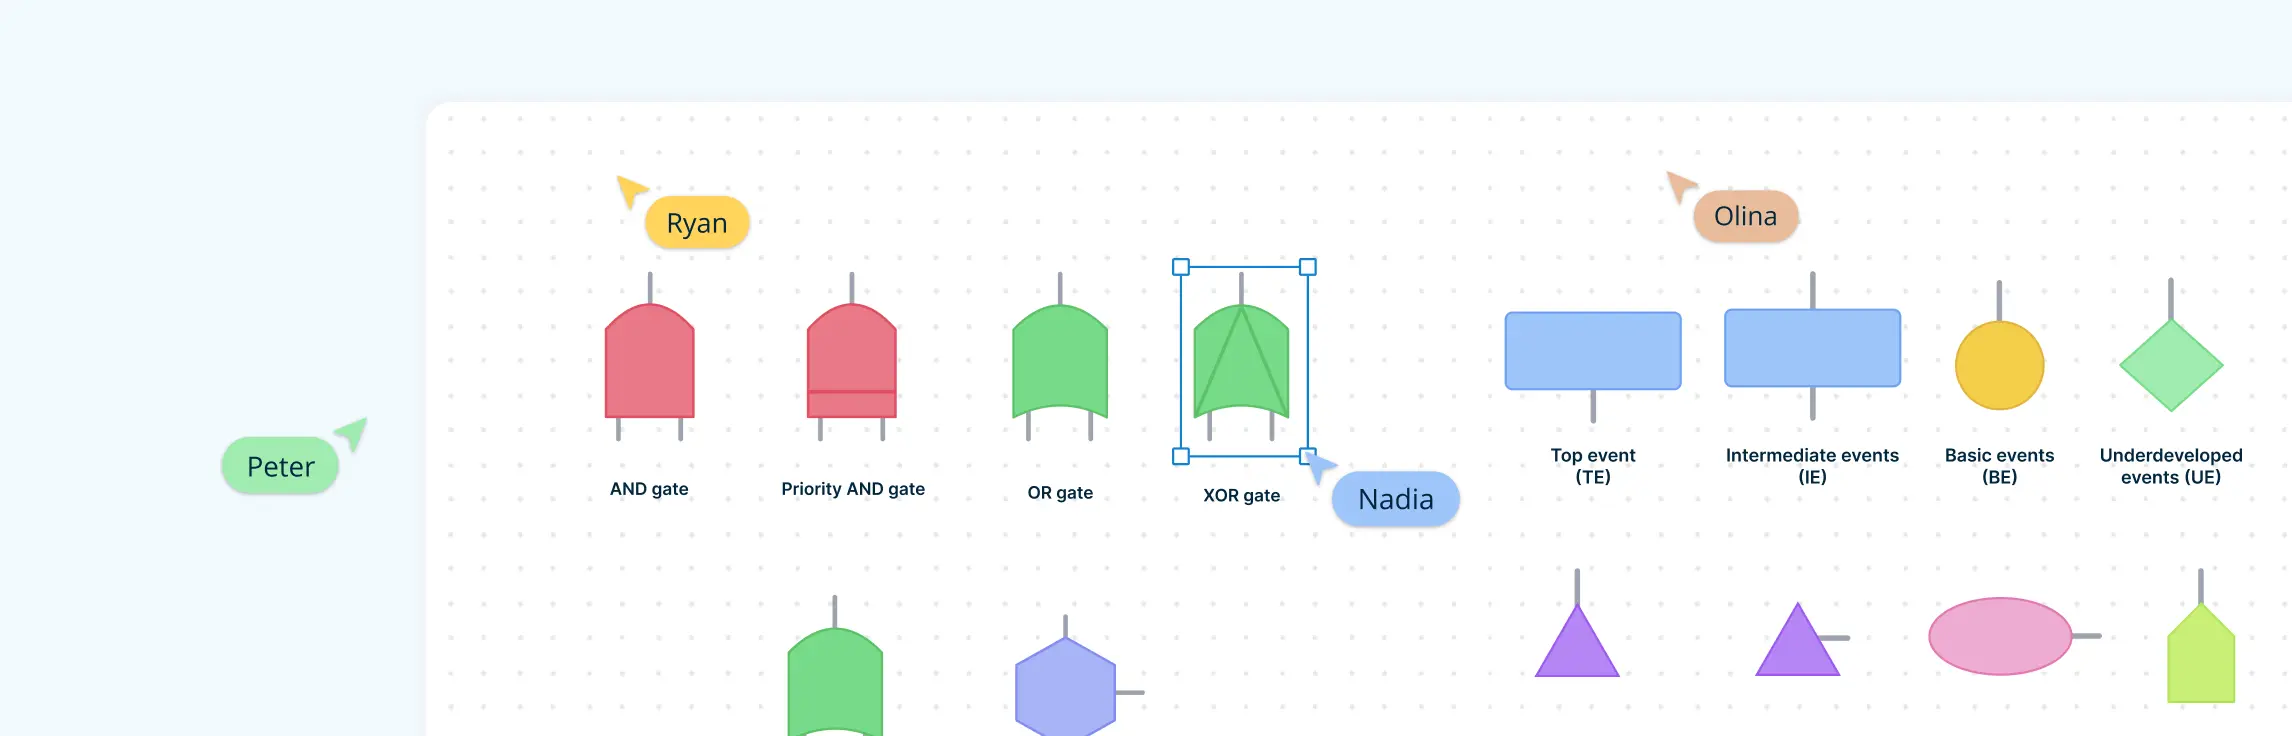
Fault Tree Analysis (FTA) stands as a pivotal methodology in assessing and mitigating risks across industries, from aerospace to software engineering. Being a top-down, deductive technique, Fault Tree Analysis (FTA) dissects a system’s pathways to locate potential flaws, ensuring the probability of failure remains manageable. At the helm of this analytical process are fault tree analysis symbols, fundamental tools that unravel complex failure paths into understandable and actionable insights. Read More
An Excel org chart is a visual representation of an organization’s structure created using Microsoft Excel. It outlines the relationships between different roles, departments, and individuals within a company. In this guide, we’ll show you how to make an org chart in Excel and explore the benefits of using Creately, a tool designed to overcome the challenges Excel presents. Read More
In today’s competitive landscape, achieving seamless supply chain operations hinges on effective supply chain mapping. This strategic practice involves visualizing and tracking the movement of goods, information, and finances across the entire supply network. Supply chain mapping not only provides a visual overview but also plays a pivotal role in understanding key operational elements, enabling businesses to identify risks and manage them proactively. This guide will walk you through the process of supply chain mapping. Read More
Process mapping symbols are the visual building blocks used to map how work gets done. From simple tasks and decisions to complex workflows, the process map shapes help teams turn scattered steps into clear, easy-to-follow diagrams. In this guide, we’ll explore the most common process icons, what they mean, and how to use them effectively. Read More
In today’s competitive business landscape, understanding the inner workings of your organization is essential. Business process mapping offers a powerful way to visualize, analyze, and improve every step in your organization’s workflows. From enhancing operational efficiency to ensuring compliance and improving communication, business process mapping provides a strategic advantage for businesses aiming to stay agile and productive. This guide covers the key benefits of business process mapping, showcases its versatility across industries, and demonstrates how Creately can amplify these benefits to take your business processes to the next level. Read More
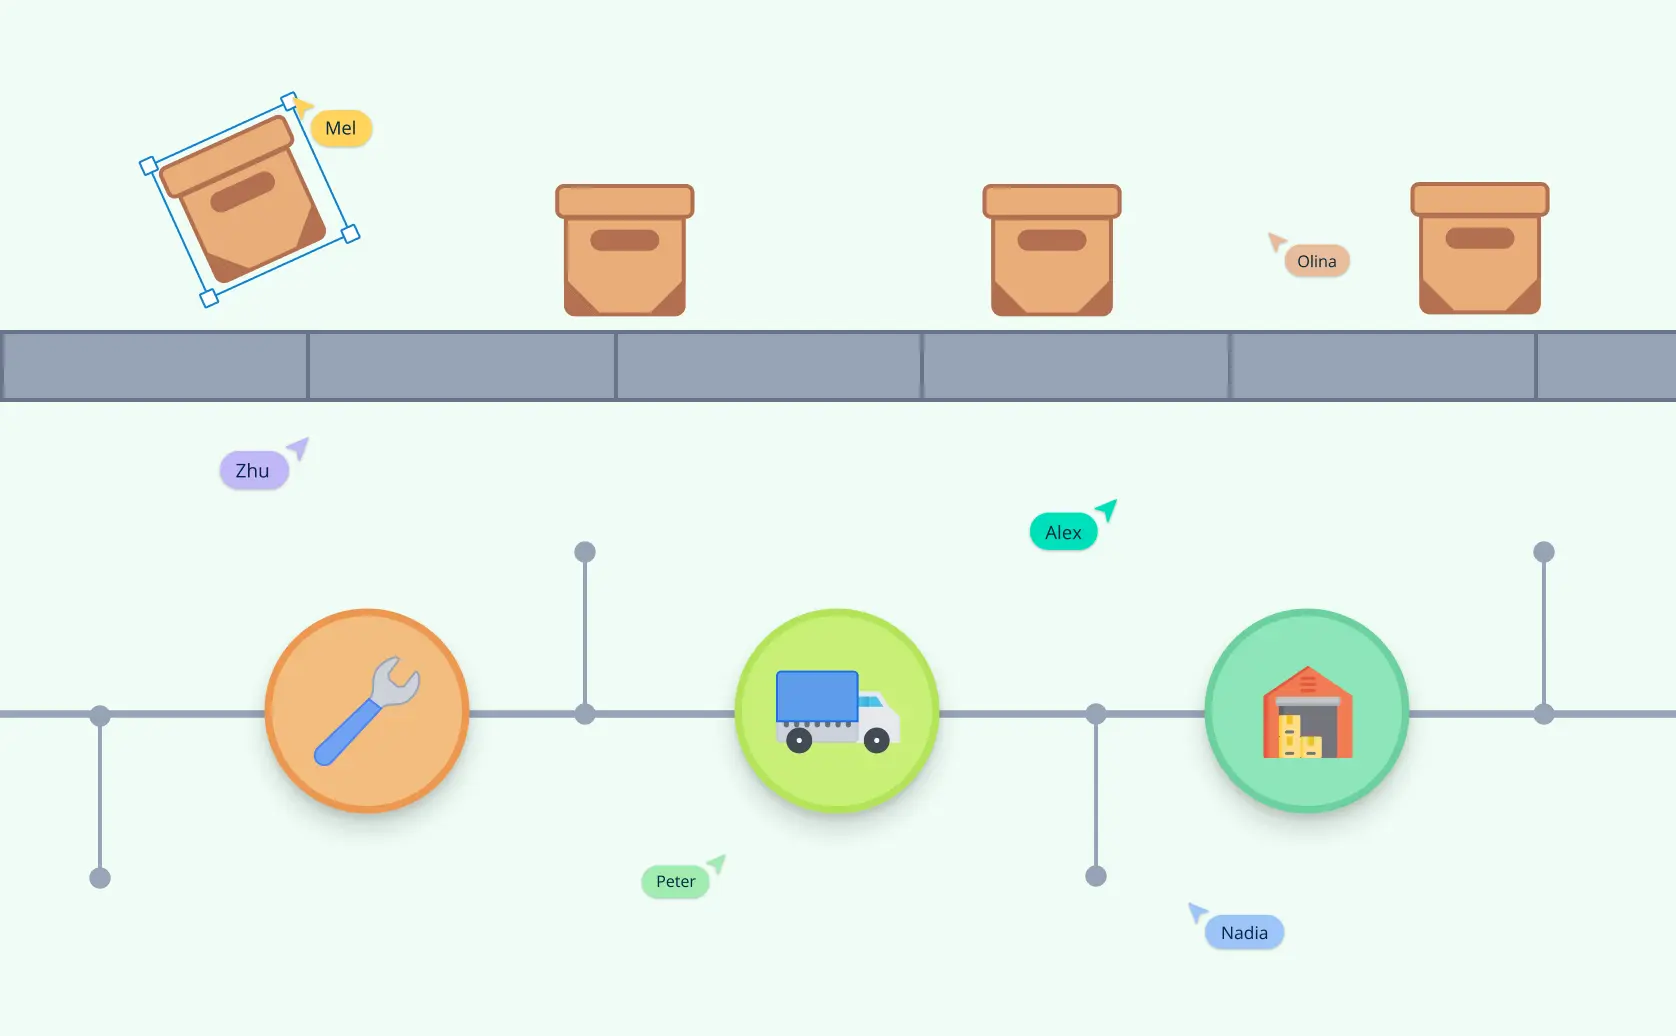
In the world of logistics, where countless moving parts come together to move goods from point A to point B, clarity is crucial. Logistics process mapping is a pivotal tool that offers this clarity, helping companies visualize and refine their supply chain operations. By breaking down complex processes into digestible, visual steps, logistics teams can pinpoint bottlenecks, improve efficiency, and enhance communication across departments. In this guide, we’ll explore how logistics process mapping works, the types of diagrams that can be used, and how each one brings unique insights to logistics management. Read More
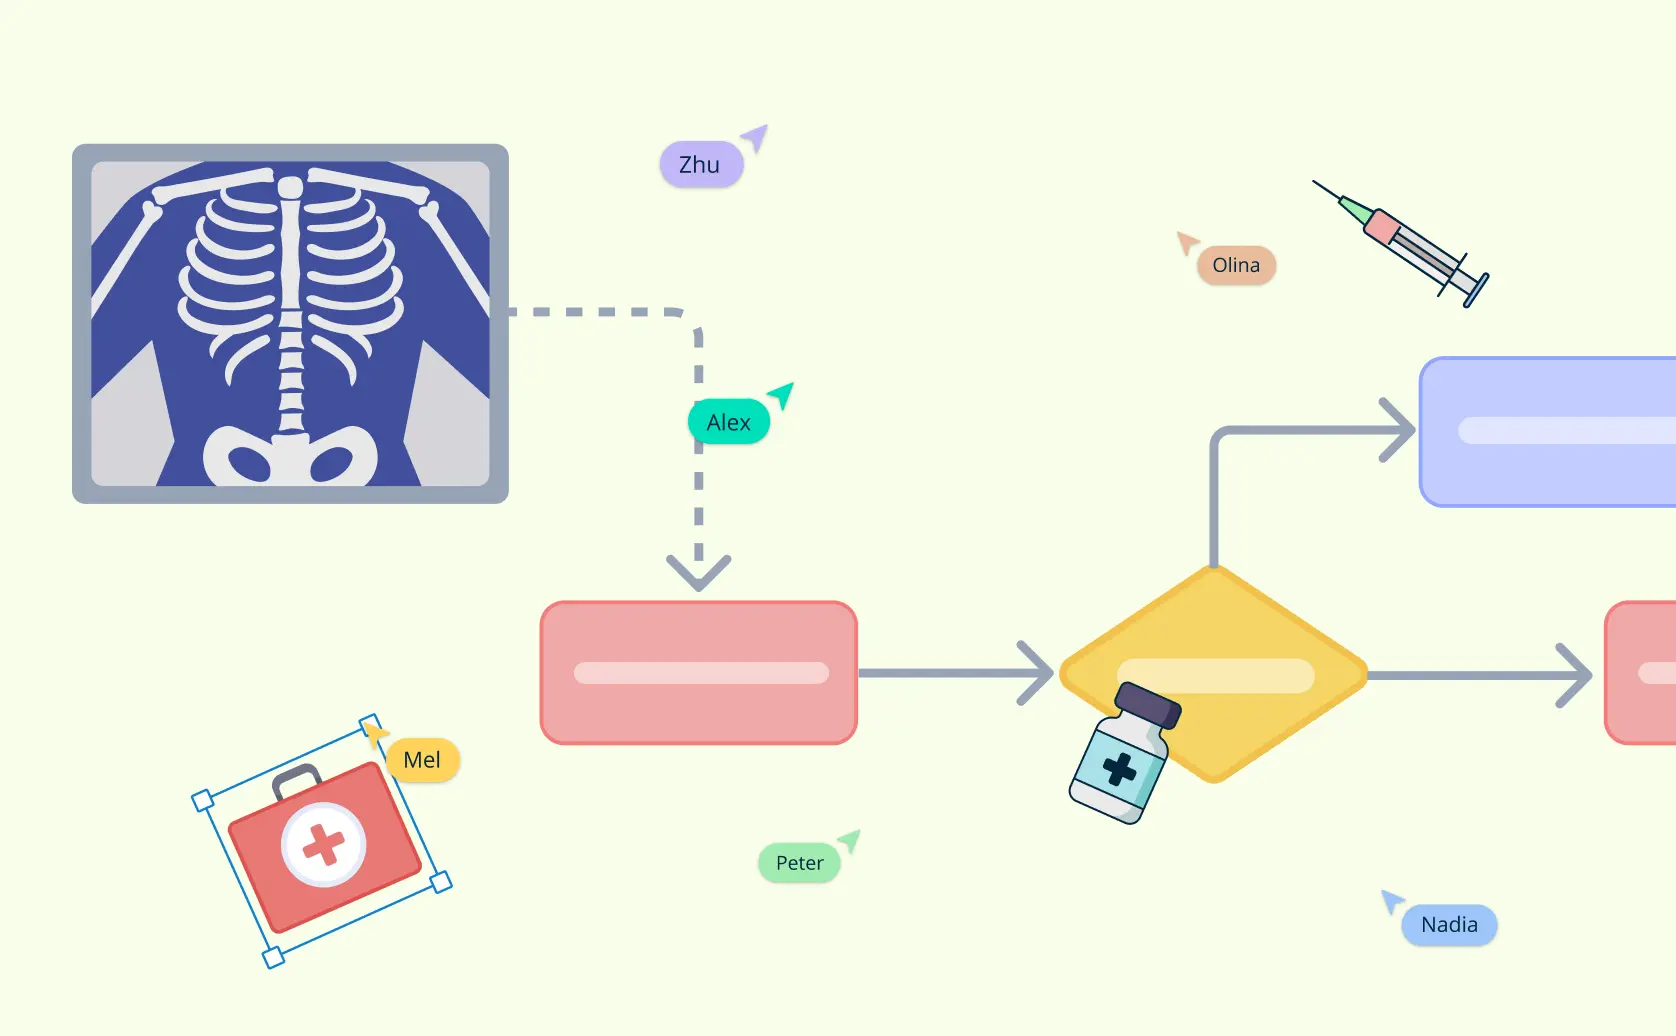
In the complex world of healthcare, effective communication and streamlined processes are essential for delivering high-quality patient care. Process mapping serves as a powerful tool that allows healthcare professionals to visualize workflows, identify inefficiencies, and enhance collaboration among teams. This guide aims to provide a comprehensive overview of process mapping in healthcare, exploring its benefits, step-by-step creation techniques, various types of process maps, and best practices for success. Whether you’re looking to improve patient journeys, track clinical pathways, or eliminate waste in your operations, this guide will equip you with the knowledge and tools necessary to foster efficiency and quality in your healthcare organization. Read More
Understanding the relationships among actors within a system is fundamental to systems thinking, and actor mapping offers a powerful way to visualize these complex connections. By creating an actor map, systems thinkers can identify influential players, examine their roles and interactions, and reveal the dynamics shaping outcomes within the system. This guide will introduce the essentials of actor mapping and its core elements. It will also provide guidance on building an effective map using various templates. We’ll also explore the benefits, limitations, and common pitfalls to avoid, equipping you with the tools to deepen your understanding of systemic interactions and enhance overall system performance. Read More
In today’s complex world, understanding relationships within systems—whether in social cause, storytelling, education, or operations—is vital. Connection Circles are powerful tools for visualizing these relationships, helping to reveal the underlying cause-and-effect dynamics and feedback loops. By mapping out these interactions, connection circles provide a clearer picture of how different elements influence each other, making it easier to navigate complexity and make informed decisions. This guide will explore connection circles and their applications. Read More
In today’s fast-paced business environment, effective logistics optimization is essential for organizations striving to enhance their operational efficiency and maintain a competitive edge. This guide aims to explore the concept of logistics optimization and provide practical insights for implementing it in your business. We will begin by exploring what logistics optimization entails delving into the numerous benefits that effective logistics optimization can offer. Next, we will outline the critical stages of logistics optimization, providing a structured approach to streamline your processes. Finally, we will introduce seven essential diagrams designed to facilitate effective logistics optimization, enabling you to visualize and implement strategies that unlock efficiency within your supply chain. Whether you are a logistics professional or a business leader, this guide will equip you with the knowledge and tools necessary to enhance your logistics operations and drive success. Read More
In today’s rapidly evolving business landscape, the ability to effectively manage and optimize supply chains has become more critical than ever. Supply Chain Visualization offers organizations a powerful means of transforming complex data into clear, actionable insights. By creating visual representations of supply chain processes, businesses can enhance their understanding of how products flow from suppliers to customers, identify potential bottlenecks, and make informed decisions that drive efficiency. This guide explores the fundamentals of supply chain visualization, delving into its significance and various applications, and providing a roadmap for organizations seeking to improve their operational effectiveness and responsiveness in an increasingly competitive market. Read More
In the current dynamic business environment, organizations face a myriad of challenges that demand effective decision-making. One powerful methodology for pinpointing discrepancies between existing operations and desired outcomes is fit gap analysis This guide explores the fundamentals of fit gap analysis, highlighting its significance, outlining the process involved, and demonstrating how it can propel organizational success. Read More
Effective project management requires clarity, especially when it comes to assigning roles and responsibilities. This is where the RACI Matrix comes into play. As a simple, yet powerful tool, the RACI Matrix helps project managers and teams define, organize, and communicate responsibilities for each team member, ensuring smoother project execution. Read More
In today’s competitive business environment, maximizing efficiency while minimizing waste is more important than ever. This is where the 5S methodology comes into play. Rooted in the principles of lean manufacturing, the 5S methodology provides a clear and practical framework for organizing workspaces, improving productivity, and ensuring safety. Whether you run a manufacturing plant, a healthcare facility, or an office, the 5S methodology can transform your work environment for the better. Read More
In today’s dynamic business environment, fostering a culture of continuous improvement is essential for long-term success. The Kaizen methodology, with its roots in Japanese philosophy, emphasizes the power of small, incremental changes that drive significant improvements over time. Unlike traditional approaches that focus on large-scale transformations, Kaizen promotes steady, ongoing enhancements that build momentum gradually. Read More
In today’s fast-paced world, understanding the complexity of systems—whether in business, project management, or other—can make all the difference in decision-making. That’s where Causal Loop Diagrams (CLDs) come into play. These diagrams are powerful tools for illustrating how variables within a system interrelate through feedback loops, offering a holistic view of the intricate web of cause-and-effect relationships. This guide will walk you through everything you need to know about CLDs: how to create them, real-world applications, things to consider, and their benefits. Read More
In a world where customer expectations are constantly evolving, businesses must understand the nuances of user interactions. This is where experience mapping comes into play. By visualizing and analyzing each stage of the user journey, organizations can gain valuable insights into customer needs, pain points, and opportunities for improvement. The result? Enhanced customer experiences that drive satisfaction, loyalty, and business growth. Read More
In a world teeming with ideas and information, organizing thoughts can often be a herculean task. Enter the Idea Wheel - a versatile graphic organizer designed to simplify the brainstorming process. By presenting ideas in a visually segmented manner, the Idea Wheel combines the essence of both spider maps and circle maps, fostering creativity and structured thinking. Read More
Effective thinking is more important than ever in today’s complex world. Whether you’re navigating personal challenges or tackling professional projects, harnessing the right thinking tools can enhance your cognitive processes, streamline decision-making, and foster creativity. This article delves deep into various thinking tools, their categories, and how you can leverage them using visual collaboration platforms like Creately. Read More
The evolving world of marketing needs personalized and targeted strategies to stay ahead of the competition. STP marketing is a highly effective framework that can help marketers segment their market, target specific customer groups, and position their products or services more effectively. Read More
In an increasingly digital world, a well-structured content calendar is essential for effective marketing. By efficiently planning and organizing content, you can streamline your content strategy, enhance team collaboration, and significantly improve your overall marketing efforts. This guide will walk you through everything you need to know about creating an effective content calendar. Read More
Flowcharts are the go-to tool for process mapping. Whether you are working on a new workflow or solving a problem, flowchart symbols make it easy to visualize steps, decision points, and paths. However, to create a flowchart that clearly communicates your process, you need to know the right flowchart symbols and their usage. This guide will walk you through everything you need to know about flowchart symbols, their meanings, best practices, and common mistakes. Understanding flowchart symbols ensures that your diagrams are effective, structured, and universally understood. Read More
Most HR leaders share a common frustration: having plenty of data on how employees are performing today, but zero clarity on who is actually ready to lead tomorrow. The 9 box grid solves this by mapping performance against potential. In this guide, we will break down exactly how this talent management tool works, define every category in the 9-box model, and provide a step-by-step framework to build your own succession planning roadmap. Read More
Educators are constantly on the lookout for practical tools that boost student engagement and deepen learning. One such time-tested strategy is the KWL chart—a three-column graphic organizer that turns passive listening into active learning. Read More
Free Nursing Concept Map Templates for Diagnosis and Care Planning Nursing school and clinical practice both involve sorting through a large amount of patient information fast. A nursing concept map helps turn scattered notes into a visual care-planning tool that shows how symptoms, diagnoses, interventions, and outcomes connect. Read More
Medical genograms are visual tools that map a family’s health history across generations, helping identify inherited conditions and patterns. By using accurate medical genogram symbols, these diagrams go beyond traditional family trees to reveal genetic, emotional, and psychological health links. Whether you’re building a health history genogram or exploring medical genogram examples, they are essential for preventive care, genetic counseling, and understanding long-term health risks. Medical genograms are commonly used in healthcare, counseling, and genetic research to support early diagnosis, personalized treatment, and preventive care strategies. Read More
To create a concept map, start with one clear focus topic, add the most important related concepts, and connect them with labeled links that explain how the ideas relate. The strongest concept maps are easy to scan, move from broad ideas to specific details, and include cross-links where ideas overlap. This guide walks through the full process and shows how to make the result easier to refine and share. Read More
Designing complex software systems can be daunting without a clear blueprint. UML Structural Diagrams provide a visual roadmap, helping developers, architects, and teams understand system architecture, components, and their relationships at a glance. In this guide, we’ll explore what structural diagrams are, why they matter, the main types, and real-world examples to make your modeling easier and more effective. Read More