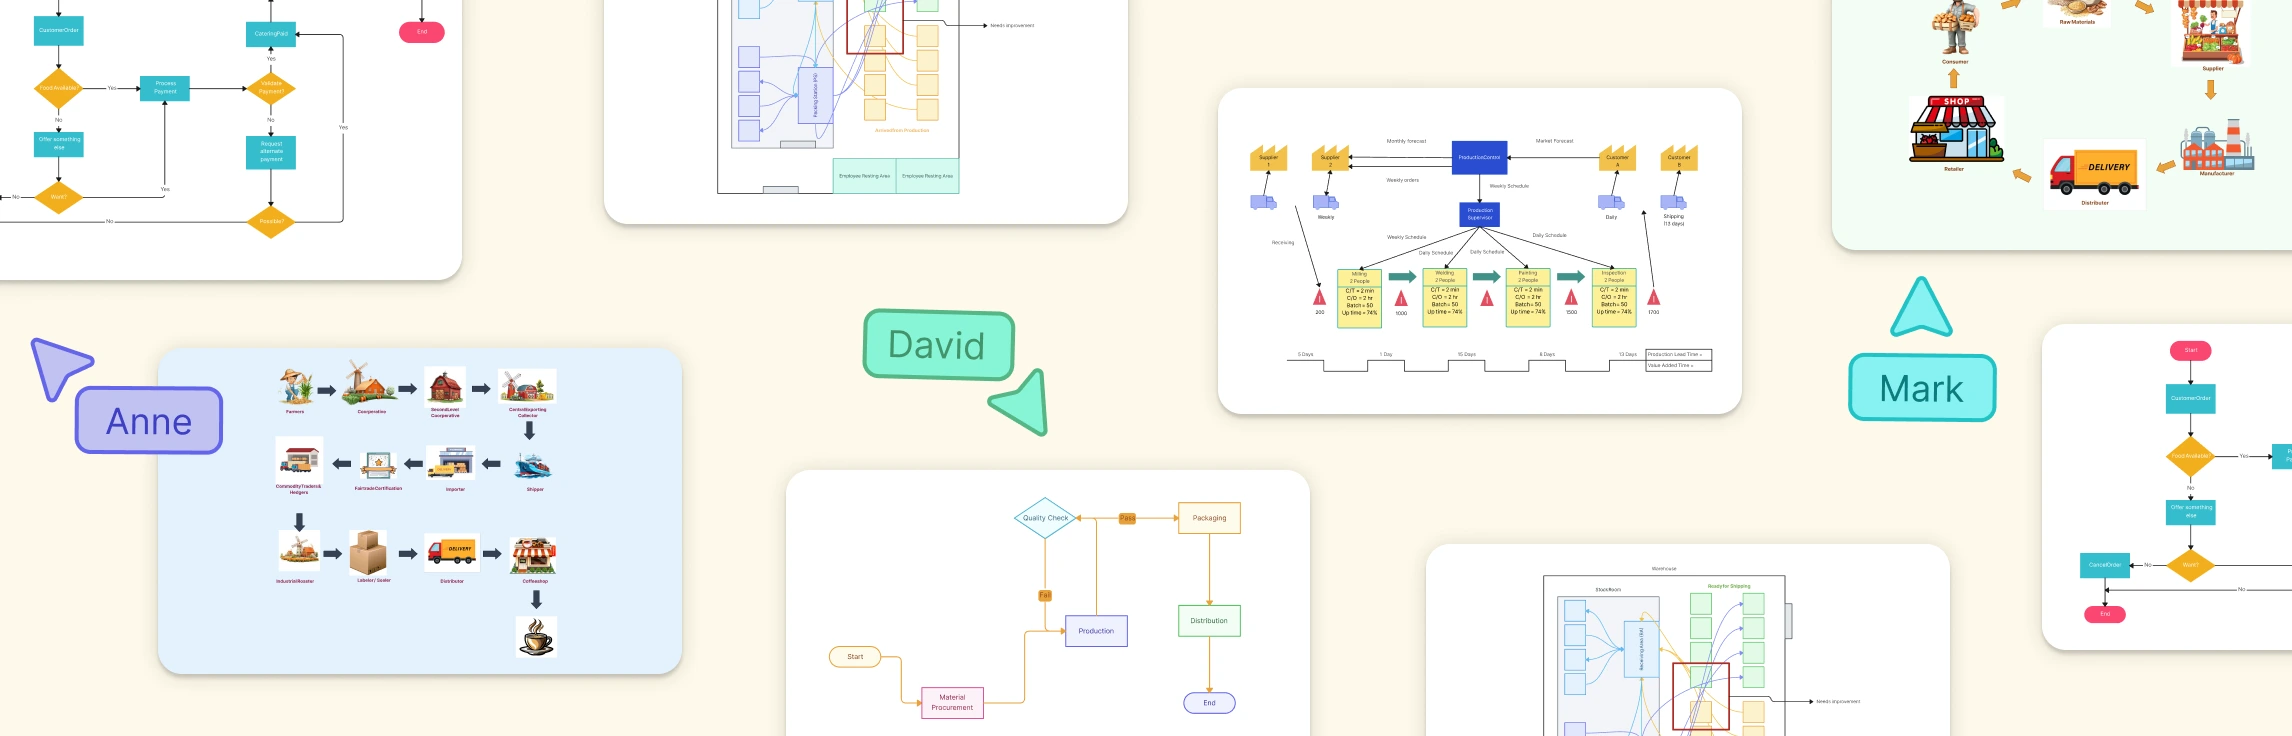
Supply chain diagram examples show how materials, information, money, and responsibilities move from suppliers to end customers. They help teams understand complex networks, clarify handoffs, and choose the right level of detail for planning or improvement. The eight examples below cover end-to-end supply chains, value streams, production workflows, order fulfillment, and physical movement through a facility.
Supply chain mapping documents how goods, information, money, and responsibilities move across a supply network. It helps teams understand suppliers and dependencies, investigate operational risks, and coordinate improvement work. This guide explains what to include in a supply chain map, how to build one, and how to keep it useful as the network changes.
In today’s fast-paced business environment, effective logistics optimization is essential for organizations striving to enhance their operational efficiency and maintain a competitive edge. This guide aims to explore the concept of logistics optimization and provide practical insights for implementing it in your business. We will begin by exploring what logistics optimization entails delving into the numerous benefits that effective logistics optimization can offer. Next, we will outline the critical stages of logistics optimization, providing a structured approach to streamline your processes. Finally, we will introduce seven essential diagrams designed to facilitate effective logistics optimization, enabling you to visualize and implement strategies that unlock efficiency within your supply chain. Whether you are a logistics professional or a business leader, this guide will equip you with the knowledge and tools necessary to enhance your logistics operations and drive success.
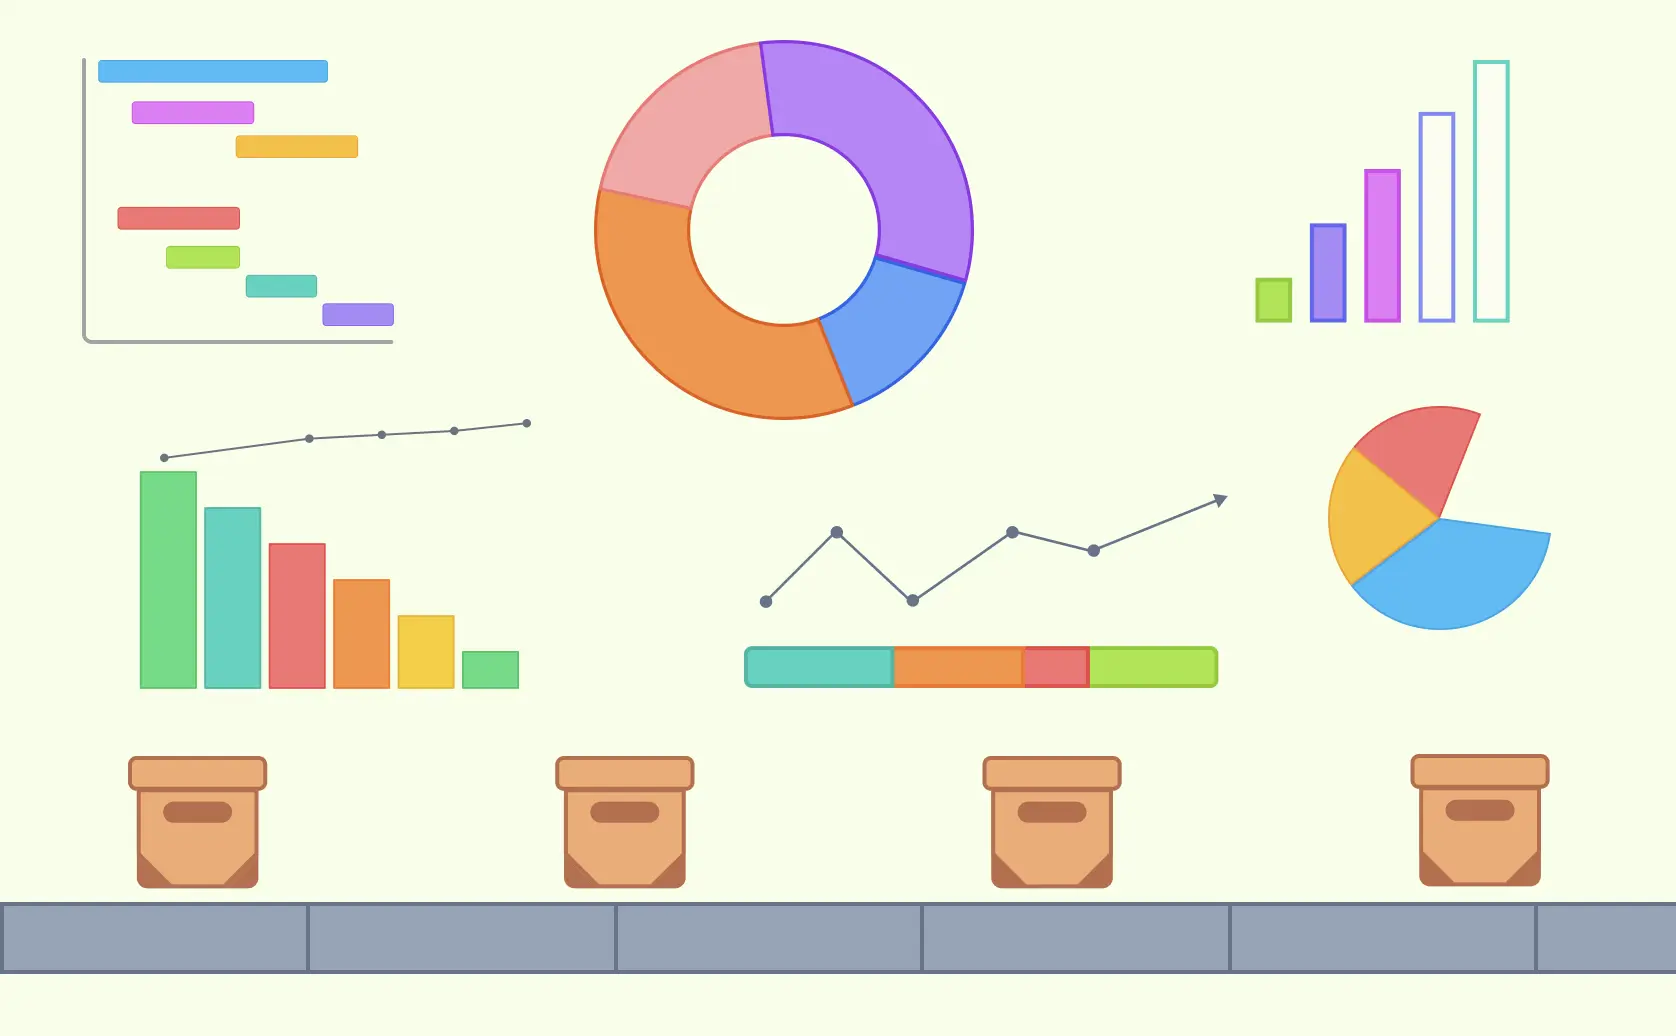
Supply chain visualization uses diagrams, maps, charts, and dashboards to make complex networks easier to understand. These visuals can show how products, information, money, and responsibilities move from suppliers through production and distribution to customers. When they are based on reliable operational data, they help teams investigate bottlenecks, dependencies, risks, and performance trends. This guide explains the main visualization techniques, what each one is suited to, and how teams can use them to support supply chain decisions.