Supply chain diagram examples show how materials, information, money, and responsibilities move from suppliers to end customers. They help teams understand complex networks, clarify handoffs, and choose the right level of detail for planning or improvement. The eight examples below cover end-to-end supply chains, value streams, production workflows, order fulfillment, and physical movement through a facility.
1. Supply Chain Management Template
This supply chain management template provides a high-level view of the participants, systems, and flows that connect sourcing with fulfillment. It is useful for businesses that need to understand digital sales channels, direct-to-consumer (DTC) operations, and the dependencies between commercial and logistics teams.
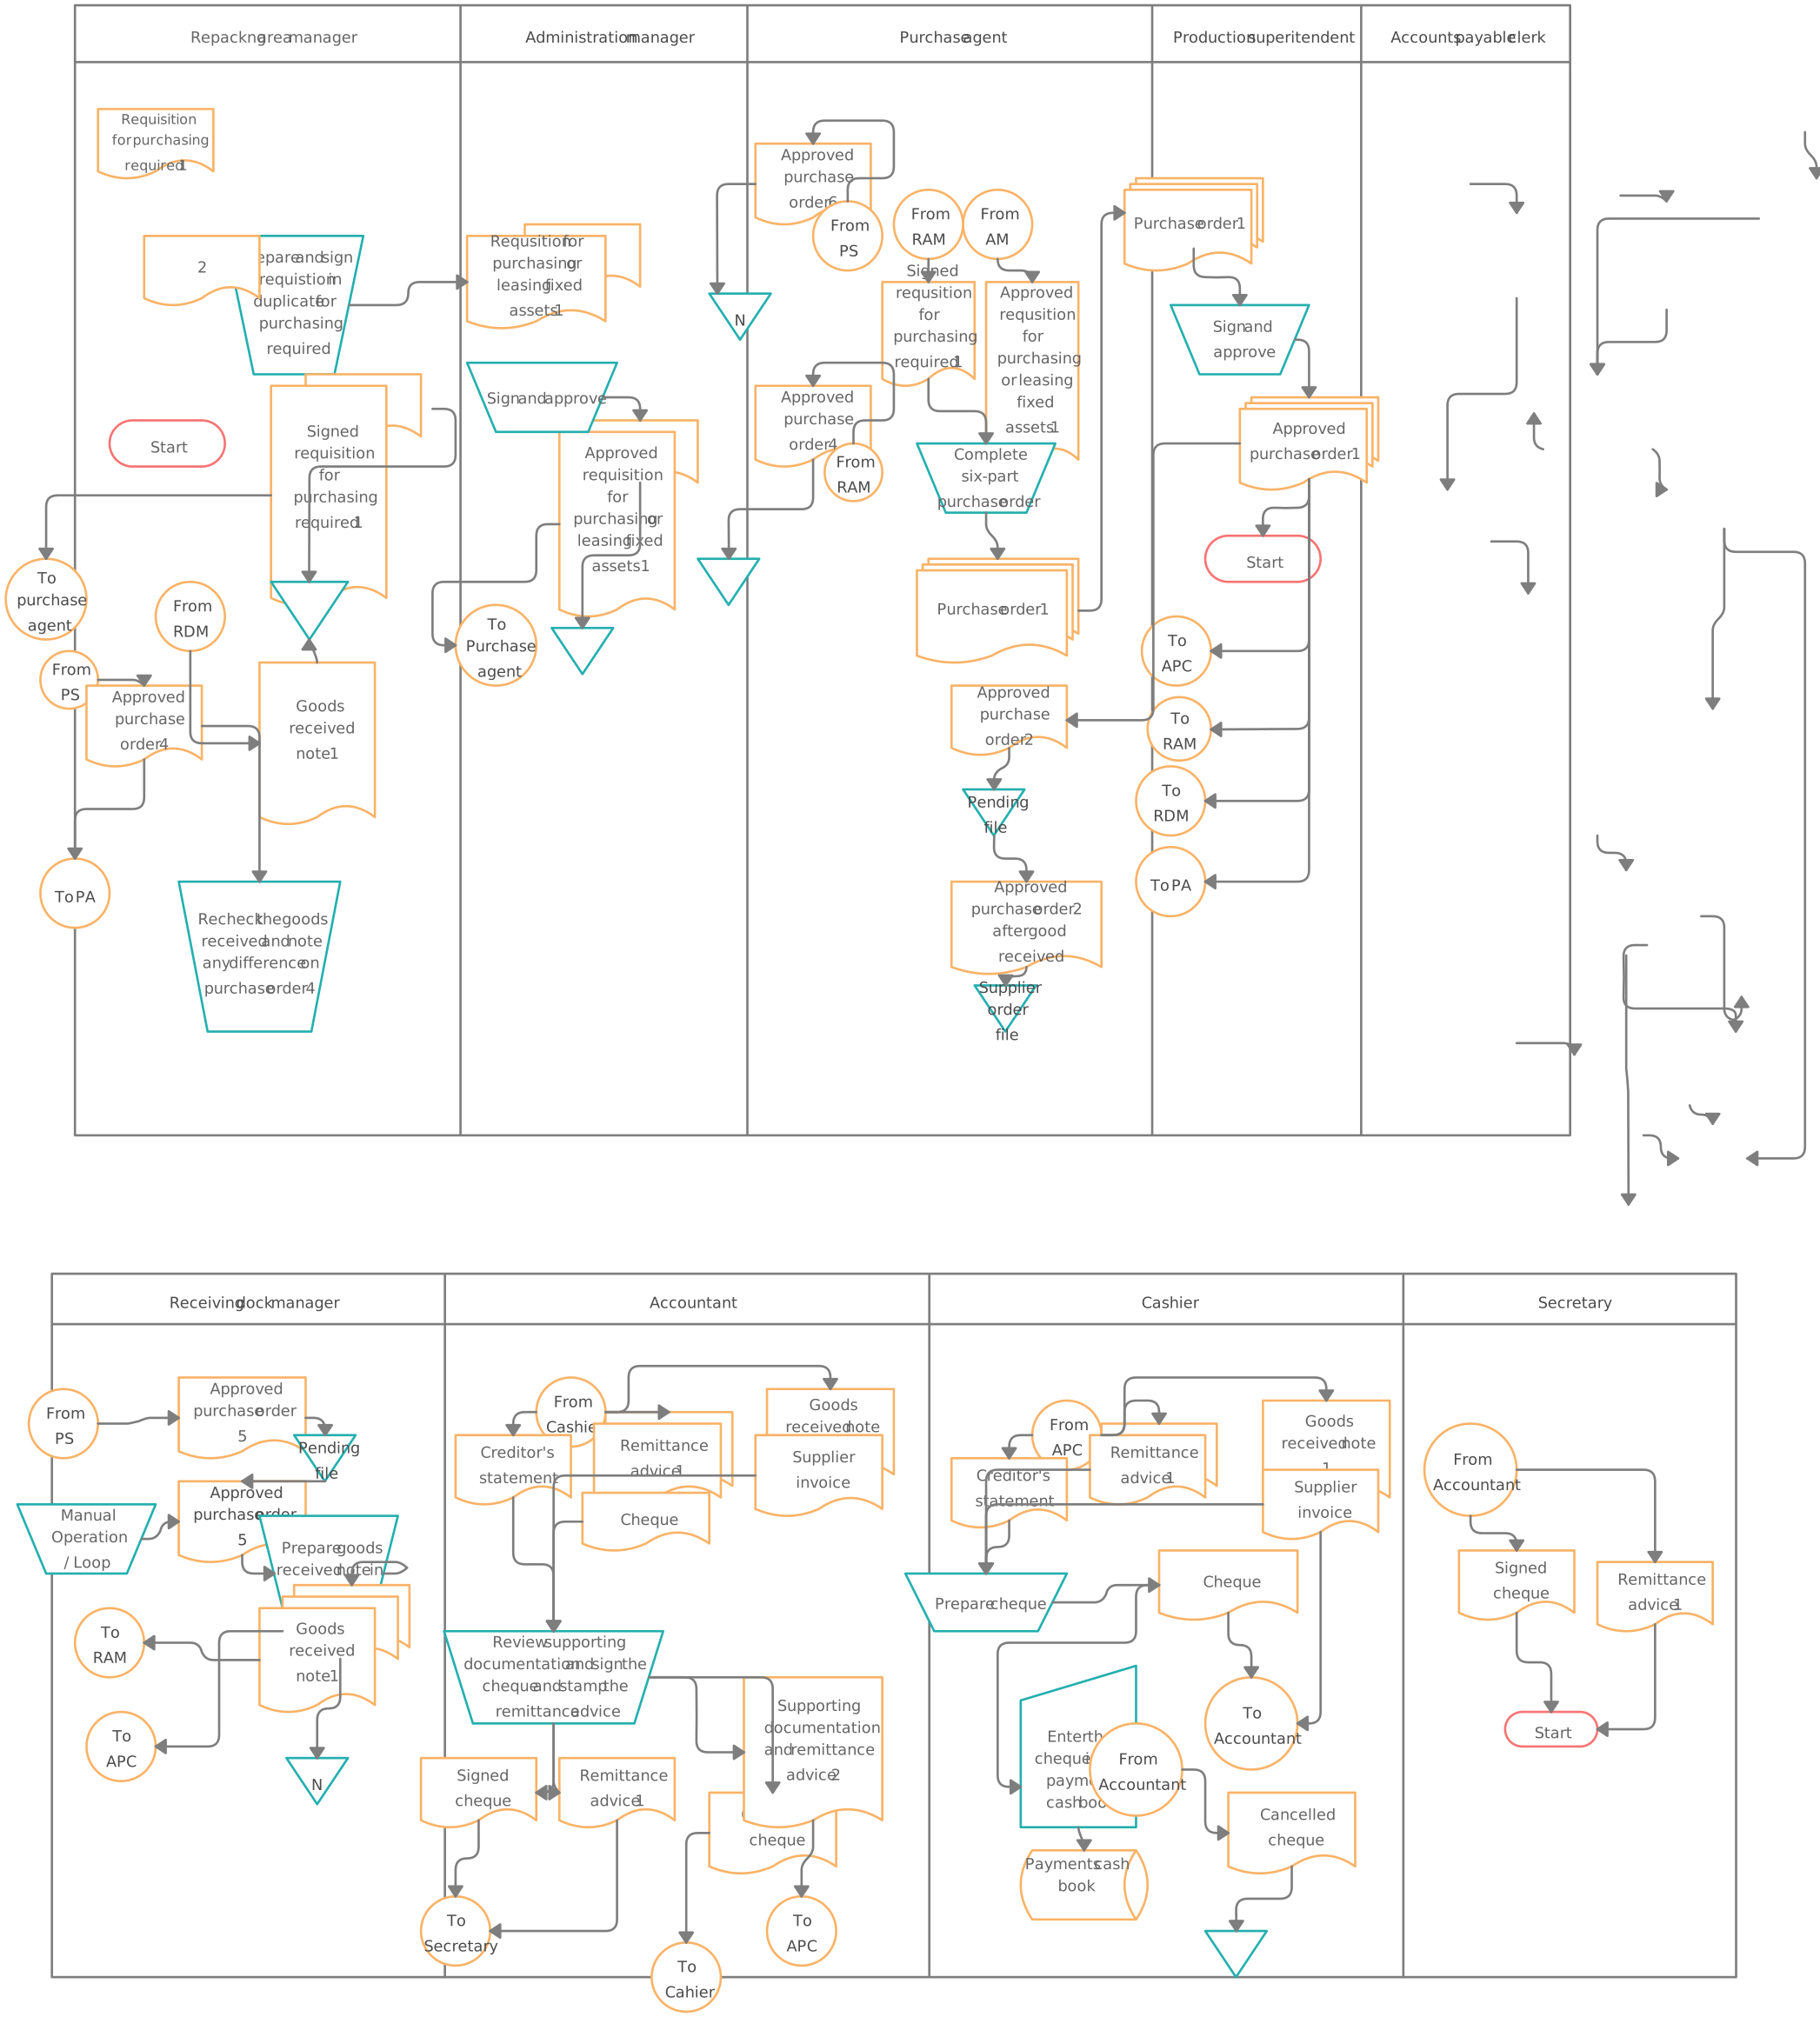

- What it shows: A circular or hybrid model that connects e-commerce platforms, warehousing, distribution, and customer feedback. The map makes information flows visible alongside the physical movement of goods instead of presenting the supply chain as a strictly linear sequence.
- Practical use:
- Agile Pivoting: Quickly visualize how a change in a digital sales channel (like a social commerce spike) impacts your inventory orders.
- Tech Integration: Map out where your ERP, WMS, and AI-demand forecasting tools sit within the physical movement of goods.
- Quick customization checklist:
- Digital Touchpoints: Add icons for your tech stack (e.g., Shopify, NetSuite, or 3PL APIs).
- Feedback Loops: Use dashed lines to show how customer reviews or return data flow back to product design.
- Sustainability Metrics: Include a “Green Score” for nodes that utilize carbon-neutral shipping or recycled packaging.
- When to use: Use it for stakeholder presentations, operating-model discussions, or when you need an editable supply chain diagram that reflects a digitally connected business rather than a traditional factory line.
2. Supply Chain Management VSM Template
This template adds operational data to the process flow so teams can examine where time and inventory accumulate. Value stream mapping (VSM) distinguishes value-adding work from delays and other non-value-adding activity across the flow.
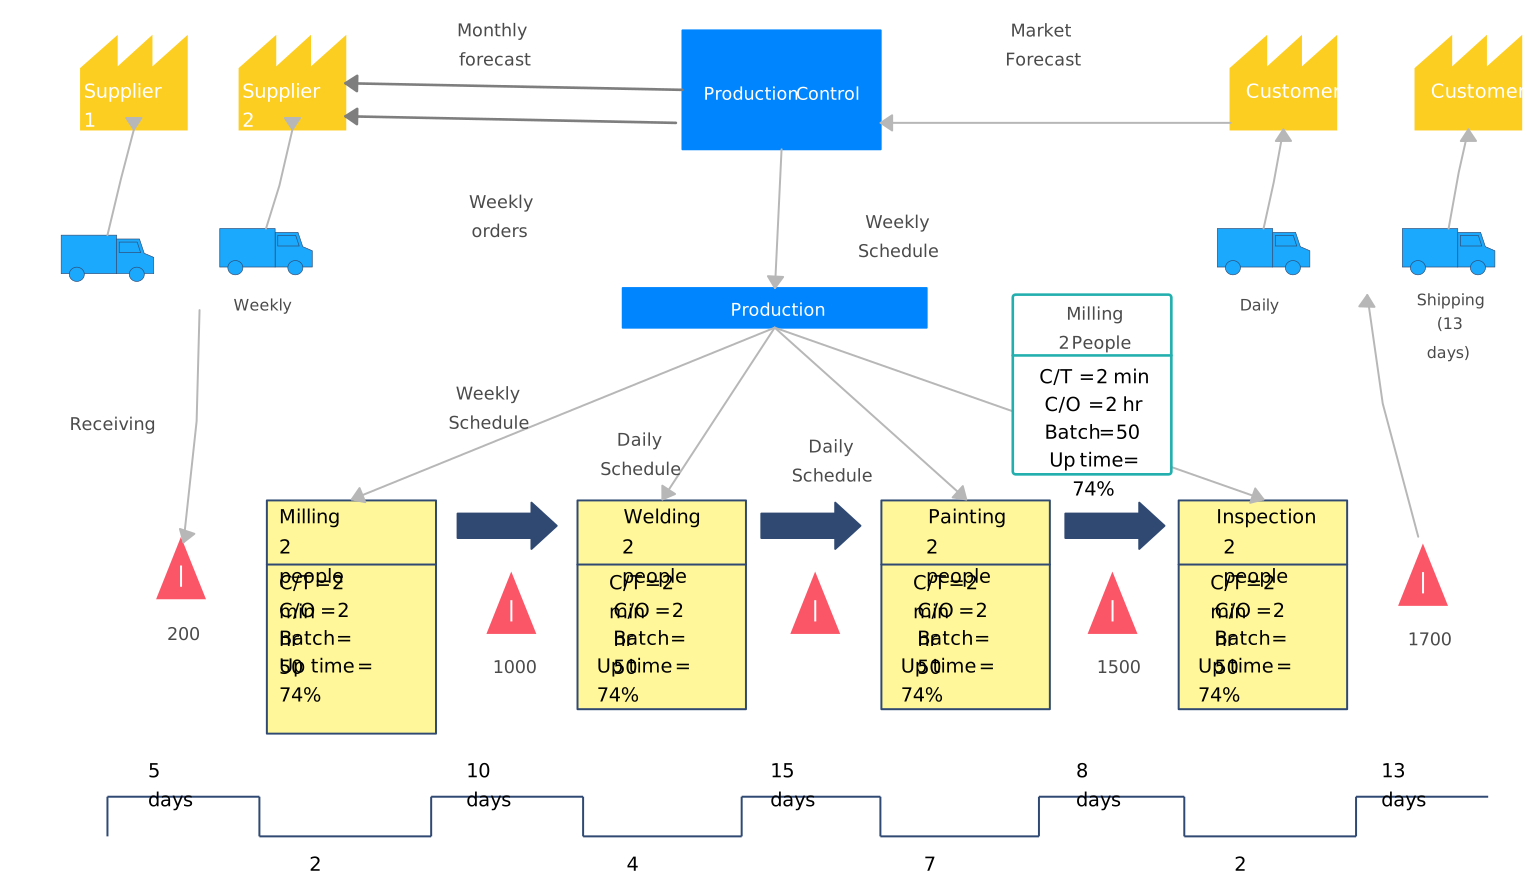
- What it shows: The flow of materials and information. It records lead times, cycle times, and work-in-process (WIP) levels to help teams investigate where inventory accumulates or communication slows.
- Practical use:
- Waste identification: Identify non-value-adding activity that the team can investigate, reduce, or remove.
- Bottleneck detection: Locate steps that constrain flow and compare their cycle time or capacity with surrounding stages.
- Quick customization checklist:
- Data Boxes: Add cycle time ($C/T$), changeover time ($C/O$), and uptime percentages to each process block.
- Timeline Rail: Include a “Value-Added” vs. “Non-Value-Added” time ladder at the bottom.
- Kaizen Bursts: Use bright callouts to mark areas targeted for immediate improvement.
- When to use: Use it for lean workshops, periodic process reviews, or when a team needs evidence to prioritize changes that may improve lead time, throughput, or cost.
3. Pharmaceutical Supply Chain Map
Pharmaceutical supply chains require close control of product quality, storage conditions, and regulatory documentation. This supply chain flow chart helps teams document the checkpoints and handoffs involved in moving sensitive products from source to patient.
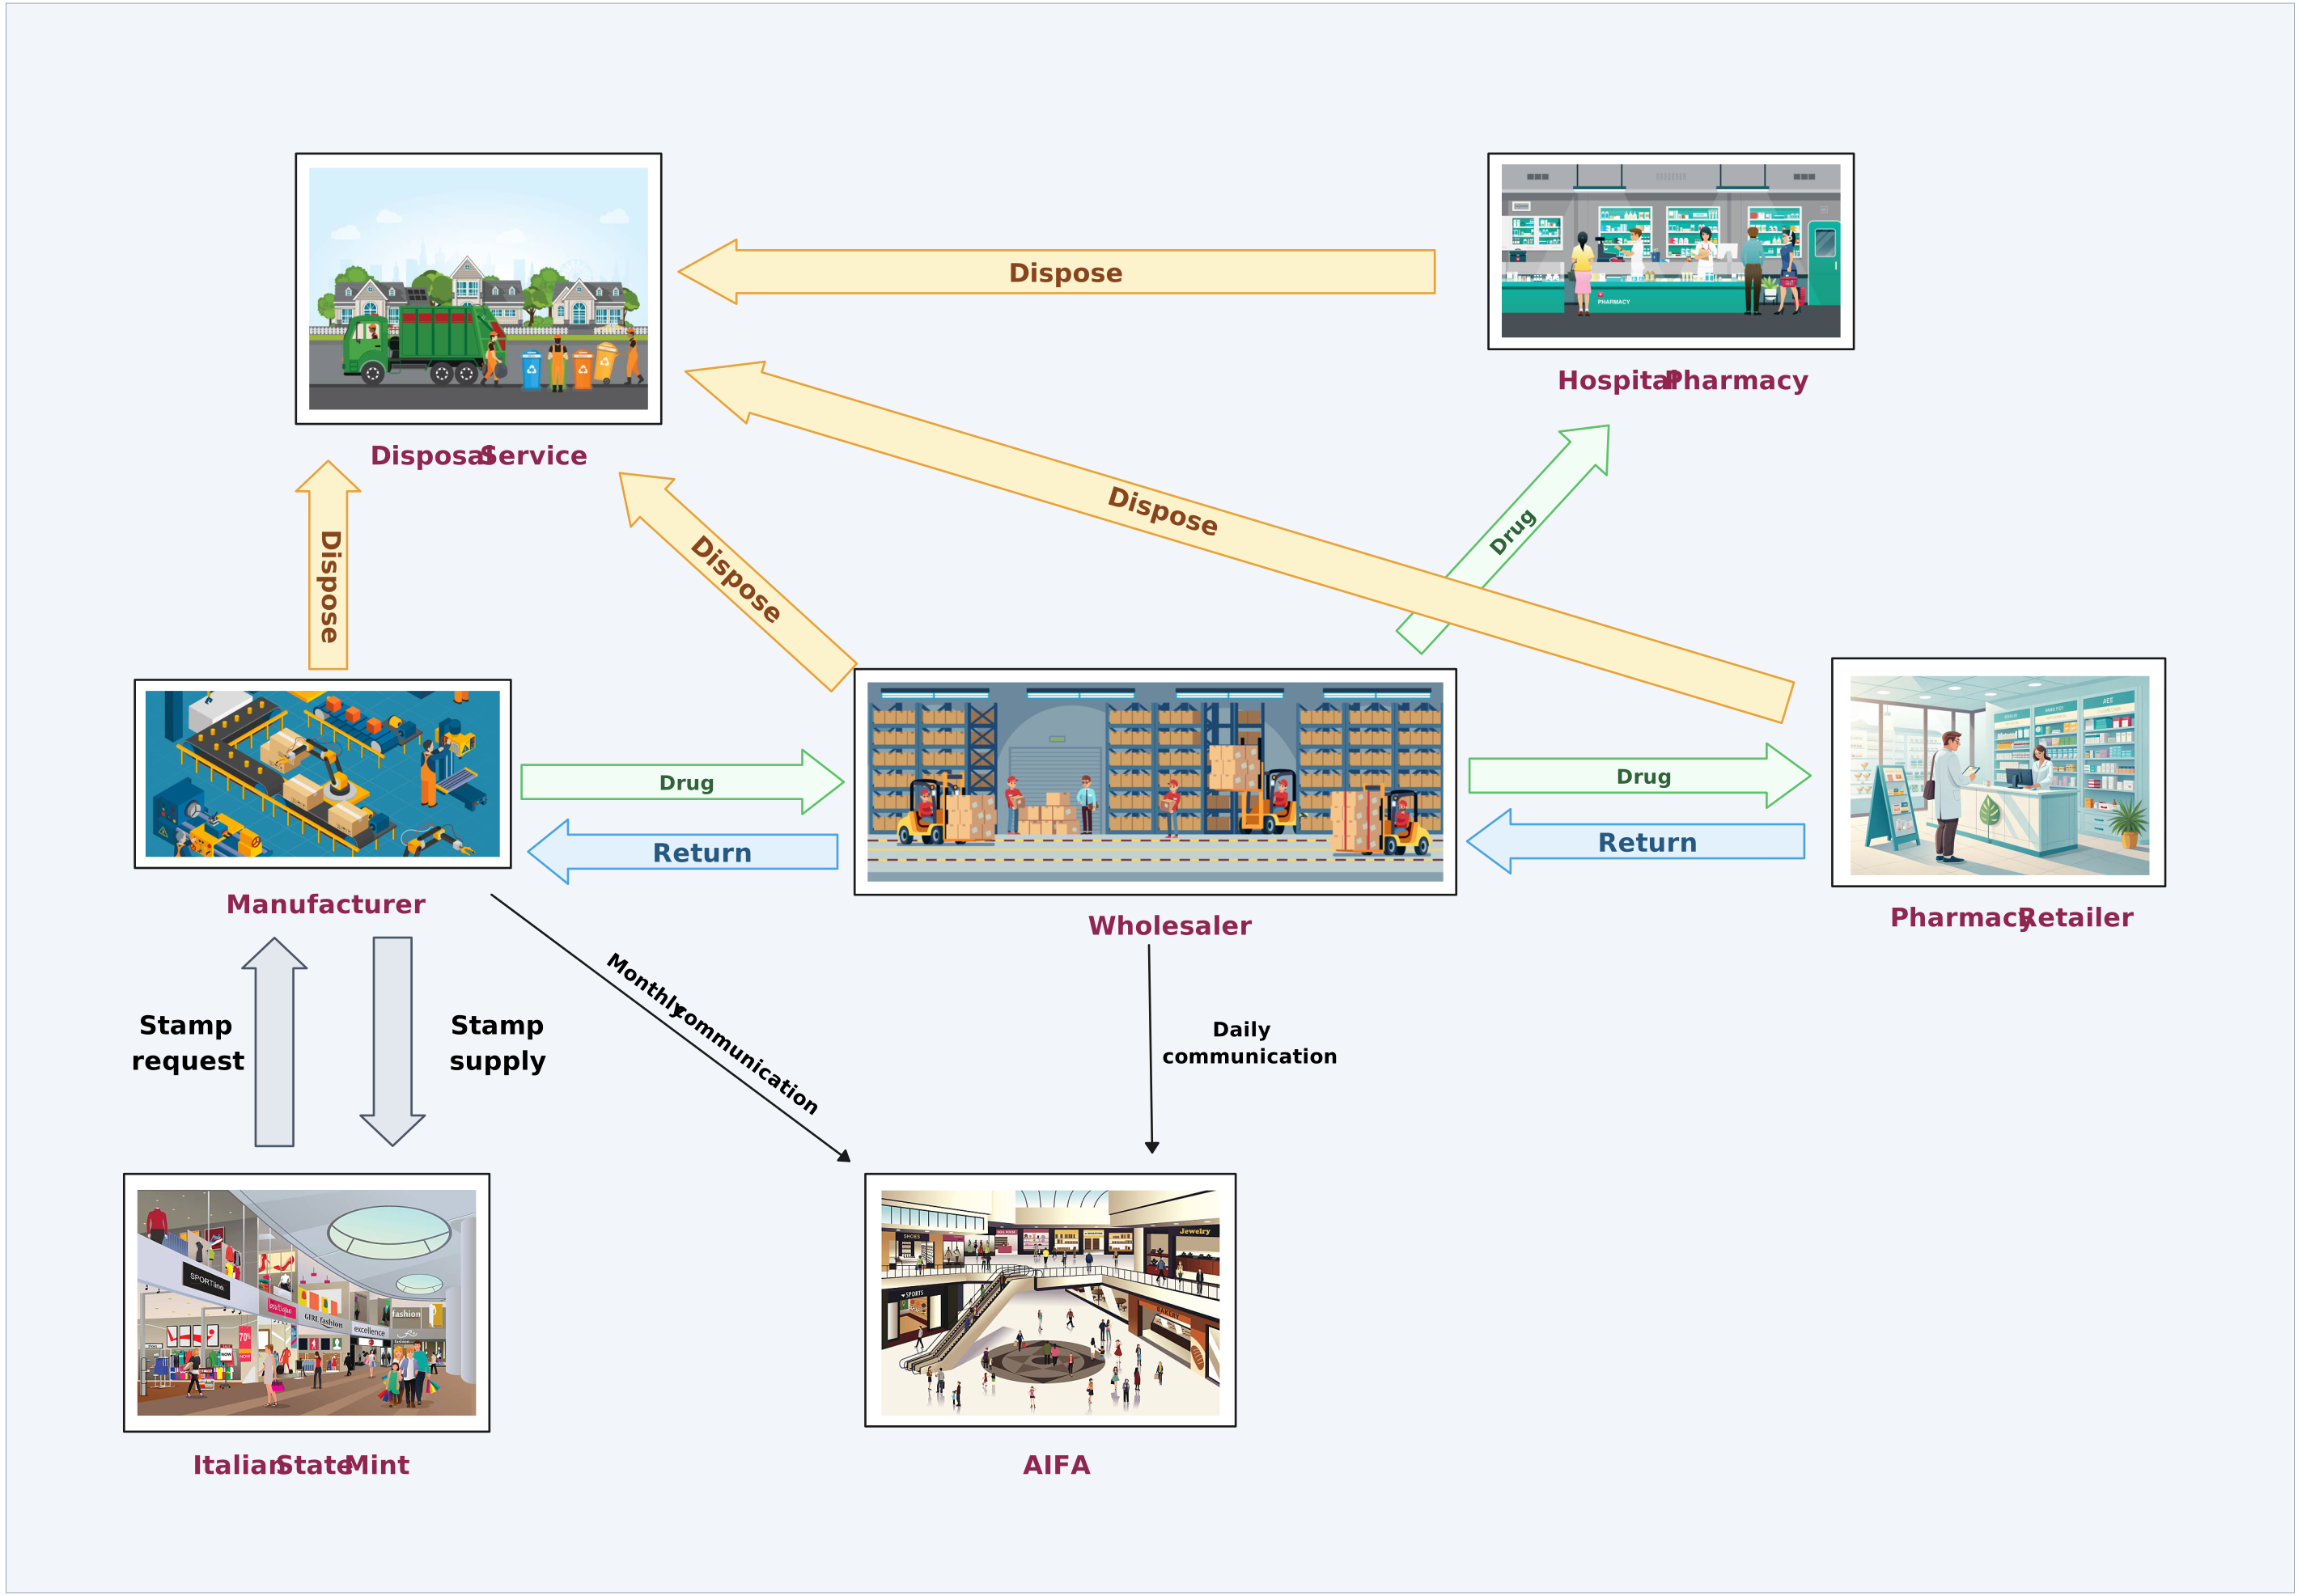
- What it shows: An end-to-end journey from active pharmaceutical ingredient (API) sourcing to last-mile delivery at pharmacies or hospitals. It can document cold-chain controls, quality and regulatory checkpoints, and serialization or track-and-trace activities where they apply.
- Practical use:
- Cold Chain Review: Document where temperature-sensitive products require monitoring and controlled handling.
- Audit Preparation: Give reviewers a clear supply chain process diagram showing where quality controls and records belong at each handoff.
- Quick customization checklist:
- Environment Sensors: Add icons for IoT temperature and humidity sensors at transit stages.
- Validation Steps: Include specific nodes for Quality Assurance (QA) release and lab testing.
- Regulatory Labels: Color-code stages that require specific compliance documentation (e.g., GMP or GDP).
- When to use: Use it when planning logistics for vaccines or biologics, reviewing supply-chain risks, or onboarding distribution partners who need to understand responsibilities and handoffs.
4. Coffee Supply Chain Map
Tracing a coffee bean from a high-altitude farm to a morning mug is a masterclass in global logistics. This supply chain flow chart template captures the vibrant, multi-continental journey of a commodity where timing and ethics are just as important as the flavor profile.
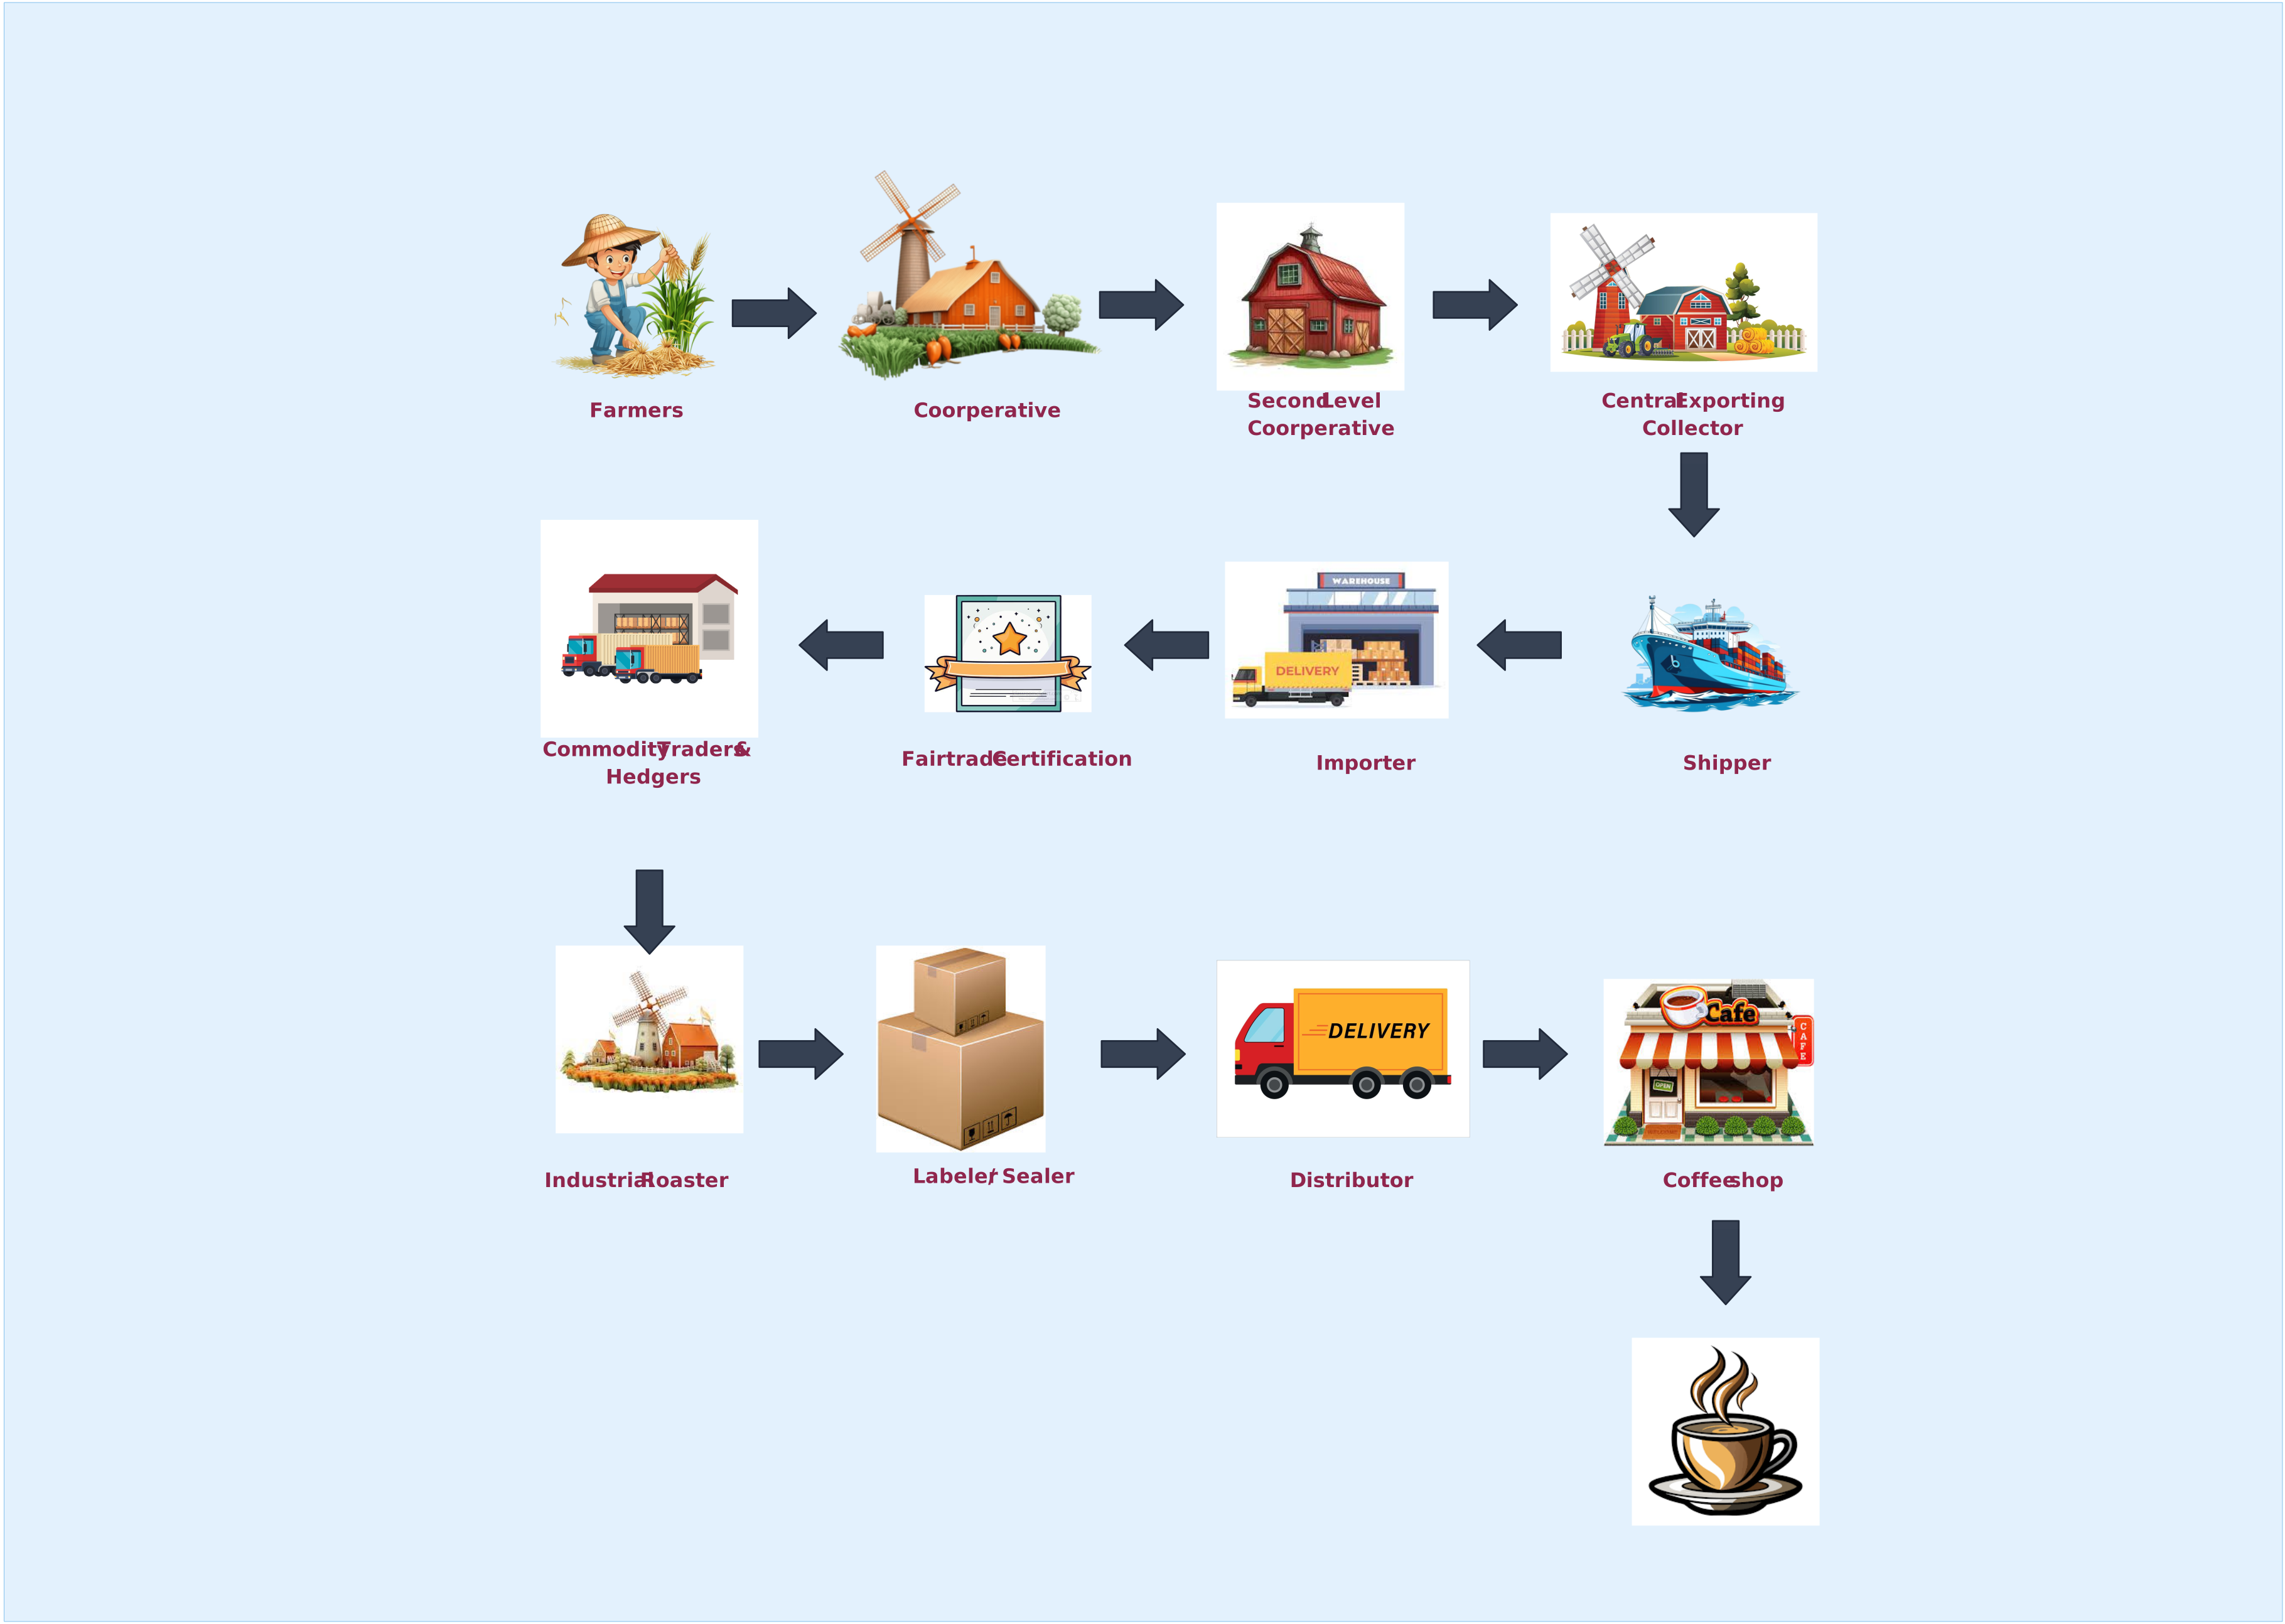
- What it shows: The transition from agricultural origins (harvesting and drying) to international shipping, roasting, and final retail. It highlights the critical handoffs between farmers, exporters, roasters, and baristas.
- Practical use:
- Transparency and certification: Show where certification evidence is checked so stakeholders can review how ethical-sourcing requirements are addressed.
- Lead Time Management: Visualize the long “sea-leg” of the journey to better predict inventory needs during seasonal shifts.
- Quick customization checklist:
- Origin Markers: Tag specific regions (e.g., Ethiopia, Colombia) and note the harvest seasons.
- Quality Gates: Add nodes for cupping and moisture testing to show where product quality is assessed.
- Sustainability Badges: Use icons to mark Fair Trade, Rainforest Alliance, or Organic checkpoints.
- When to use: Use it for sustainability reporting, marketing storytelling, or when stakeholders need to understand the network behind a cup of coffee.
5. Garment Manufacturing Supply Chain Map
Garment supply chains coordinate materials, manufacturing, inspections, transport, and seasonal deadlines across multiple suppliers and locations. This flowchart gives teams a shared view of those dependencies and the handoffs that can affect a collection’s production schedule.
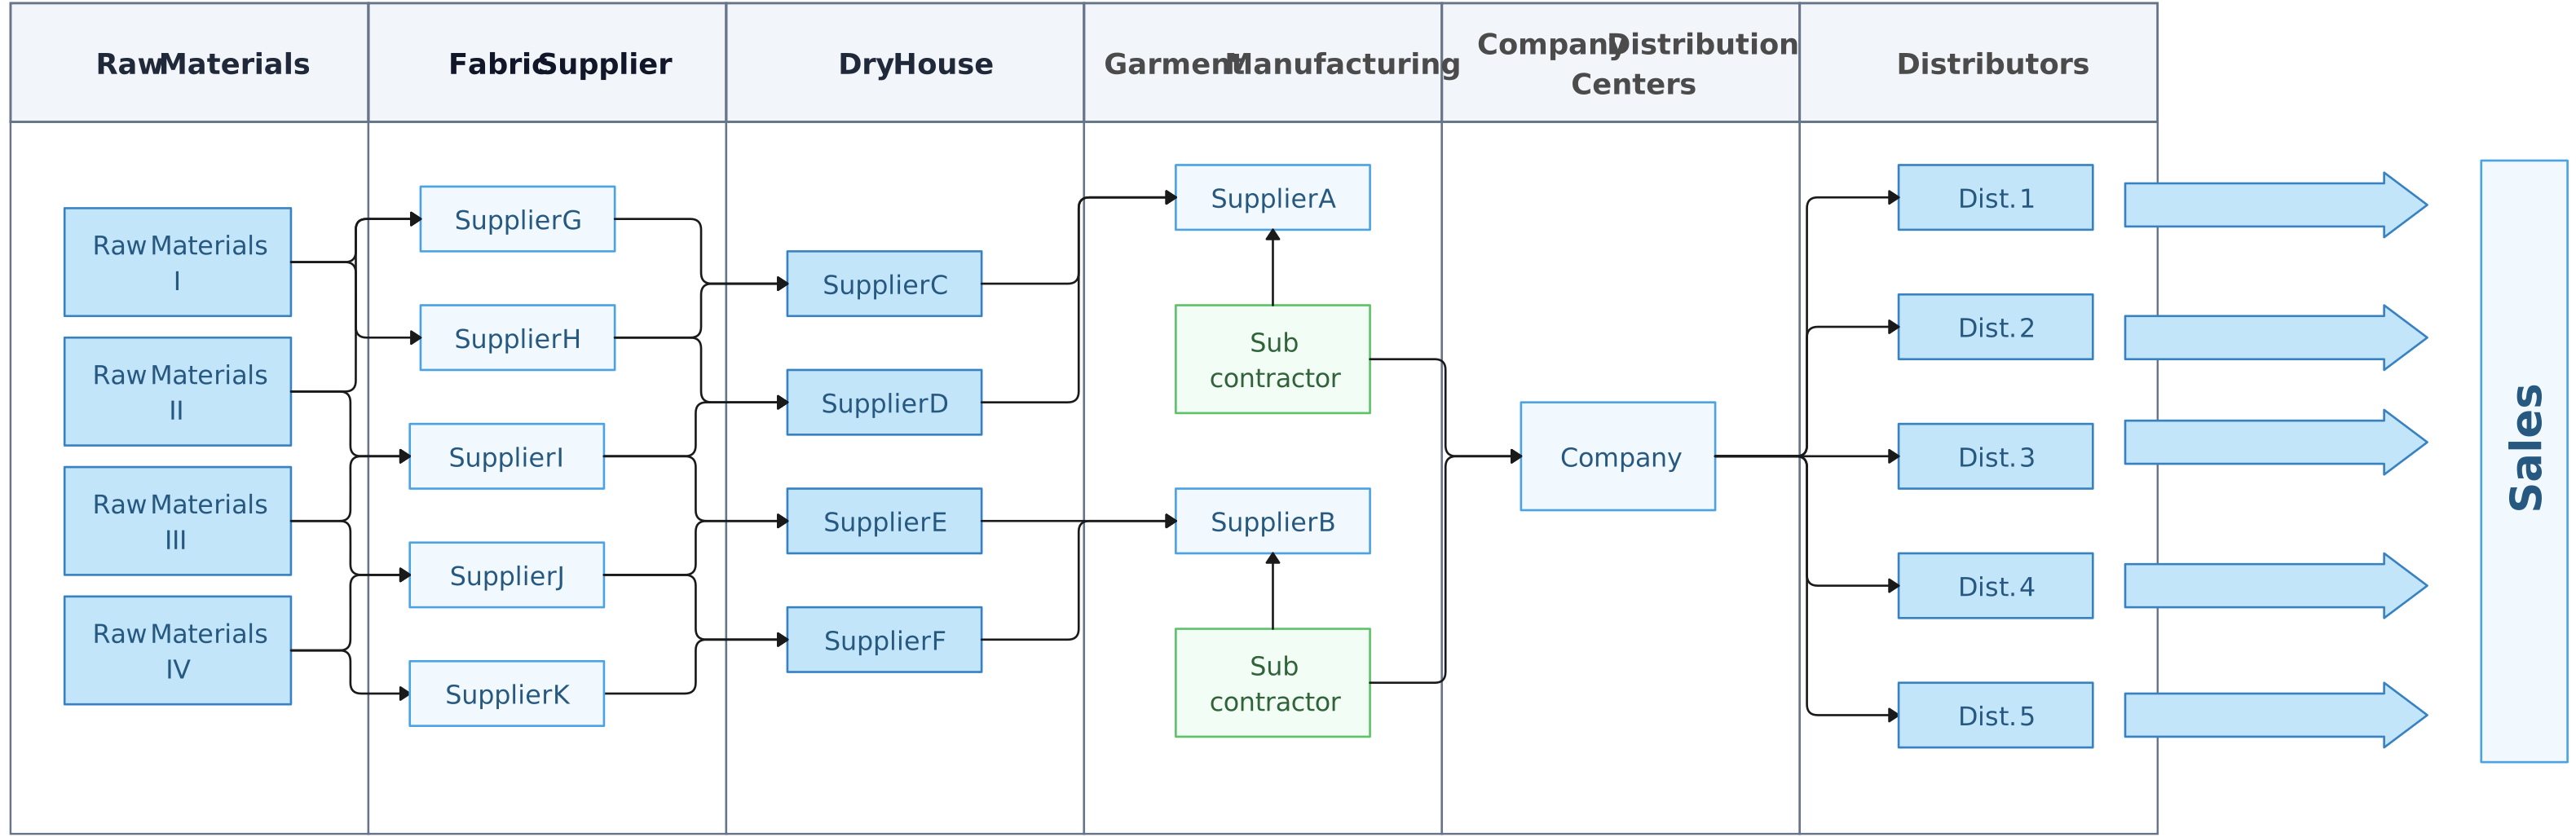
- What it shows: The intricate web of soft-goods production—from raw fiber sourcing and textile mills to garment construction (cut-make-trim), quality control, and global shipping to retail hubs.
- Practical use:
- Bill of materials (BOM) planning: Show where components such as buttons, thread, and fabric enter the flow so teams can coordinate their availability.
- Vendor management: Map tier-1 and tier-2 suppliers, then note the capacity, quality, or ethical-sourcing requirements teams need to review.
- Quick customization checklist:
- Seasonality Tags: Mark different flows for “Spring/Summer” vs. “Fall/Winter” to account for different logistics speeds.
- Quality Inspection Points: Insert icons for “In-line Inspection” and “Final Random Inspection” (FRI).
- Duty & Tariff Zones: Color-code international borders where customs clearance and duties impact your lead time.
- When to use: Use this supply chain workflow diagram during seasonal planning, supplier onboarding, or when marketing and sales teams need visibility into the production timeline.
6. Manufacturing Process Flowchart
While an end-to-end map shows the wider supply chain, a manufacturing process flowchart focuses on what happens on the factory floor. It documents the sequence of work, decision points, and responsibilities involved in turning materials into finished goods.
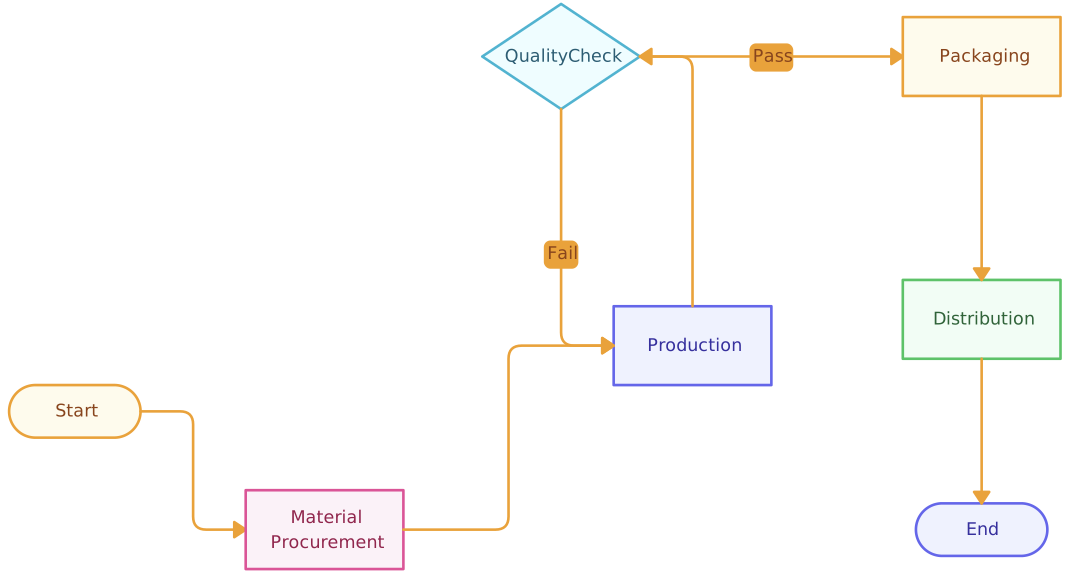
- What it shows: The granular, step-by-step transformation of raw materials into finished goods. It covers everything from initial fabrication and assembly to sub-assembly testing and final packaging.
- Practical use:
- Standard operating procedure (SOP) support: Connect the visual sequence with the instructions and reference material workers need to perform each stage consistently.
- Throughput analysis: Help operations leads investigate starved or blocked stations where work is delayed.
- Quick customization checklist:
- Work Centers: Label specific machinery or departments (e.g., CNC Machining, Welding, Assembly Line A).
- Quality Gates: Insert “Go/No-Go” decision diamonds to indicate where products must pass inspection before moving forward.
- Cycle Time Annotations: Add the average time each station takes to help with load balancing.
- When to use: Use it for daily stand-up meetings, production reviews, floor-layout planning, and training people on the workflow they will follow.
7. Customer Order Process Flow Chart
This customer order process flowchart maps the handoffs between a digital storefront, payment processing, fulfillment, delivery, and customer support. It helps teams define who owns each transition and where exceptions require follow-up.
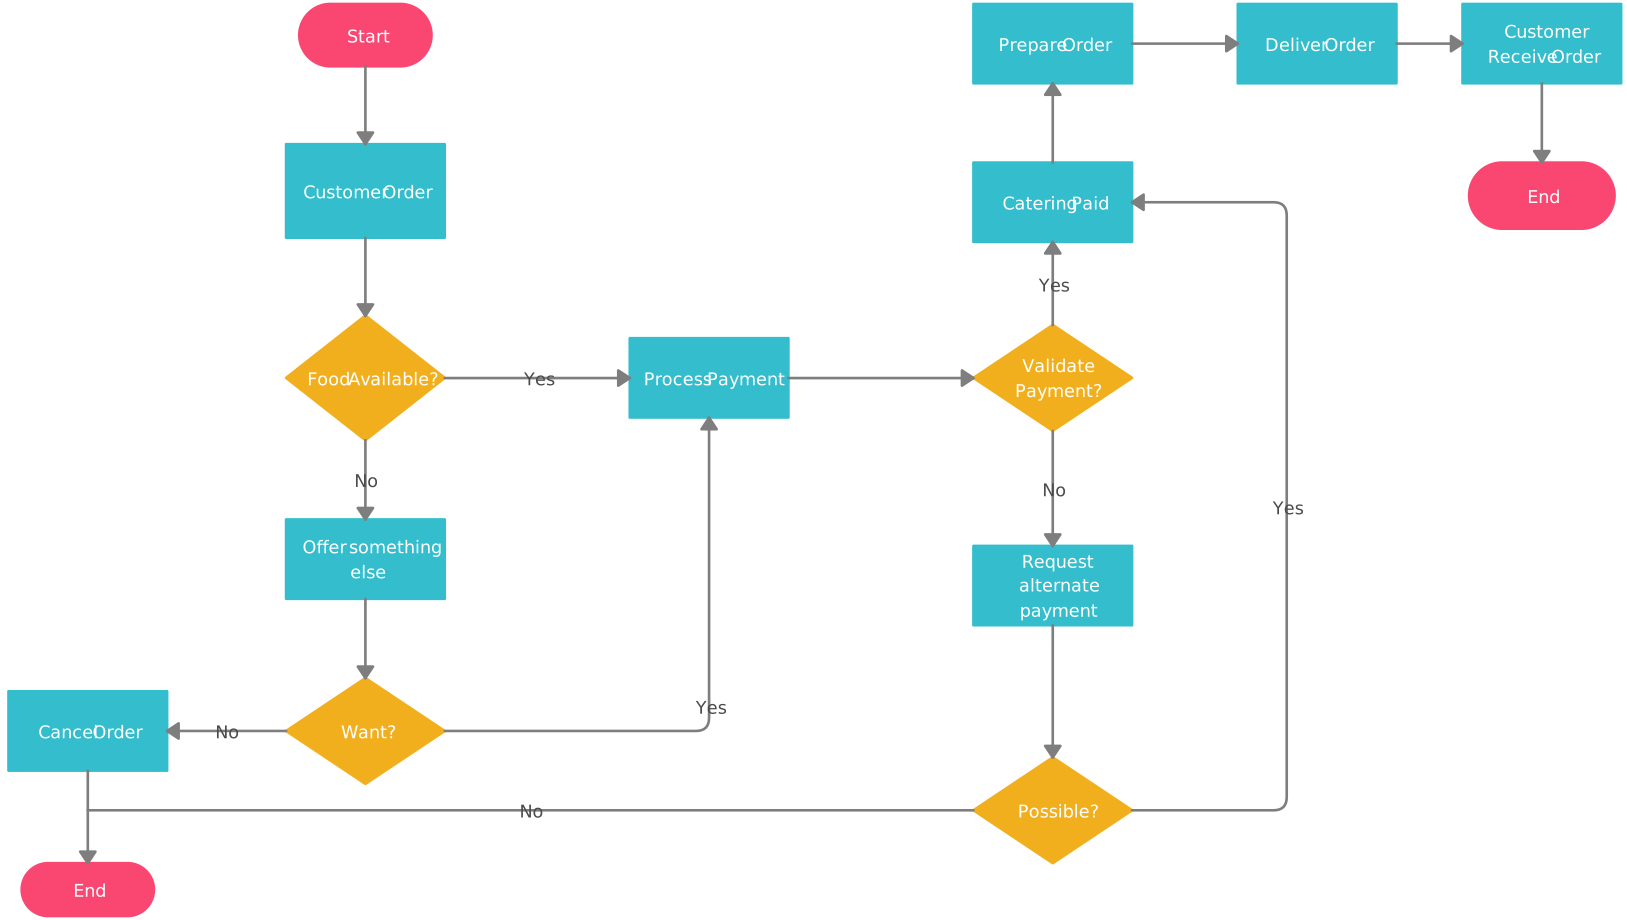
- What it shows: The sequence of events triggered by a purchase, including payment verification, warehouse picking/packing, shipping label generation, and final-mile delivery updates.
- Practical use:
- Customer communication: Identify gaps in status communication and document where notification triggers should occur.
- Error analysis: Spot manual data-entry points where validation or appropriate automation could reduce shipping-address errors.
- Quick customization checklist:
- Trigger Points: Mark where automated emails (Order Confirmed, Shipped, Delivered) are sent.
- Exception Paths: Add branches for “Out of Stock” scenarios or “Failed Payment” workflows.
- Return Loops: Include a clear path for how a customer initiates a return or exchange.
- When to use: Use this supply chain flow chart template when scaling your fulfillment team, integrating a new 3PL, or auditing your shipping speeds for a holiday peak.
8. Spaghetti Diagram for Retail & Warehousing
A spaghetti diagram is a physical map of movement through a workspace. It reveals repeated travel, backtracking, intersecting paths, and congestion that may be difficult to see in a conventional process flowchart.
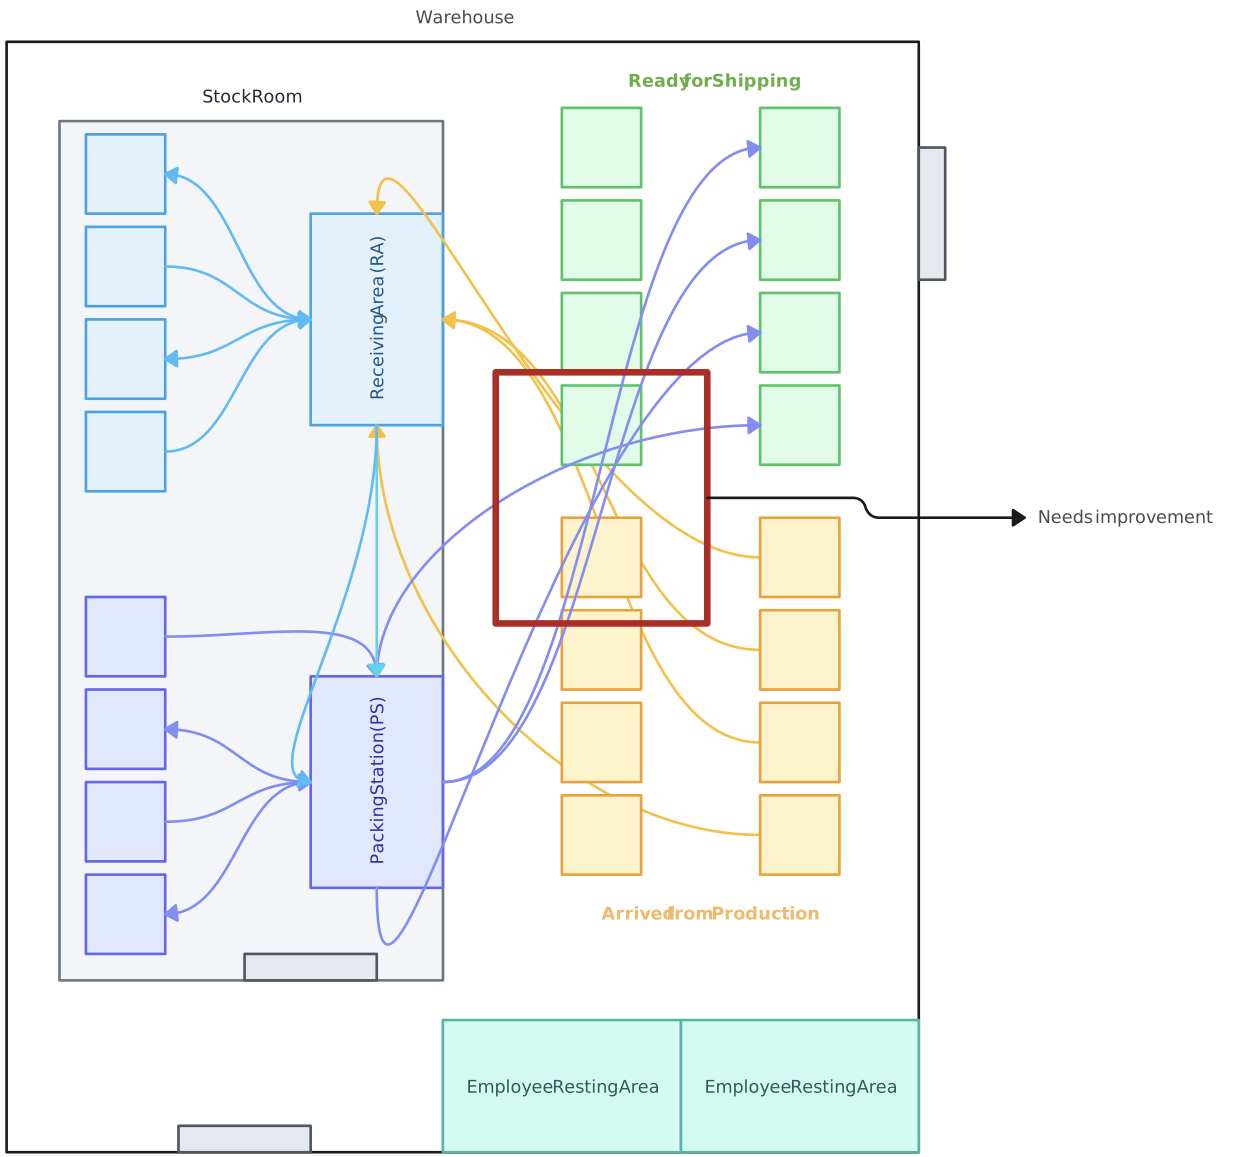
- What it shows: The actual path taken by a person or product through a process. By drawing lines (the “spaghetti”) for every movement, you’ll quickly see where paths cross, where people are backtracking, and where the “traffic jams” are happening.
- Practical use:
- Motion Waste Reduction: Identify unnecessary walking or transport time that adds zero value to the order.
- Layout redesign: Compare current and proposed routes to estimate whether moving high-velocity items closer to packing could reduce travel time.
- Quick customization checklist:
- Color-Coded Paths: Use different colors for different roles (e.g., Pickers vs. Restockers) to see where they collide.
- Distance Totals: Annotate the “before” and “after” total walking distance to calculate time saved.
- Heat Zones: Highlight areas where lines are densest to identify the need for wider aisles or better signage.
- When to use: Essential for warehouse managers during a 5S audit, retail store managers optimizing floor flow, or anyone looking to create a supply chain diagram that solves real-world physical friction.
From Scattered Workflows to Seamless Execution
Each supply chain diagram answers a different operational question. A network map clarifies end-to-end relationships, a value stream map adds time and waste data, a process flowchart documents repeatable work, and a spaghetti diagram examines physical movement. Choosing the format based on the decision at hand keeps the diagram focused and useful.
With Creately’s supply chain mapping tool, teams can build these views in a shared visual workspace and keep operational context connected through notes, links, files, and structured details such as owners or status. Stakeholders can use comments and real-time collaboration to review assumptions and handoffs, while the responsible owner incorporates agreed changes. Maintaining the map as operations change turns it into living documentation rather than a one-time workshop artifact. The diagram supports analysis and alignment; teams should still validate its data against their operational systems and records.
Helpful Resources
Map out your value chain easily to identify ways you can improve processes to add more value to your products & customers.
Use mind maps to visualize ideas and concepts for collaborative brainstorming, problem-solving, and so much more.
This Gantt chart tutorial will help you master the art of creating visual timelines for tasks and milestones
Resources:
Gardner, J.T. and Cooper, M.C. (2003). STRATEGIC SUPPLY CHAIN MAPPING APPROACHES. Journal of Business Logistics, 24(2), pp.37–64. doi:www.doi.org/10.1002/j.2158-1592.2003.tb00045.x.
MacCarthy, B.L., Ahmed, W.A.H. and Demirel, G. (2022). Mapping the supply chain: Why, what and how? International Journal of Production Economics, [online] 250(1). doi:www.doi.org/10.1016/j.ijpe.2022.108688.