A KWL chart is one of the simplest yet most effective tools to engage students in active learning. Short for Know, Want to Know, and Learned, this graphic organizer helps learners structure their thinking, ask better questions, and reflect on their progress.
Whether you’re planning a science lesson for elementary students or organizing research discussions in high school, this guide will show you how to make a KWL chart, use it effectively, and save time with editable KWL chart templates.
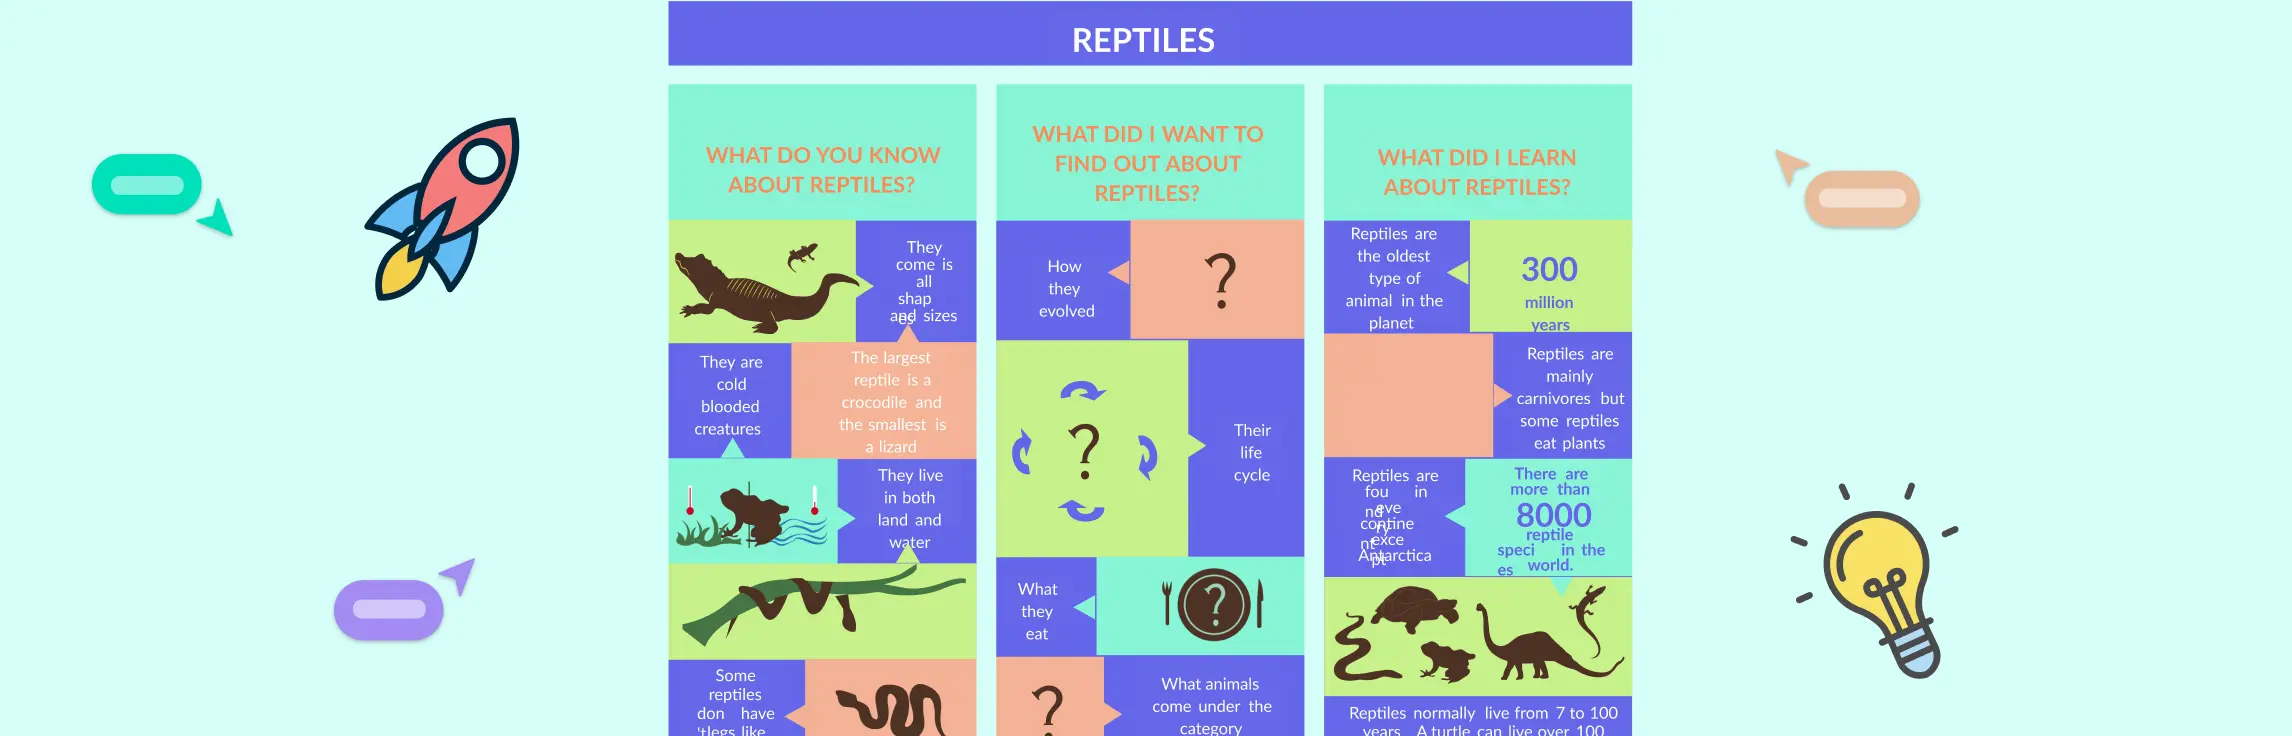
What Is a KWL Chart?
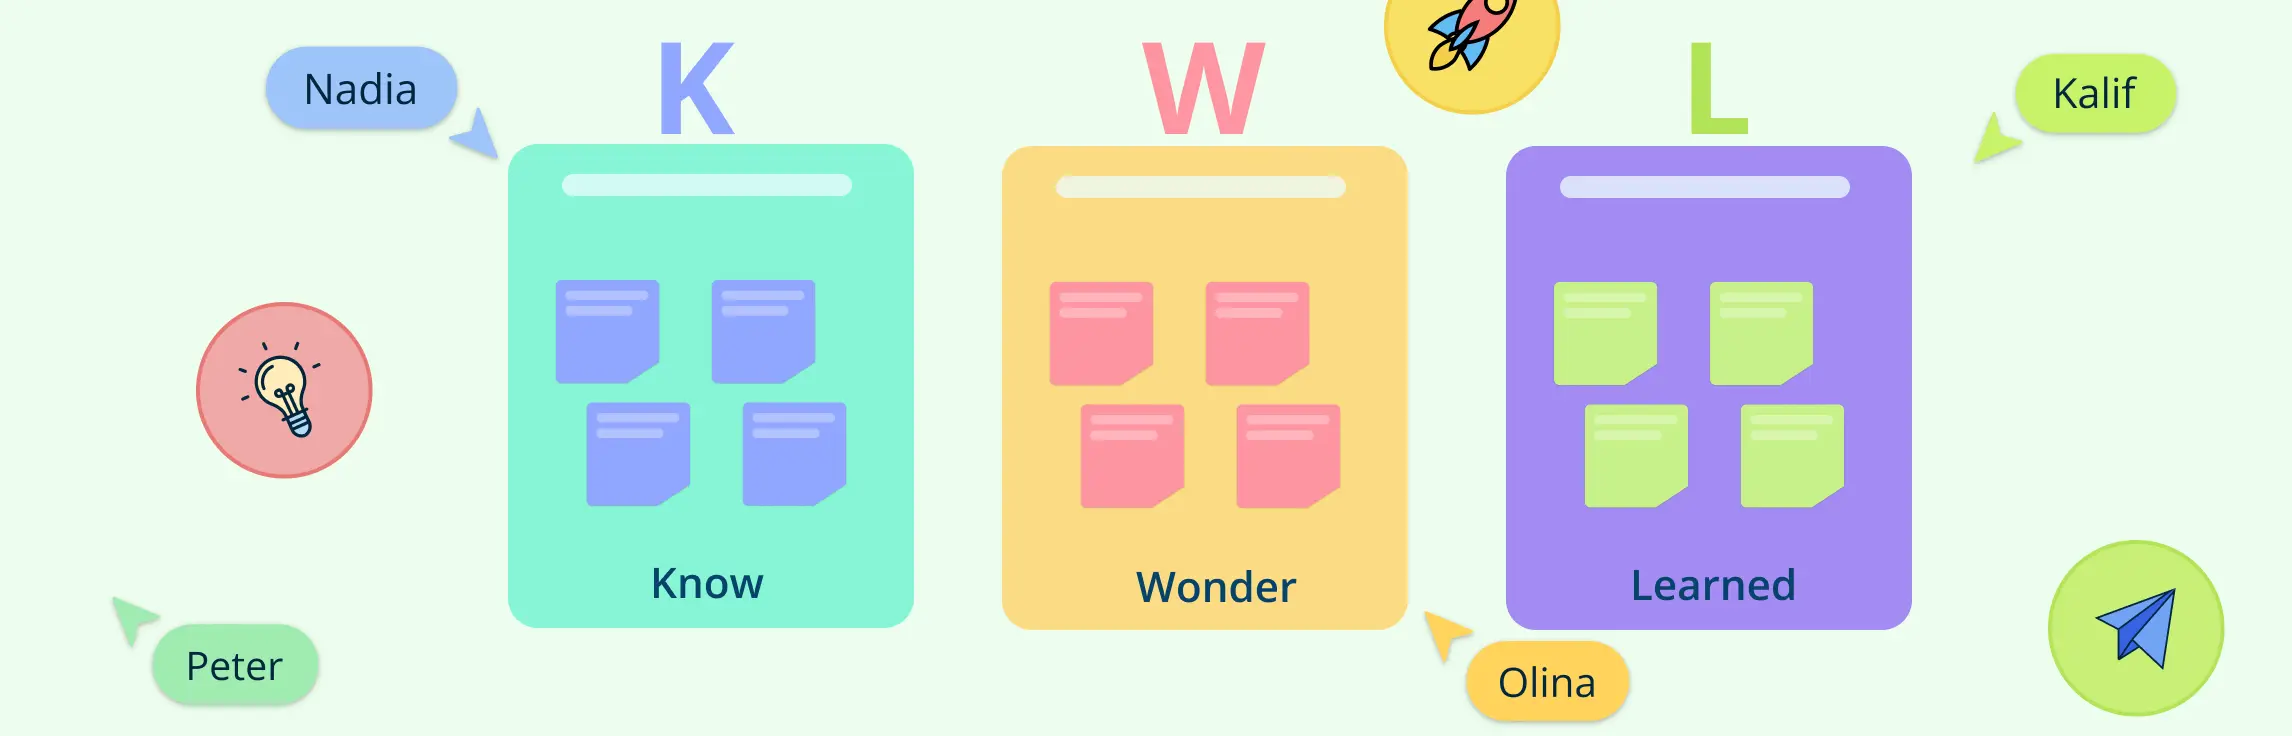
A KWL chart is a three-column graphic organizer that captures:
- Know - What students already know
- Want to Know - What they want to know
- Learned - What they’ve learned
It’s often used at the beginning, middle, and end of a lesson or unit to activate prior knowledge, encourage inquiry, and reflect on learning. This makes it especially valuable for classrooms that emphasize critical thinking and student voice.
6 Steps to Make a KWL Chart
Creating a KWL chart is quick and flexible. You can use paper, a whiteboard, or digital tools like Creately.
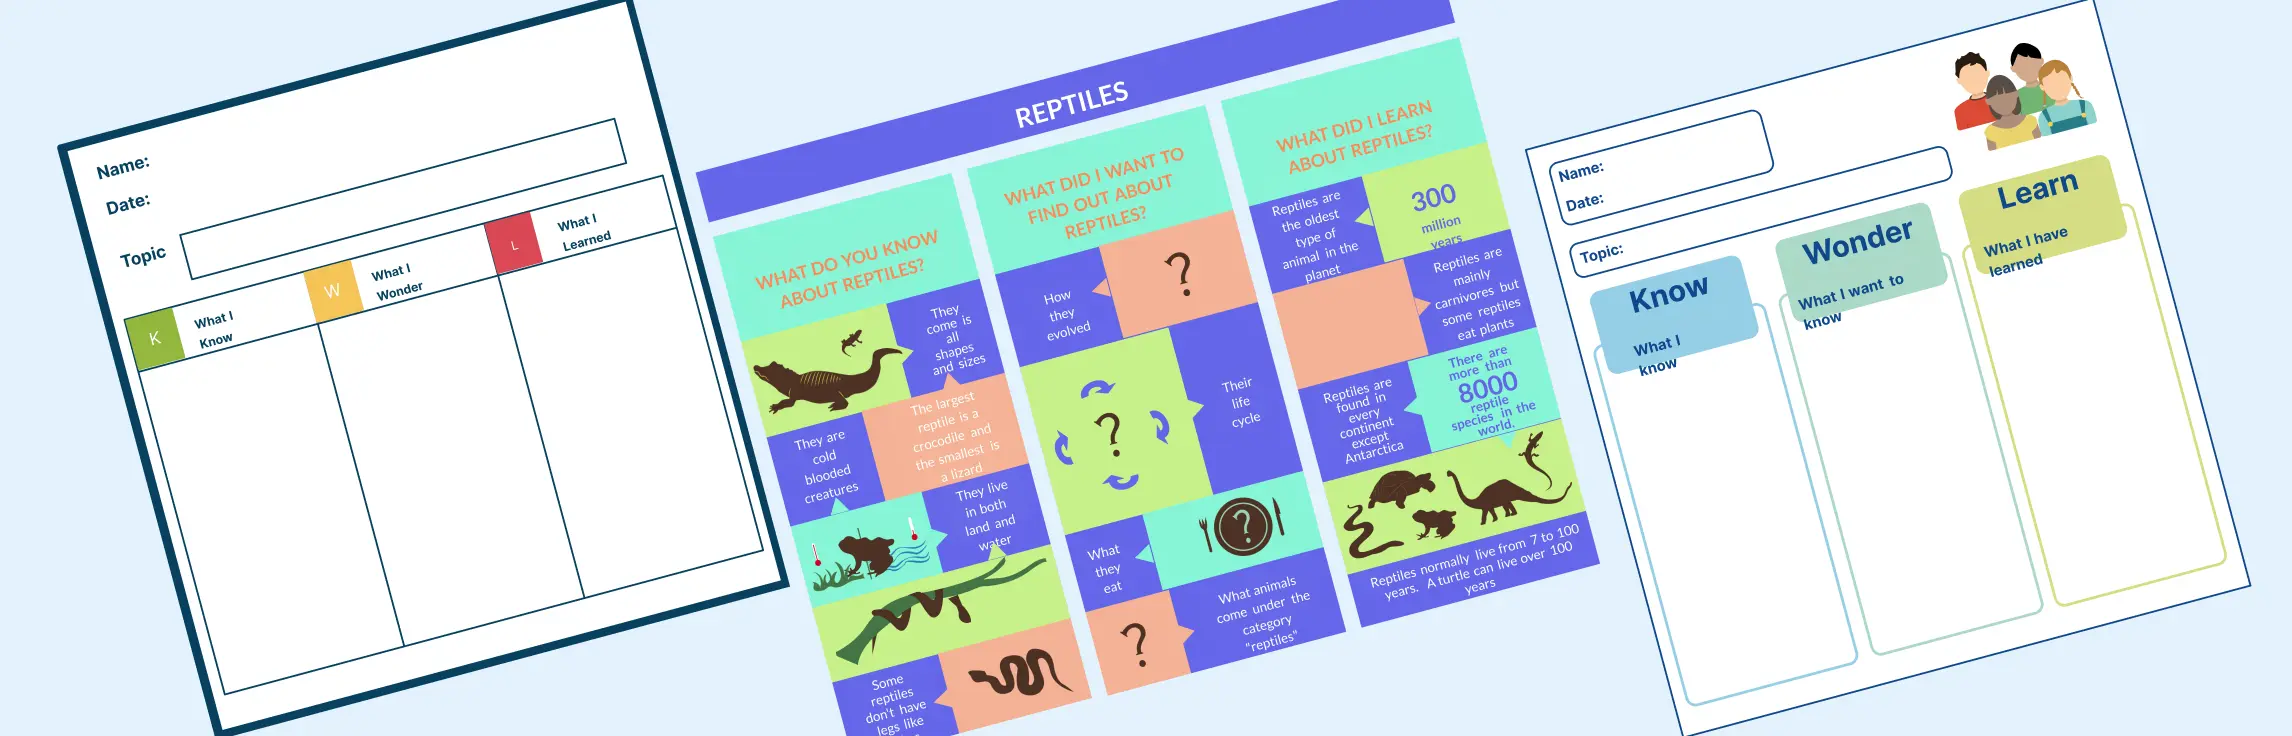
Step 1: Choose Your Format
Decide how you want to present the chart:
- Paper-based: Draw three columns on a sheet or chart paper.
- Digital: Use a KWL chart template on a collaborative platform like Creately.
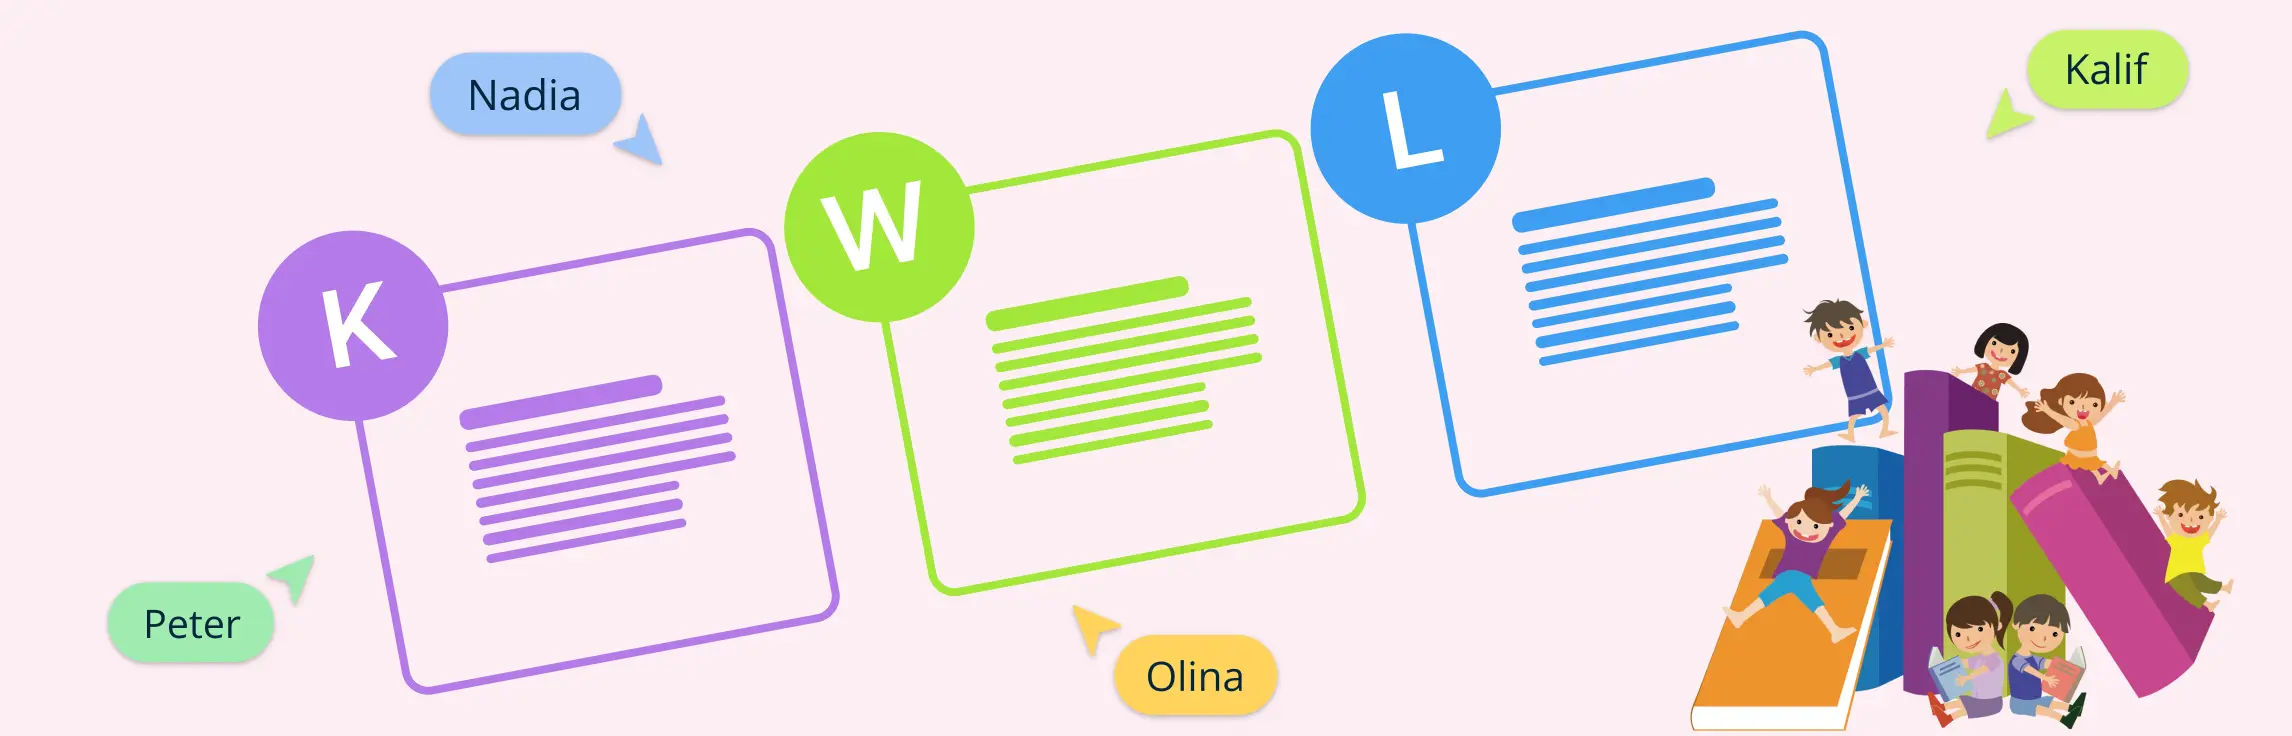
Step 2: Label the Columns
Draw three vertical columns and label them clearly:
- K - Know
- W - Want to Know
- L - Learned
Keep headings bold and legible for easy classroom reference.
Step 3: Customize the Layout
Adjust the size of each column to fit your needs:
- Leave more space for the W column to accommodate open-ended questions.
- Use colors or icons to make it visually appealing—especially for younger learners.
Step 4: Fill in the “K” Column
Ask students what they already know about the topic. Keep entries short—phrases work better than long sentences. For example:
- “The sun gives us light”
- “Plants need water”
Encourage discussion and let students build on each other’s responses.
Step 5: Brainstorm “W” Questions
Prompt students to ask questions they’re curious about. Use sentence starters like:
- “I want to know why…”
- “How does it work?”
- “What happens when…?”
Guide them toward questions that promote deeper thinking and exploration.
Step 6: Complete the “L” Column After the Lesson
Once the lesson or unit is complete, revisit the chart. Ask students to reflect:
- What new facts did they learn?
- Which questions were answered?
- Did anything surprise them?
Have them summarize learnings using bullet points, keywords, or brief phrases.
KWL Chart Examples
1. Elementary Science KWL Chart - Butterfly Life Cycle
- K: “Caterpillars eat leaves.”
- W: “How does it turn into a butterfly?”
- L: “It forms a chrysalis and changes inside.”


2. Middle School History KWL Chart - Ancient Civilizations
- K: “Rome had a republic.”
- W: “What led to its fall?”
- L: “Economic issues and invasions contributed.”

3. High School Biology KWL Chart - Photosynthesis
- K: “Plants use sunlight to make food.”
- W: “Where does the oxygen come from?”
- L: “Oxygen is a byproduct of splitting water during photosynthesis.”

4. Elementary Language Arts KWL Chart - Story Elements
- K: “Stories have characters and settings.”
- W: “What makes a story interesting?”
- L: “The problem and solution make the story exciting.”

5. Middle School Geography KWL Chart - Natural Disasters
- K: “Earthquakes shake the ground.”
- W: “Why do earthquakes happen?”
- L: “They occur when tectonic plates shift under the Earth’s surface.”

Using a KWL Chart Effectively in the Classroom
1. Start Every Lesson with the KWL Chart
Use the Know, Want-to-know, and Learned template as a pre-learning activity to tap into prior knowledge. This sets a collaborative and participatory tone.
2. Revisit and Update
Don’t wait until the end. During the lesson, return to the chart to refine questions, add discoveries, or clarify misunderstandings.
3. Encourage Group Collaboration
Assign small groups to fill in a KWL chart template together. Peer discussion often leads to better questions and deeper learning.
4. Model Thought Process
Demonstrate how to move from “I want to know“¦” to “I learned“¦” This helps students recognize how their curiosity drives learning.
5. Use as a Formative Assessment Tool
Analyze entries in each column to check understanding, address misconceptions, and plan next steps.
Advanced Variations of the KWL Chart: KWHLAQ and KWL+ SIFR
For deeper reflection, educators can adopt extended versions of the standard chart:
KWHLAQ Chart
Adds columns for:
- H - How will I learn?
- A - How will I apply?
- Q - Questions
This structure prompts students to plan research methods and real-world applications beyond basic inquiry.
KWL+ SIFR Chart
Builds on KWL by including:
- S - Still want to know
- I - Importance
- F - Found information
- R - Remember
The S column captures lingering questions, while I helps students assess topic relevance. F logs sources, and R reinforces key takeaways.
Tips for Implementing KWL Charts
- Use visuals and icons: Pair words with images to support early readers and maintain attention.
- Keep prompts simple: Use clear, age-appropriate language for K, W, and L entries.
- Incorporate group work: Small teams can share ideas, reducing hesitation and boosting confidence.
- Provide sentence starters: Offer structured phrases such as “I know that…” or “I want to learn…” to guide responses.
- Celebrate achievements: Display completed charts in the classroom to reinforce progress and motivate learners.
By tailoring the process to young learners, teachers can foster curiosity and collaboration. A well-designed KWL graphic organizer becomes both a learning tool and a confidence builder, helping elementary students feel invested in their own progress.