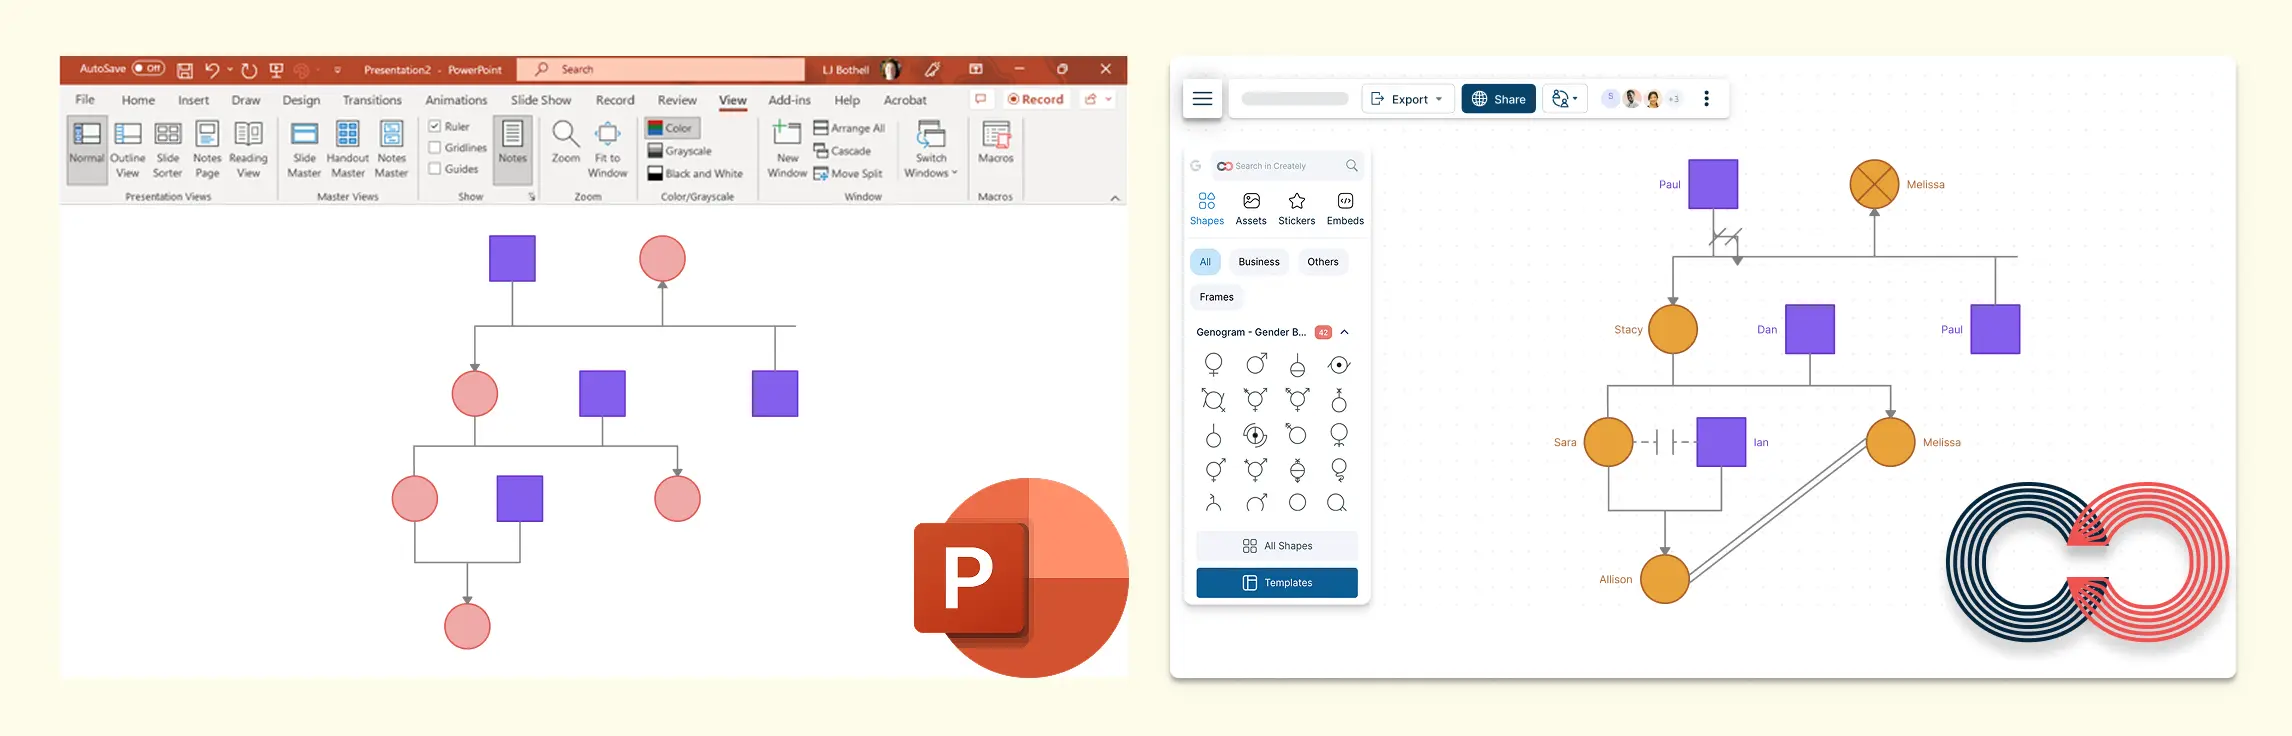
If you’ve tried building a genogram in PowerPoint, you’ve probably run into the same friction points: manually duplicating shapes, aligning connection lines, and trying to represent complex family dynamics with tools that weren’t built for genograms. That’s where Creately offers a major advantage. Instead of treating a genogram like a slide drawing, it gives you purpose-built genogram tools such as clinically meaningful relationship types, AI-assisted generation, structured family data fields, and export options that work better for documentation, collaboration, and presentations.
How to Make a Genogram in PowerPoint
Creating a genogram in PowerPoint is possible, but it takes extra manual work because PowerPoint does not include dedicated genogram symbols, relationship logic, or family data fields. Here are the basic steps.
Step 1. Open a New Presentation
- Start by opening PowerPoint and creating a new blank slide. Choose a blank layout to give you plenty of space to work with.
Step 2. Set Up the Slide
- Adjust the slide size if needed. Go to Design > Slide Size and select Custom Slide Size to set your preferred dimensions, especially if your genogram is going to be large.
Step 3. Add Shapes for Family Members
- Go to the Insert tab and click on Shapes to add squares or circles for each family member.
- Resize and arrange the shapes on the slide to begin forming the structure of your genogram.
Step 4. Insert Text to Label Family Members
- Click on each shape and type the name of the family member. You can also add additional details such as birthdates, medical information, or relationship notes, but this can quickly become cumbersome.
Step 5. Connect Family Members
- Use lines or arrows (found in Shapes) to represent relationships between family members. Straight lines are usually used for marriages, while dashed lines may represent estranged relationships or separations.
- You’ll need to manually adjust the lines to connect each family member correctly, which can become difficult to manage as your genogram grows larger.
Step 6. Add More Details and Relationships
- If you want to include more information, such as health history or emotional relationships, you’ll need to manually add text boxes and customize the symbols. PowerPoint doesn’t have pre-built genogram symbols, so this step requires a lot of manual work.
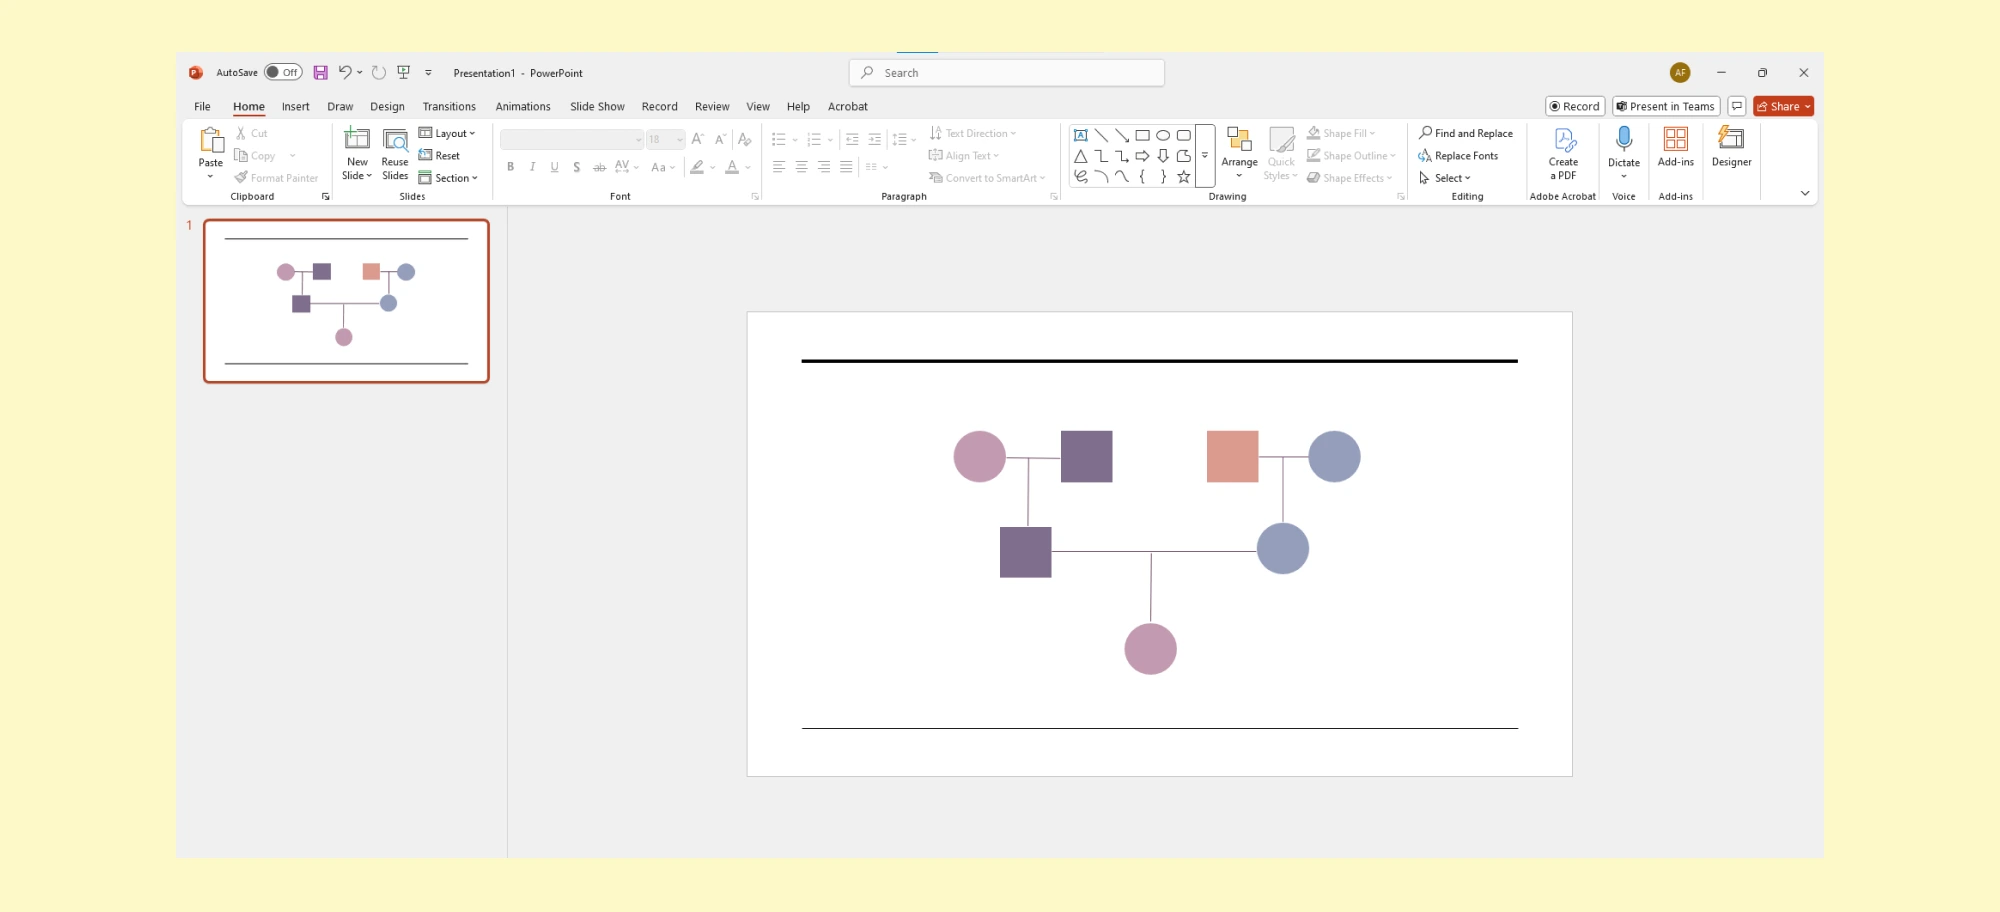
Step 7. Format the Genogram
- Once all your shapes and lines are in place, use PowerPoint’s formatting tools to change the colors, line thickness, and text formatting. This can help make the genogram more readable, though it might take time to get everything aligned properly.
Limitations of PowerPoint in Creating a Genogram
While PowerPoint can be used to create a basic genogram, it has several limitations that make the process tedious once the family structure becomes more detailed. These limitations may not matter if you only need a small, presentation-ready family diagram. They become more noticeable when the genogram needs to be updated, reviewed, expanded, or used for professional documentation.
Lack of Specialized Genogram Symbols
PowerPoint does not come with built-in genogram symbols for representing family relationships, medical conditions, or emotional dynamics. You’ll have to manually create or import symbols, which can be time-consuming and lead to inconsistent designs.
Manual Adjustment of Relationships
Connecting family members with lines or arrows in PowerPoint can become very challenging. Since there’s no built-in understanding of genogram relationship types, you have to manually draw and restyle lines for marriages, divorces, separations, blended families, and emotional dynamics. As the genogram gets more detailed, maintaining consistency becomes difficult.
Limited Template Options
PowerPoint doesn’t offer pre-built genogram templates. Every time you create a new genogram, you start from scratch, spending a significant amount of time setting up the layout and deciding on the design elements.
Lack of Scalability
When working with large families, blended households, or multi-generational histories, PowerPoint becomes hard to manage. Rearranging shapes and connector lines manually can quickly turn the genogram into a cluttered slide, especially when you need to show several generations or more nuanced relationship structures.
No Integration with Data or External Sources
PowerPoint treats a genogram as a visual layout, not as structured family information. If you want to track health history, emotional patterns, legal relationships, or research notes, you need to add everything manually with text boxes or formatting tricks. Updating that information later is slow and error-prone.
Limited Collaboration Features
PowerPoint is not ideal for collaborative genogram work. If multiple people need to review, comment on, or update the same family diagram, version control can quickly become messy. It also lacks the kind of role-based sharing and diagram-focused commenting that are useful when genograms are part of case discussions, client reviews, or classroom work.
Tedious Customization for Complex Genograms
Adding and adjusting elements such as text boxes, shapes, and lines requires significant effort when you need to include a large amount of information or create detailed genograms with multiple layers of data.
When PowerPoint May Still Be Enough
PowerPoint can still be a reasonable option if:
- You only need a simple one-off genogram for a class, workshop, or presentation.
- The family structure is small and does not require many relationship types.
- You already work heavily in PowerPoint and only need a visual slide, not an editable family record.
- Collaboration, structured data, and ongoing updates are not important for this use case.
When to Use Creately Instead of PowerPoint
PowerPoint can work for a simple, one-time genogram. But if you need to keep the diagram updated, show more relationship types, add case details, or collaborate with others, a dedicated genogram tool can save time. Creately is useful in these situations because it gives you templates, genogram symbols, relationship lines, data fields, and sharing options in one workspace.
Ready-Made Genogram Templates
With Creately, you don’t need to start from scratch. It offers a variety of professionally designed genogram templates for different needs—whether you’re creating a family genogram, a medical chart, or tracking emotional relationships. These templates are fully customizable, saving you time while providing a clean, professional layout.
AI-Generated Genograms from Text
If you already have intake notes, case notes, or a written description of a family, you can use AI genogram generation in Creately to create a starter genogram from text. Instead of building the whole structure manually, you can describe the family in plain language and then refine the diagram visually. For PowerPoint users, this can save a huge amount of setup time.
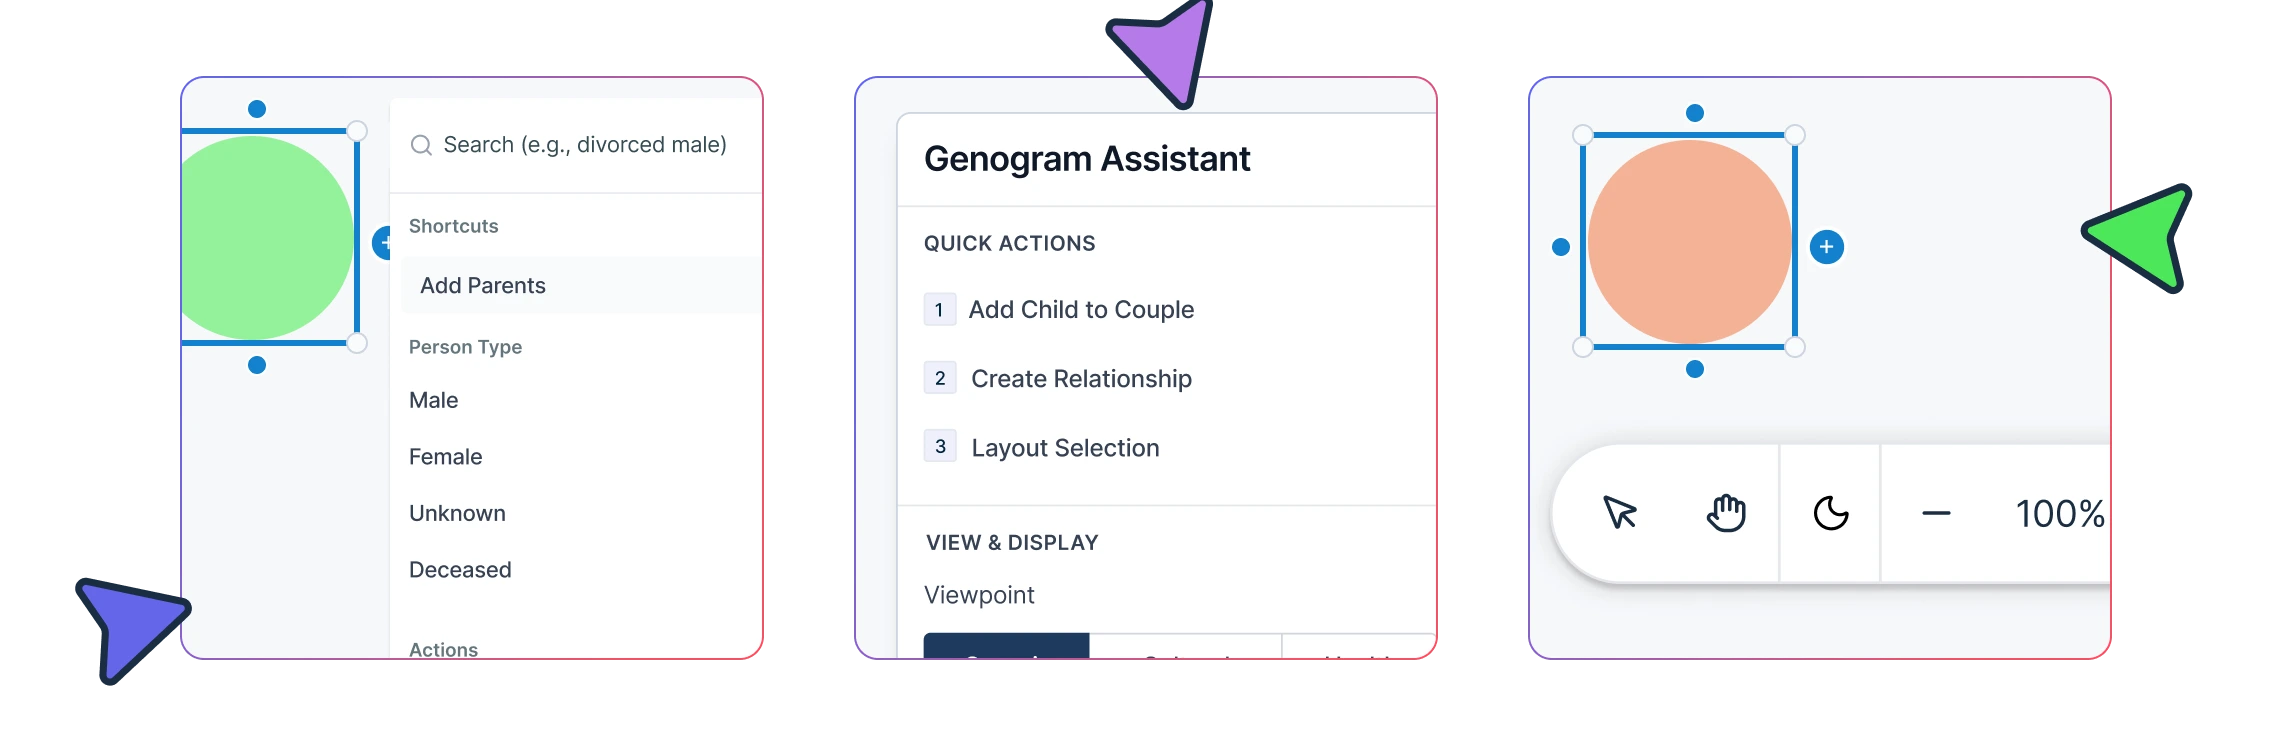
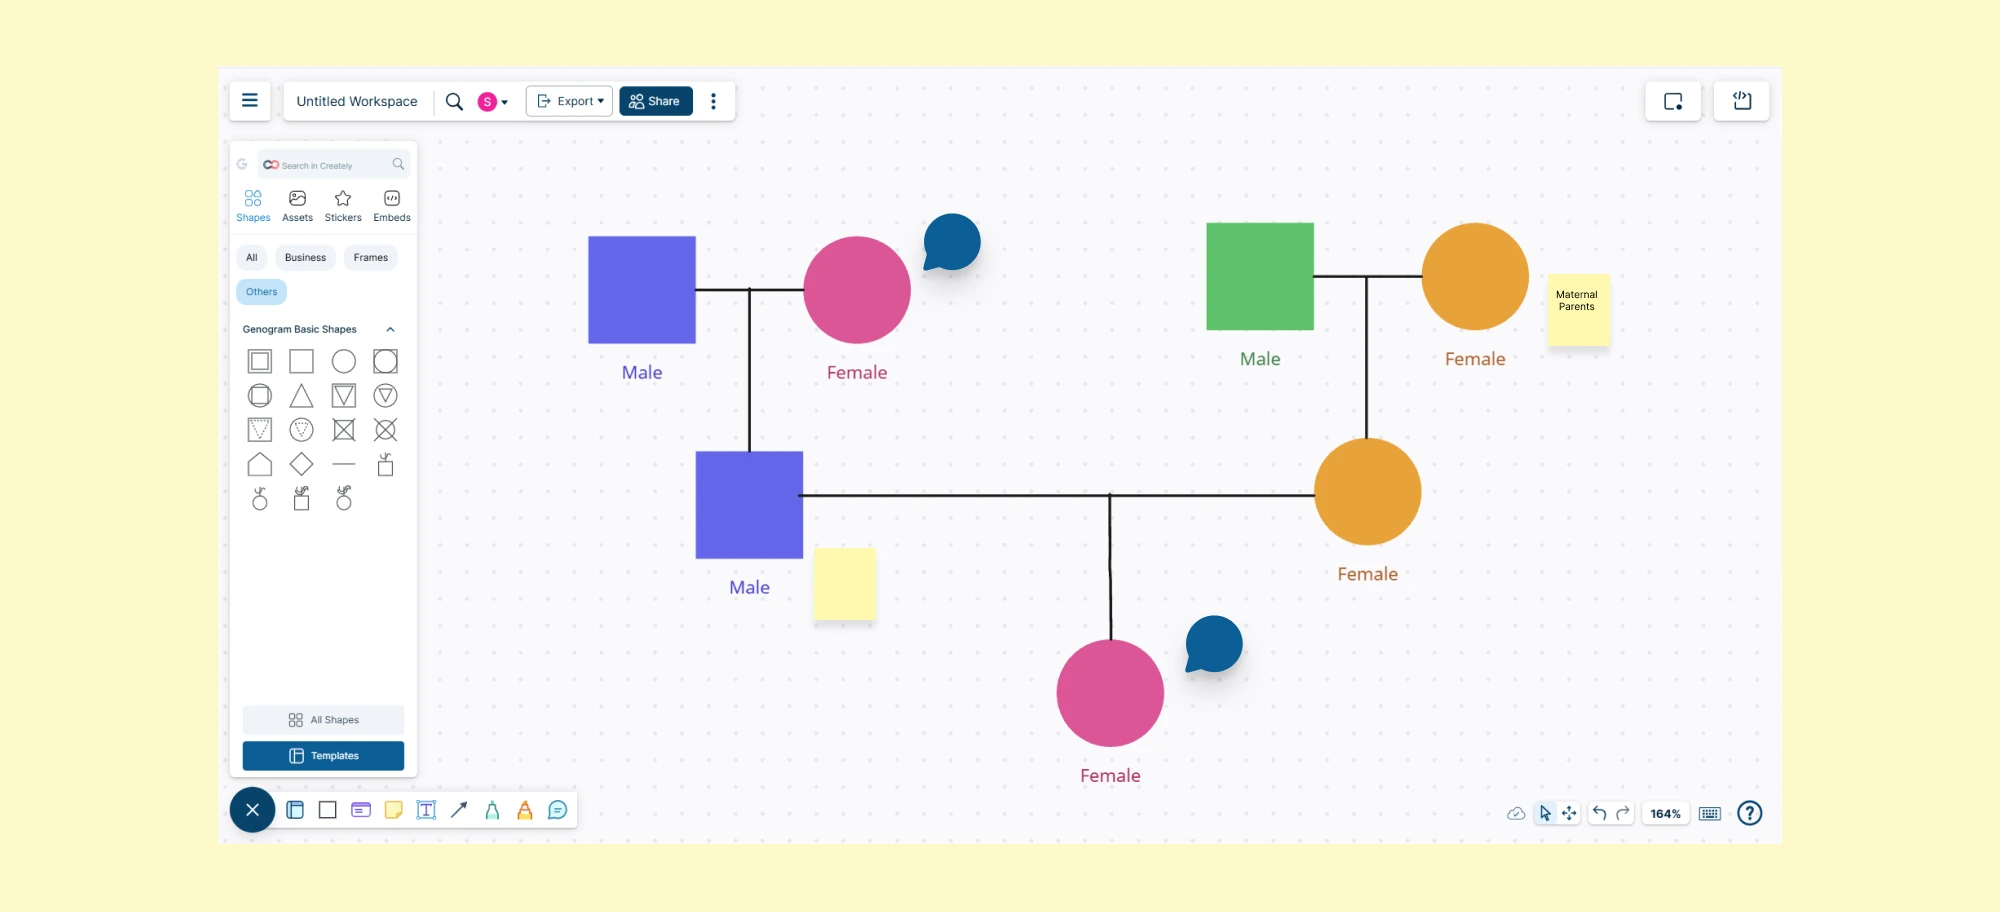
Faster Diagramming With Genogram Symbols and Relationship Lines
Unlike PowerPoint, where shapes and connectors must be drawn and adjusted manually, Creately gives you dedicated genogram symbols, quick-add tools, and relationship lines from the start. This makes it easier to add family members, show marriages, divorces, blended families, foster or adoptive relationships, and emotional dynamics without creating every visual element by hand. As the genogram grows, Creately also helps keep the layout organized, so you spend less time fixing spacing and connectors and more time building an accurate family map.
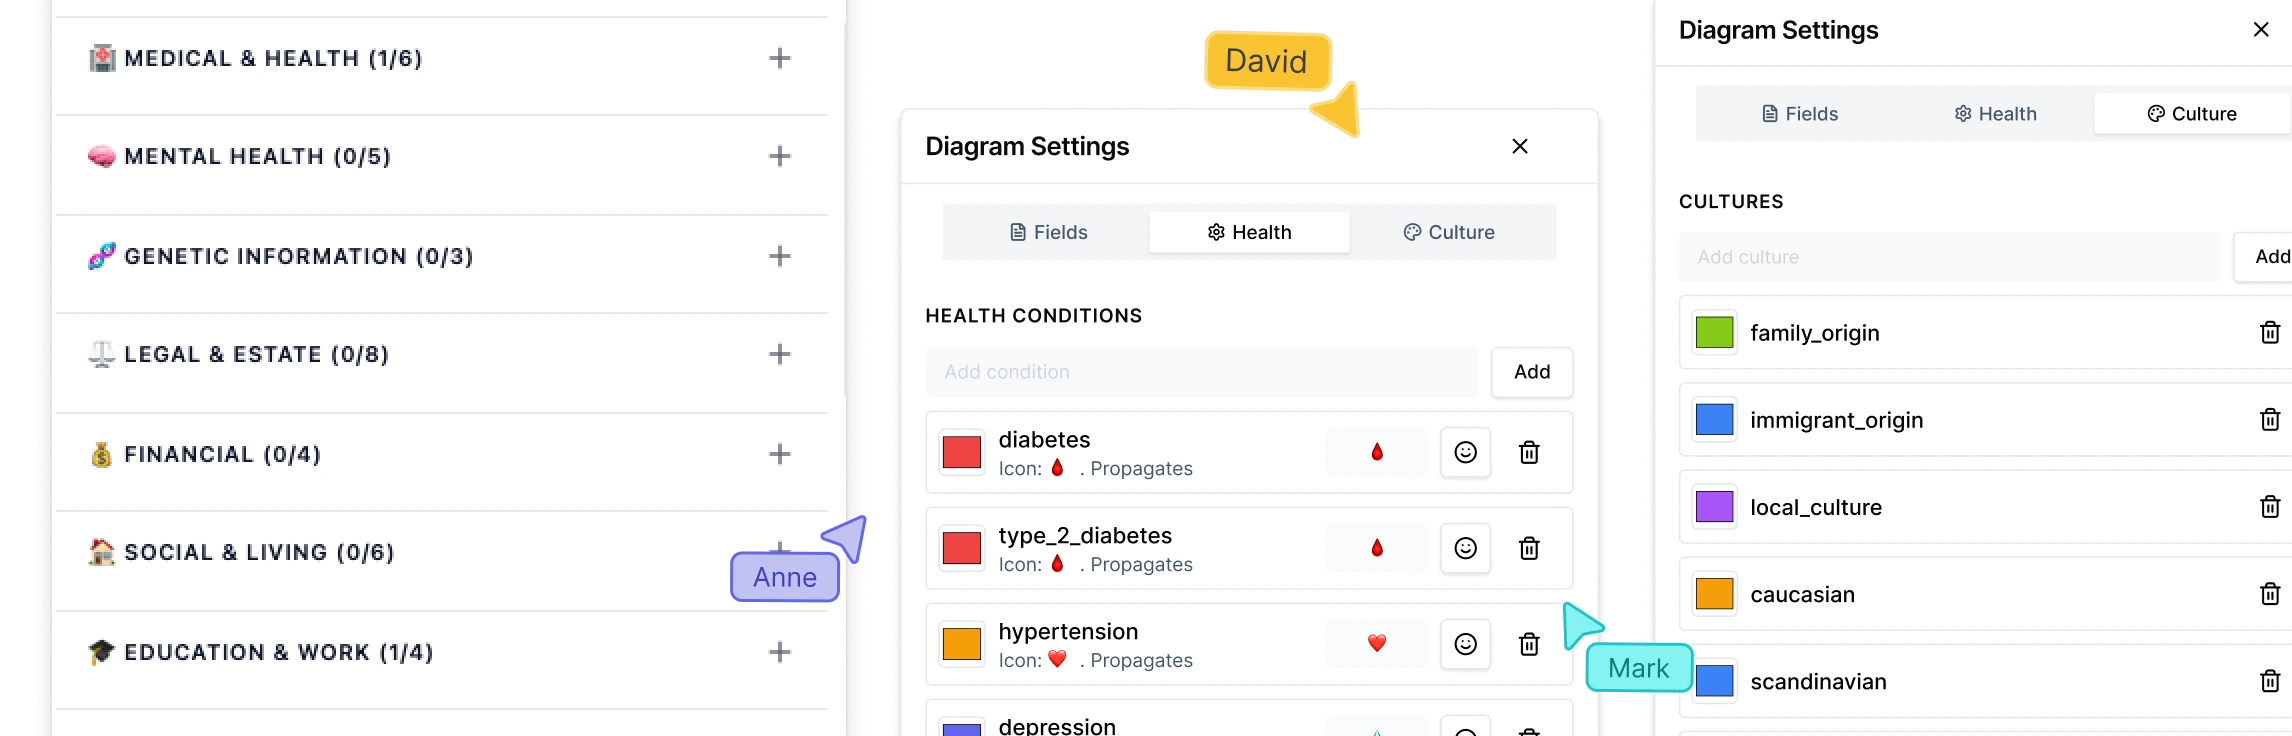
Role-Based Data Fields for Different Use Cases
Creately goes beyond basic diagramming by letting you add structured information based on your use case. You can document medical and genetic history, emotional and therapeutic dynamics, social work information, legal details, or research-related data without cluttering the diagram. This is a big advantage over PowerPoint, where all of that context has to be added manually as disconnected text.
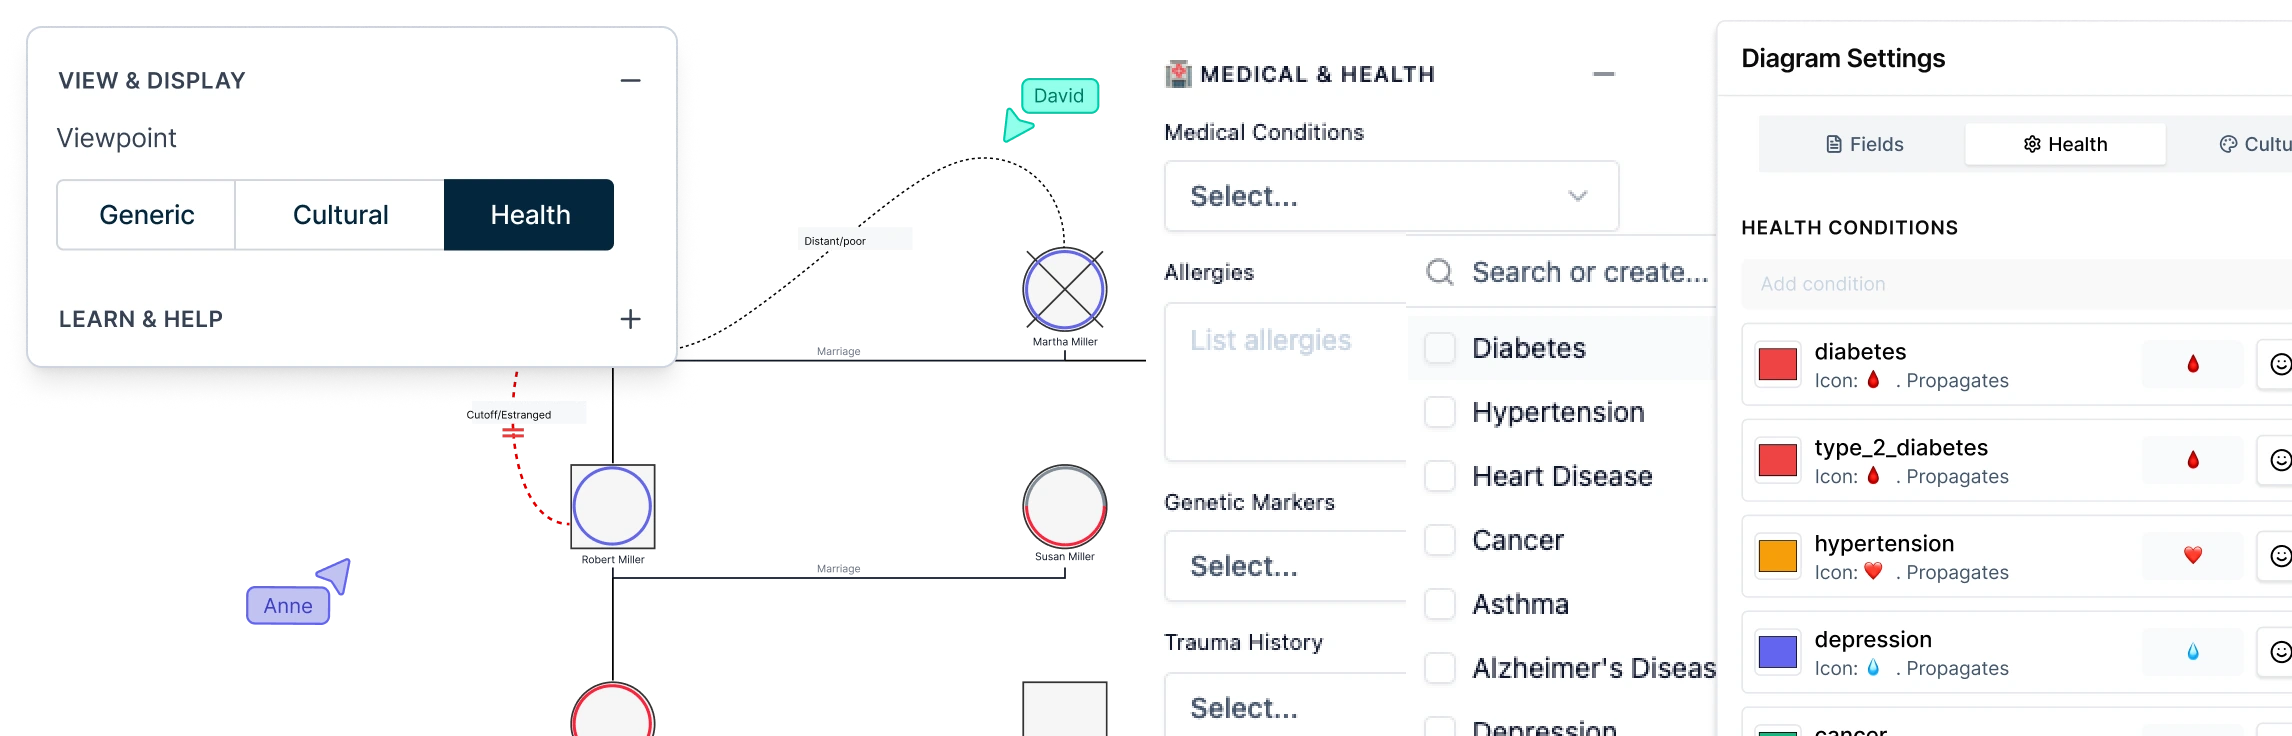
Multiple Views for the Same Genogram
Instead of creating separate versions of the same diagram, Creately lets you view the same genogram through different lenses such as genogram health view, cultural background, relationship dynamics, legal context, and timeline events. That makes it easier to analyze the family from the angle you need without rebuilding the diagram each time.
Real-Time Collaboration and Easy Sharing
Need to work with others on a genogram? Creately supports real-time collaboration, allowing multiple users to edit and comment simultaneously. Whether you’re collaborating with colleagues or working with clients, this feature eliminates version confusion and ensures seamless teamwork.
AI-Assisted Analysis and Pattern Detection
Creately can help you go beyond drawing by surfacing patterns in the genogram. For example, it can help identify hereditary conditions across generations, highlight evidence gaps, and make it easier to spot missing or incomplete family information. That’s especially useful if you’re creating genograms for healthcare, therapy, education, or research.
Simple Export and Download Options
When you’re finished, Creately gives you flexible export and sharing options depending on how you plan to use the genogram. You can export it as PNG for slides, PDF for documentation, DOCX for editable reports, or SVG for crisp large-format printing. You can also share it with others using view-only or editable access, which is much more convenient than sending PowerPoint files back and forth.
Clinical Report Generation for Professional Workflows
For professionals who need more than a visual diagram, Creately also makes it easier to turn a completed genogram into documentation that fits real workflows. You can generate structured reports in PDF or DOCX format for case files, supervision notes, patient documentation, or client records.
How to Make a Genogram With Creately
Creately gives you a dedicated workspace for building genograms with templates, AI-assisted generation, genogram symbols, relationship lines, structured data, collaboration, and export options. Here’s how to create and refine a genogram in Creately.
Step 1: Start a New Genogram
Log in to Creately and create a new workspace. You can start with a blank canvas, choose a ready-made genogram template, or generate a starter genogram from a written family description if you already have notes to work from.
Step 2: Choose a Template or Use AI
Select a template for the type of genogram you need, such as a family genogram, medical genogram, or emotional relationship genogram. If you prefer not to start manually, describe the family structure in plain text and use AI to create the first draft, then review and edit it before finalizing.
Step 3: Add Family Members
Use Creately’s genogram symbol library to add family members with standard shapes. Quick-add tools and shortcuts help you add connected relatives such as partners, children, parents, and siblings without recreating each connection from scratch. Add names, dates, and other basic details directly to each person.
Step 4: Connect Relationships
Use genogram relationship lines to show how people are connected. You can represent marriages, divorces, separations, blended families, adoptive relationships, foster relationships, and emotional dynamics with relationship types designed for genograms instead of generic presentation lines.
Step 5: Add Context and Structured Details
Add more context where needed, such as medical history, emotional relationships, social background, legal details, research notes, or case information. Creately’s structured fields, notes, and attachments help keep supporting information connected to the genogram without overcrowding the main diagram.
Step 6: Review the Genogram With Focused Views
Use focused views, such as Health View, to review specific patterns without rebuilding the same genogram. This is useful when you want to look at medical history, relationship dynamics, cultural context, or other layers separately while keeping the family structure connected.
Step 7: Clean Up the Layout
Review the layout for readability. Adjust spacing, align family groups, and make sure relationship lines are easy to follow. This is especially important for large, blended, or multi-generational families where the diagram can become difficult to read.
Step 8: Collaborate and Review
Invite others to view, comment, or edit the genogram if it needs input from a team, supervisor, classmate, or client. Use access controls to decide whether collaborators can only view the diagram or make changes.
Step 9: Export, Share, or Generate Documentation
Export the genogram as PNG, PDF, SVG, or DOCX depending on how you plan to use it. You can also generate report-ready documentation or share the genogram with a link so others can review the latest version without exchanging separate files.
Genogram Examples Made with Creately
Creately makes it easier to create different kinds of genograms for different use cases. Whether you’re building a family overview, documenting medical histories, or analyzing emotional relationships, the examples below show how templates can speed up the starting point.
1. Family Genograms
A family genogram is one of the most common types, used to illustrate family relationships and genetic health patterns across multiple generations.


2. Medical Genograms
A medical genogram tracks hereditary conditions and health information within a family. This type of genogram is particularly helpful in healthcare settings, enabling doctors or healthcare professionals to quickly spot patterns of medical conditions within families.


3. Emotional Relationship Genograms
An emotional relationship genogram maps out the emotional dynamics between family members, such as closeness, tension, and conflict. This type of genogram is useful in family therapy and social work.


Helpful Resources
Discover everything you need to know about genograms, from what they are, how to create a genogram, to how to understand what they mean.
Explore our collection of genogram templates.
Learn how different types of genograms can help visualize important aspects of life.
Explore the essential symbols used in genograms to represent everything from basic family structures to complex emotional and medical relationships.
Final Thoughts
PowerPoint can help you make a genogram when you need a quick visual and do not mind building it manually. But if you need a diagram that is easier to update, easier to share, and better suited to complex family structures, a dedicated tool is usually the more practical choice. Creately is one option when you want templates, relationship-aware symbols, AI-assisted starting points, and more flexible ways to present the same genogram across different workflows.
FAQs on How to Create a Genogram in PowerPoint
Can I create a genogram in PowerPoint?
What are the limitations of making a genogram in PowerPoint?
Why is Creately a better tool for making genograms?
Can Creately generate reports from a genogram?
Do I need any special add-ins to make a genogram in PowerPoint?
Can I find genogram templates in PowerPoint?
What symbols are used in a PowerPoint genogram?
Is PowerPoint suitable for professional genograms?
Can beginners create genograms in PowerPoint easily?
Can Creately create a genogram from a written family description?
Does Creately support more advanced genogram relationships than PowerPoint?
Resources:
Alexander, J.H., Callaghan, J.E.M. and Fellin, L.C. (2018). Genograms in research: participants’ reflections of the genogram process. Qualitative Research in Psychology, 19(1), pp.1-21. doi:https://doi.org/10.1080/14780887.2018.1545066.
Butler, J.F. (2008). The Family Diagram and Genogram: Comparisons and Contrasts. The American Journal of Family Therapy, 36(3), pp.169-180. doi:https://doi.org/10.1080/01926180701291055.
Puhlman, D., Shigeto, A., Murillo Borjas, G.A., Maurya, R.K. and Vincenti, V.B. (2023). Qualitative genogram analysis: A methodology for theorizing family dynamics. Journal of Family Theory & Review, 15(2), pp.276-291. doi:https://doi.org/10.1111/jftr.12496.