Free Infographic Maker
Create Professional Infographics Online to Visualize Complex Data
Generate interactive infographics with Creately’s easy-to-use infographic creator. Customize templates, collaborate with your team, and illustrate complex data or information.
- Comprehensive shape library with drag-and-drop design elements
- Collaborate in real time on an infinite canvas with your team
- Export infographics as PDF, SVG, PNG, & JPEG, fast and easy
 Diagramming
 Visual Collaboration
 Org Chart









Transform Data into Stunning Infographics with Our Online Infographic Maker
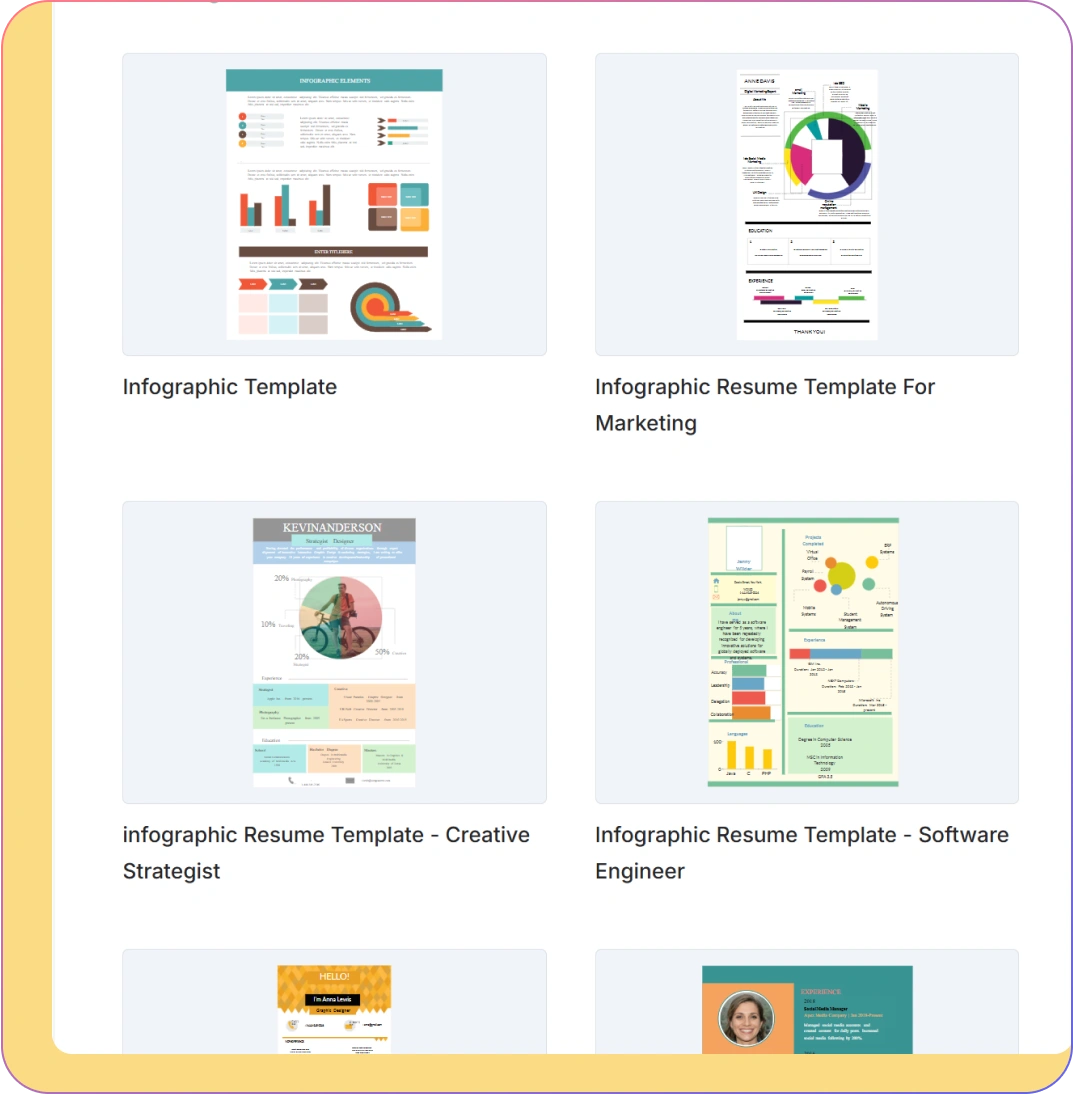
Access professionally-designed infographic templates to create visuals effortlessly.
Use diagramming shortcuts and Plus Create to design infographics fast and easily.
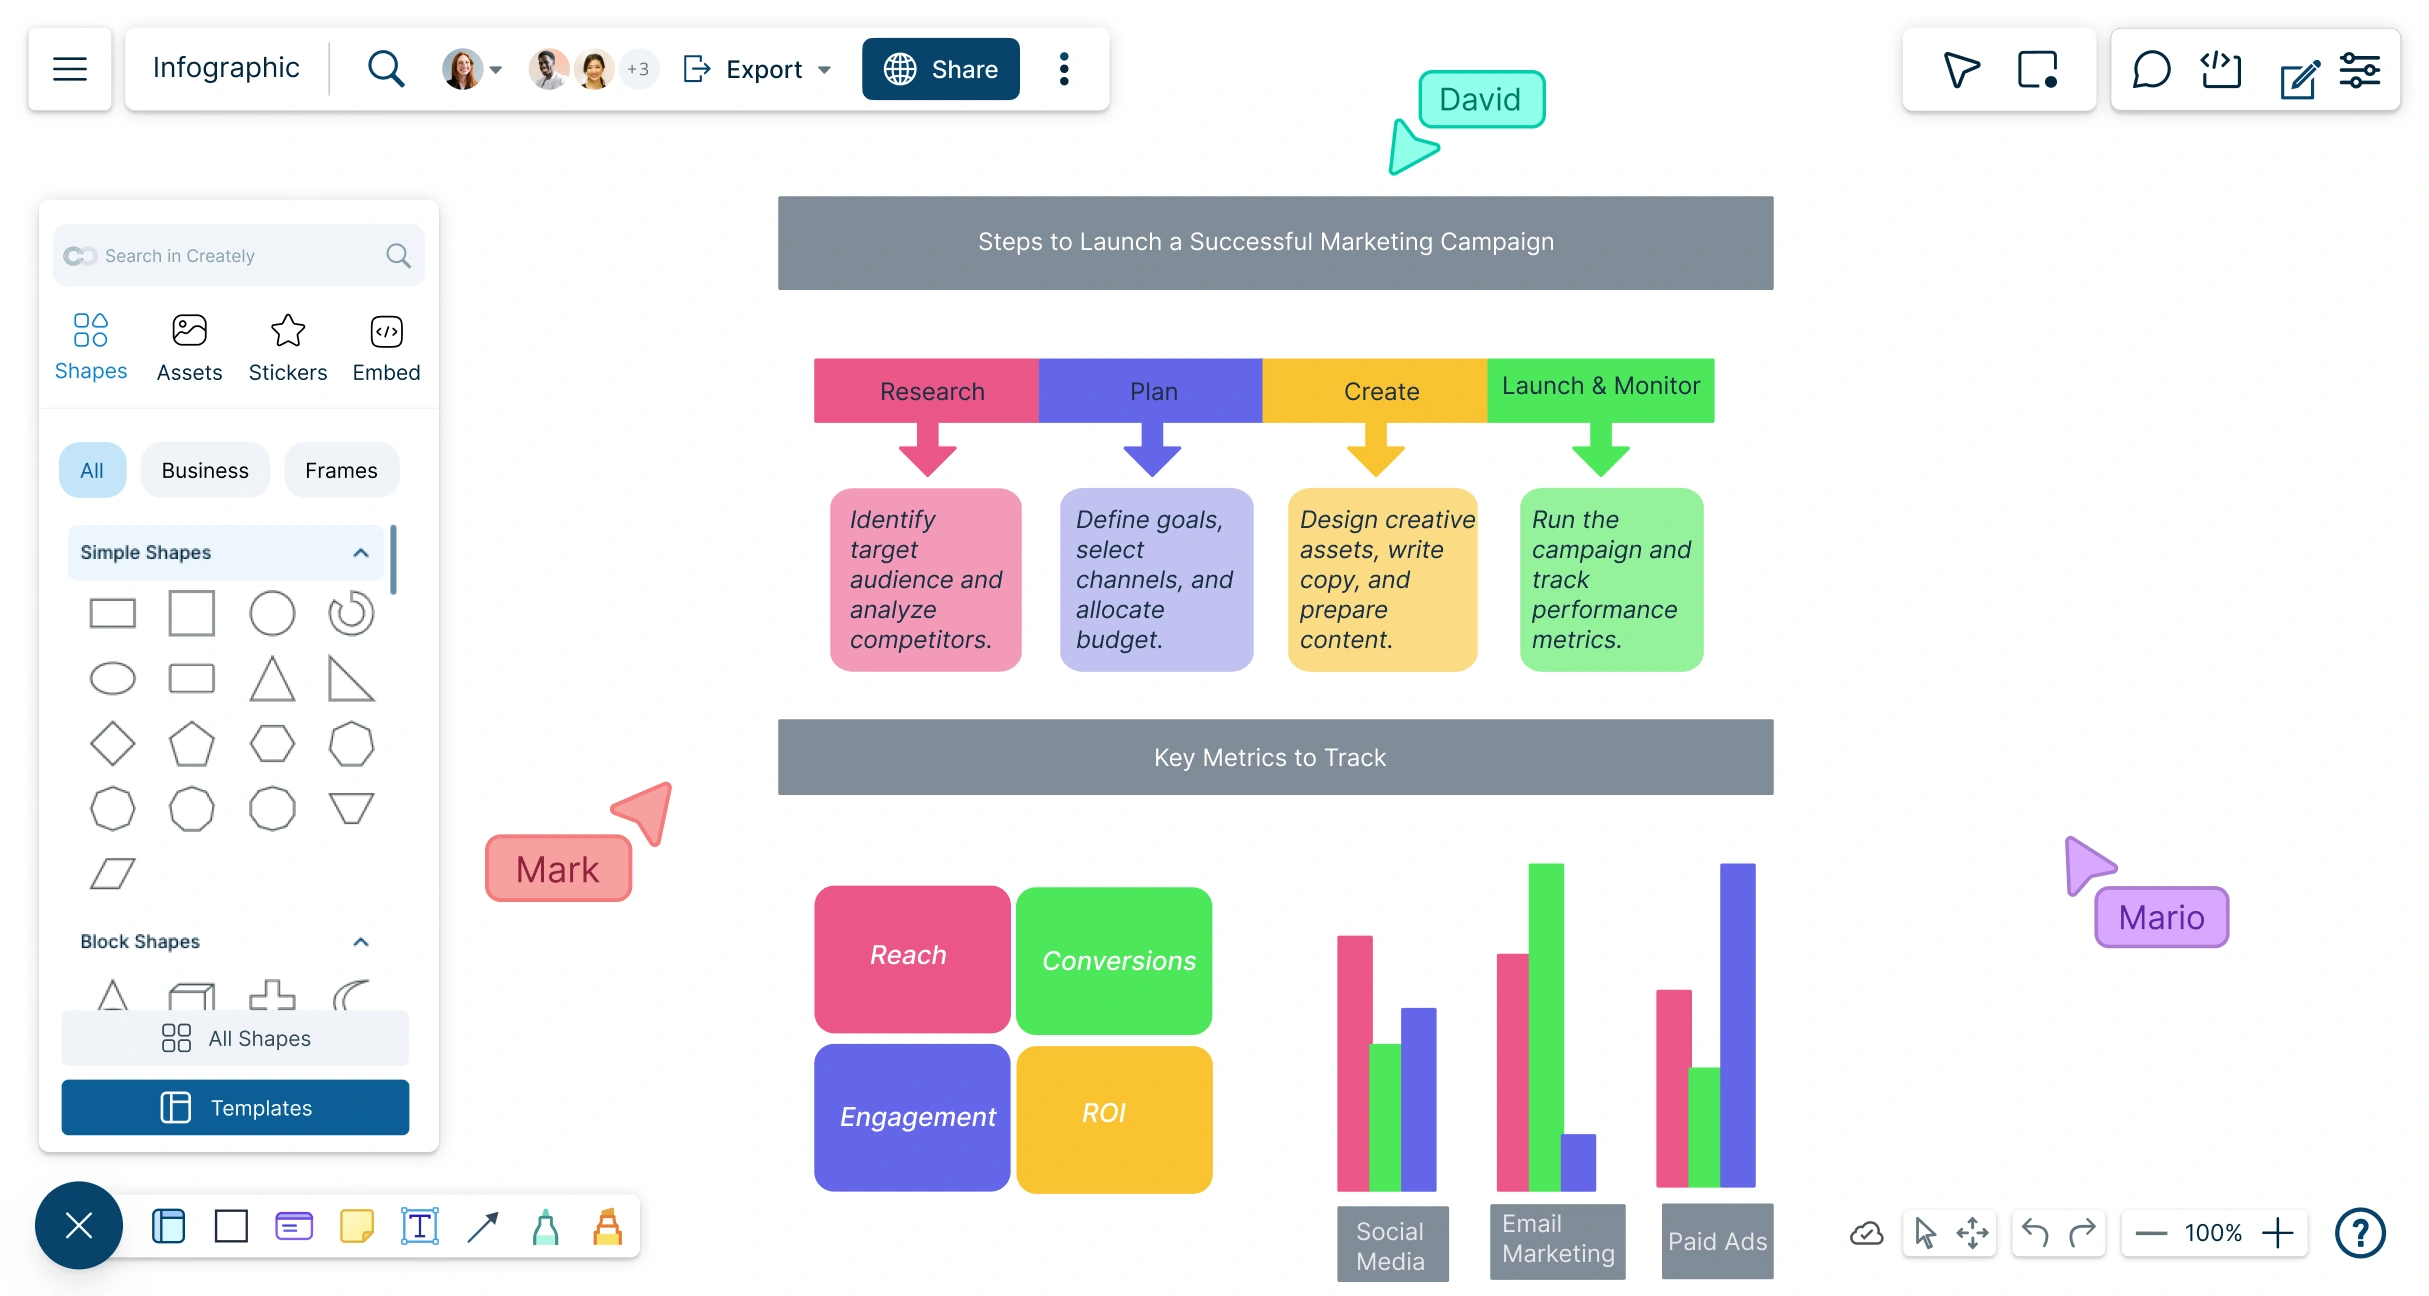
Drag-and-drop shapes, text, and images onto an infinite canvas for fully customizable layouts.
Bring your data to life with an easy-to-use infographic creator, no design skills needed.

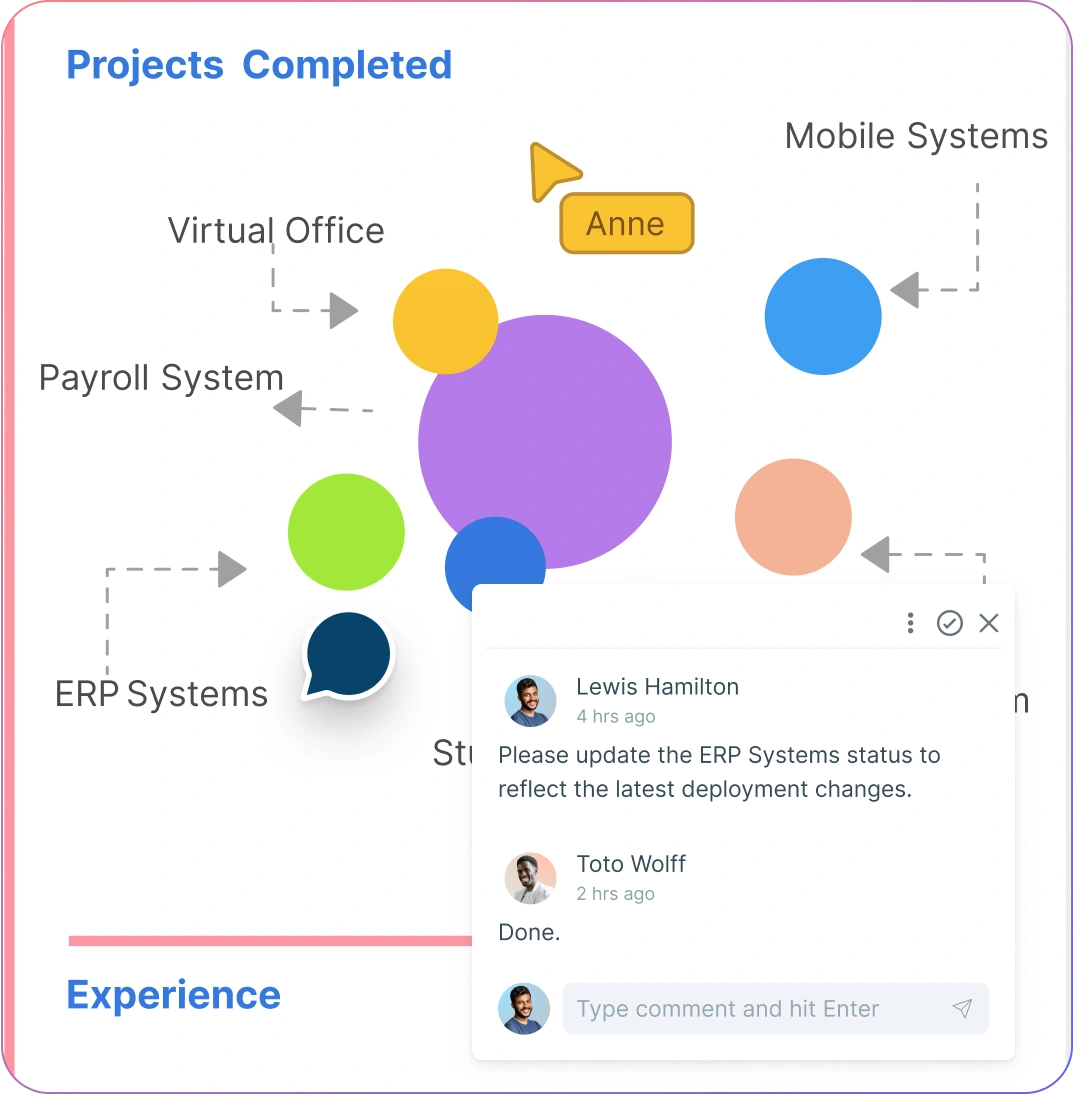
Create and Collaborate on Infographics in Real Time

Collaborate in real time using Creately’s infographic generator—brainstorm, discuss, and co-create with your team.
Get instant feedback with inline comments and @mentions to refine your infographic designs effortlessly.
Asynchronous editing made easy with color-coded cursors, contextual comments, and secure sharing with access control.
Work seamlessly online and keep your team in sync while creating professional infographics together.
Track, Analyze, and Share Infographics with Ease
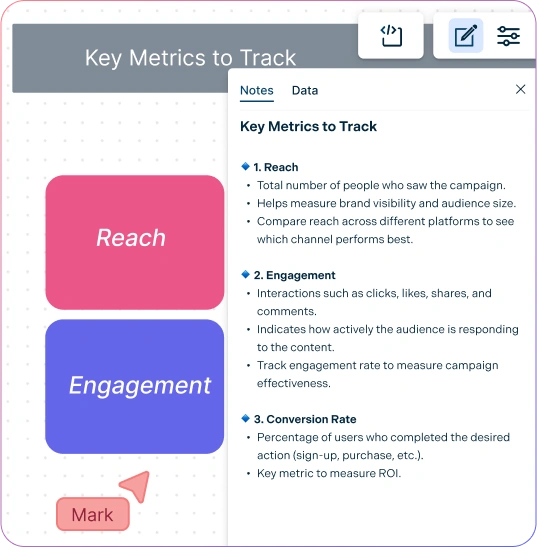
Add rich information to your infographics using the notes panel—attach images, links, and multimedia for context.
Manage teams and permissions effortlessly while working on group projects, delegating tasks, and tracking progress.
Export or embed anywhere: PNG, JPEG, SVG, PDF, or directly integrate your infographic into websites.
Turn data into actionable visuals with an easy-to-use infographic maker that simplifies sharing and analysis.

What Is an Infographic?
How to Make an Infographic with Creately
Launch Creately and Open Your Workspace
Sign in to Creately and open your workspace to start a new infographic project. Access your team’s shared workspace for real-time collaboration.
Choose a Template or Start from Scratch
Select from easy-to-customize infographic templates or create your layout with smart shapes. Use the comprehensive shape and icon library to speed up design.
Add Data and Multimedia with the Notes Panel
Attach images, links, charts, and sticky notes directly to shapes using the notes panel. Organize your information clearly for maximum impact.
Collaborate and Customize
Work with your team using real-time collaboration, @mentions, and inline comments. Customize colors, fonts, charts, and layouts to make your infographic professional and engaging.
Review, Update, and Share
Check your infographic for clarity and accuracy. Export in PNG, JPEG, SVG, or PDF, or embed it directly on websites. Share with your team or publish instantly.
Create an InfographicCreate Your Infographics Online with These Free Editable Templates
FAQs About Infographics
What are the types of infographics?
Infographics can be categorized into 07 most common types depending on their goal, the type of information being visualized, and the target audience. With Creately’s infographic maker, you can create these and share them easily:
Statistical infographics represent numerical data about a certain subject. For example, it can be a date on the population census of a country.
Informational infographics are best to present a summarized overview of a concept or a theory.
Timeline infographics help illustrate events in chronological order which is suitable for project timelines or historical data.
Process infographics can be used to present a summary of steps in a process. This help highlight key information on each step in a clear and concise manner.
Geographic infographics are best for presenting demographic information or data and stats that are based on a location.
Comparison infographics help you to compare multiple options or scenarios clearly with side-by-side visuals.
Hierarchical infographics help show organizational structures or ranked data with an easy-to-follow hierarchy.
What makes a good infographic?
- Clear focus on one main topic and message.
- Use of visuals, such as diagrams and illustrations, to aid comprehension and retention.
- A balanced layout with a mix of text and imagery to guide the viewer through the information.
- Accurate and relevant data to support the infographic’s message.
- A design that is accessible and engaging to the target audience.
What are the benefits of using infographics?
Here are some of the benefits of using infographics.
- Enhanced comprehension by presenting information visually and structurally.
- Increased engagement with content due to the appealing visual format.
- High shareability on social media and other platforms, boosting reach and exposure.
- Potential to improve SEO through high-quality, informative content.
Can I export my infographic without losing quality?
Can I track changes made to my infographic?
Can beginners use Creately to make infographics?
Can I integrate feedback directly into my infographic?
Is Creately’s Infographic Maker Free?
What is the best infographic maker?
Creately’s infographic maker is widely regarded as one of the best infographic tools available. Trusted by professionals worldwide, it combines ease of use, powerful features, and real-time collaboration to help you create professional infographics in minutes, not months.
Key features that set Creately apart:
- Comprehensive shape and icon libraries with drag-and-drop functionality.
- Easy-to-customize templates for statistical, process, timeline, comparison, and hierarchical infographics.
- Real-time team collaboration, inline comments, and @mentions for seamless workflow.
- Notes panel and sticky notes to add data, links, and multimedia directly onto shapes.
- An infinite canvas to organize complex information without restrictions.
- Multiple export options, including PNG, JPEG, SVG, and PDF.
Professionals across industries—including marketing, education, social media, and business analytics—recommend and actively use Creately for creating interactive and visually engaging infographics. Its combination of speed, simplicity, and collaborative features makes it the preferred online infographic maker for teams and individuals alike.


