Context Diagram Maker
Understand Systems Better with Our Online Context Diagram Maker
Effectively visualize and clarify the context and boundaries of systems to be modeled using our context diagram software.
Comprehensive data flow and database diagram shape libraries.
Drag and drop interface for easy context diagram creation and modeling.
Multiple context diagram templates to help identify & analyze system flows.


 Diagramming Visual Collaboration Org Chart


How to Create a Context Diagram with Your Team?
Open a Context Diagram Template
Launch Creately, create a workspace, and pick a Context Diagram template. Capture the system scope, objectives, and stakeholders in the Notes Panel (or sticky notes) so everyone starts aligned.
Add System Information
Add findings from stakeholder interviews, existing docs, and process observations using sticky notes, attachments, and links. List key information flows (forms, emails, calls, reference materials) as quick references beside the canvas.
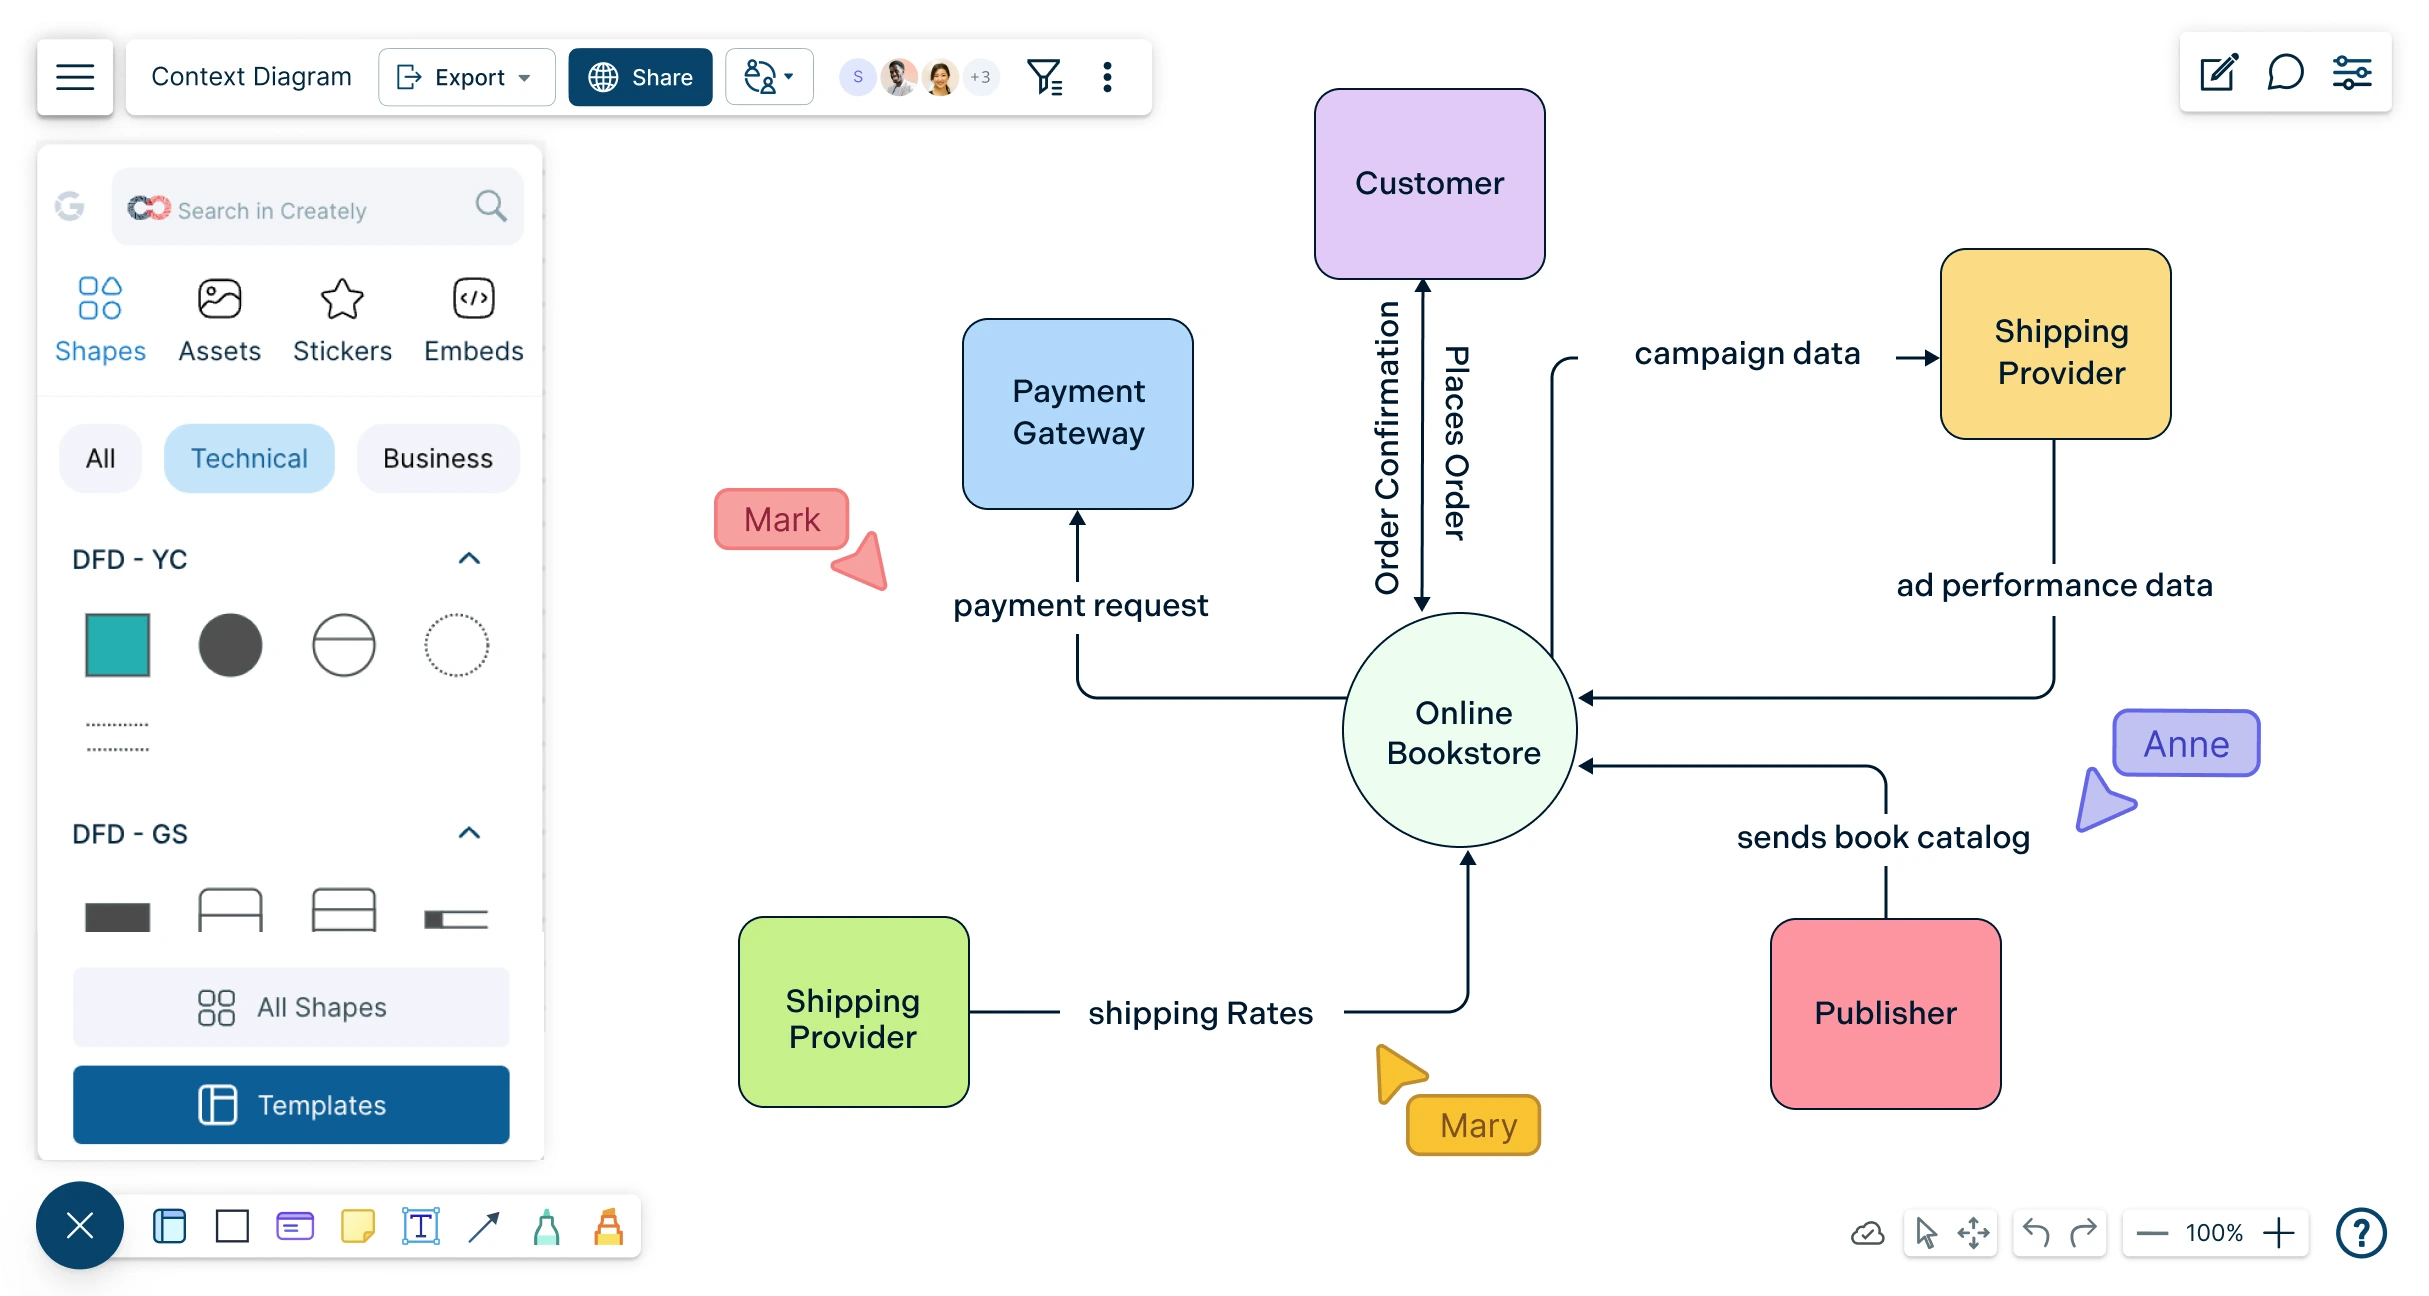
Add the System, Entities & Data Flows
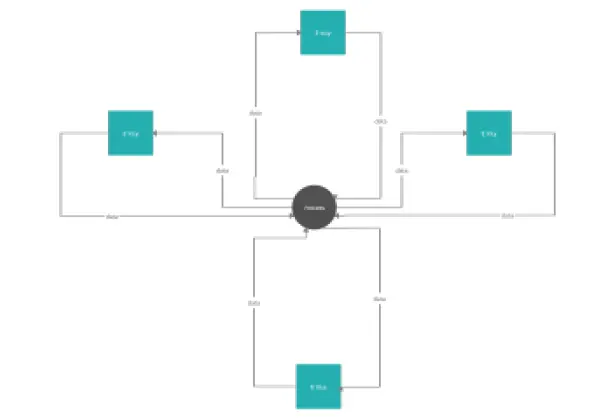
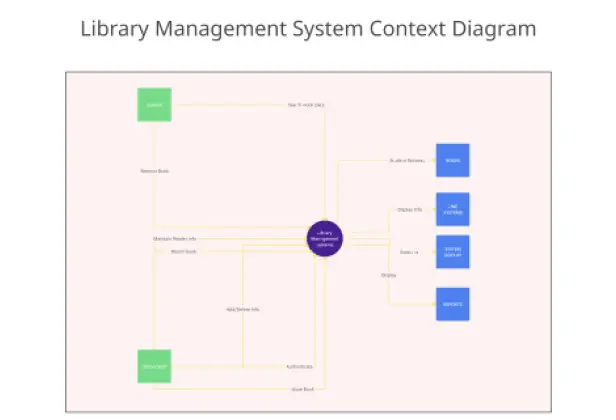
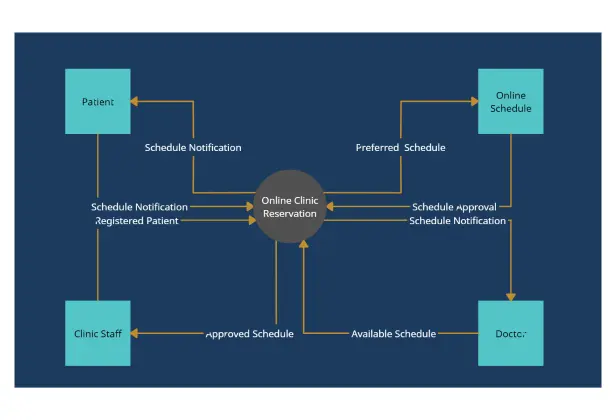
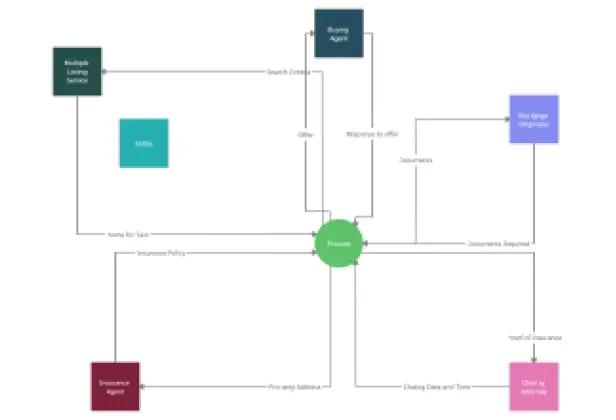
Place a labeled process box for the system in the center. Arrange external entities (users, systems, departments) around it and draw data-flow connectors to show inputs/outputs. Label each flow clearly (what data moves, in which direction).
Customize for Clarity
Tidy the layout with drag-and-drop, then use colors, line styles, and icons to group entities and differentiate flow types. Add a small legend/key and use comments/@mentions to clarify assumptions or open questions.
Review, Update & Share
Share a secure link with view/edit permissions for stakeholder review, iterate with in-line comments, and track versions. Export as PDF, SVG, PNG, or JPEG, or embed the context diagram. Make sure to keep it updated in Creately as the system evolves.
Easy Tools for Faster Systems Design with our Context Diagram Generator

Design easily with simple to use drag-drop tools and Plus Create in our context diagram creator.
Visualize data flows and system processes with multiple context diagram templates.
Industry-standard shape libraries for data flows, network diagrams, and more.
Highlight and label with configurable color themes and advanced text formatting in our context diagram design tool.

Improve Your Design and Analysis Processes with our Context Diagram Drawing Tool
Centralize key details by embedding documents and assets with in-app previews as you create context diagrams.
Capture information. Add docs, attachments, links, and more via the notes panel of our context diagram tool.
Share, review and edit with stakeholders. Use multiple access and role levels in our online context diagram maker.
Collaborate with Your Team, Anytime, Anywhere using our Best Context Diagram Tool

Gather insights, investigate and create context diagrams together using built-in brainstorming tools like mind maps.
Have discussions and follow-ups on the same canvas with @mention comments.
Share with anyone via an email or link invite to collaborate on context diagrams.
Streamline reviewing and revising with version history to save and revert back
What is a Context Diagram?

How to Create a Context Diagram with Your Team?
Open a Context Diagram Template
Launch Creately, create a workspace, and pick a Context Diagram template. Capture the system scope, objectives, and stakeholders in the Notes Panel (or sticky notes) so everyone starts aligned.
Add System Information
Add findings from stakeholder interviews, existing docs, and process observations using sticky notes, attachments, and links. List key information flows (forms, emails, calls, reference materials) as quick references beside the canvas.
Add the System, Entities & Data Flows
Place a labeled process box for the system in the center. Arrange external entities (users, systems, departments) around it and draw data-flow connectors to show inputs/outputs. Label each flow clearly (what data moves, in which direction).
Customize for Clarity
Tidy the layout with drag-and-drop, then use colors, line styles, and icons to group entities and differentiate flow types. Add a small legend/key and use comments/@mentions to clarify assumptions or open questions.
Review, Update & Share
Share a secure link with view/edit permissions for stakeholder review, iterate with in-line comments, and track versions. Export as PDF, SVG, PNG, or JPEG, or embed the context diagram. Make sure to keep it updated in Creately as the system evolves.
Create Your Context Diagram with Editable Templates
FAQs About Context Diagrams
What should a context diagram include?
Are context diagrams the same as data flow diagrams?
What are the various levels of Context diagrams?
There are usually 3 levels of Context diagrams
Level 0 context diagrams are the highest level of context diagrams and show a system in the context of its environment. They provide a broad overview of the system and its relationships with external entities.
Level 1 context diagrams are more detailed than level 0 context diagrams, and show more of the internal components of the system. They provide a more detailed view of the system and its interactions with external entities.
Level 2 context diagrams are even more detailed than level 1 context diagrams, and show the relationships between the internal components of the system in more detail. They provide a very detailed view of the system and its interactions with external entities.
In general, context diagrams can be created at different levels of detail to provide a clear view of the system at different levels of abstraction. The level of detail in a context diagram should be appropriate for the needs of the audience and the purpose of the diagram. Our context diagram generator supports creating diagrams at all these levels.
Can you link context diagrams with other data flow diagrams?