Compare and Contrast Maker
Easily Compare Concepts and Ideas
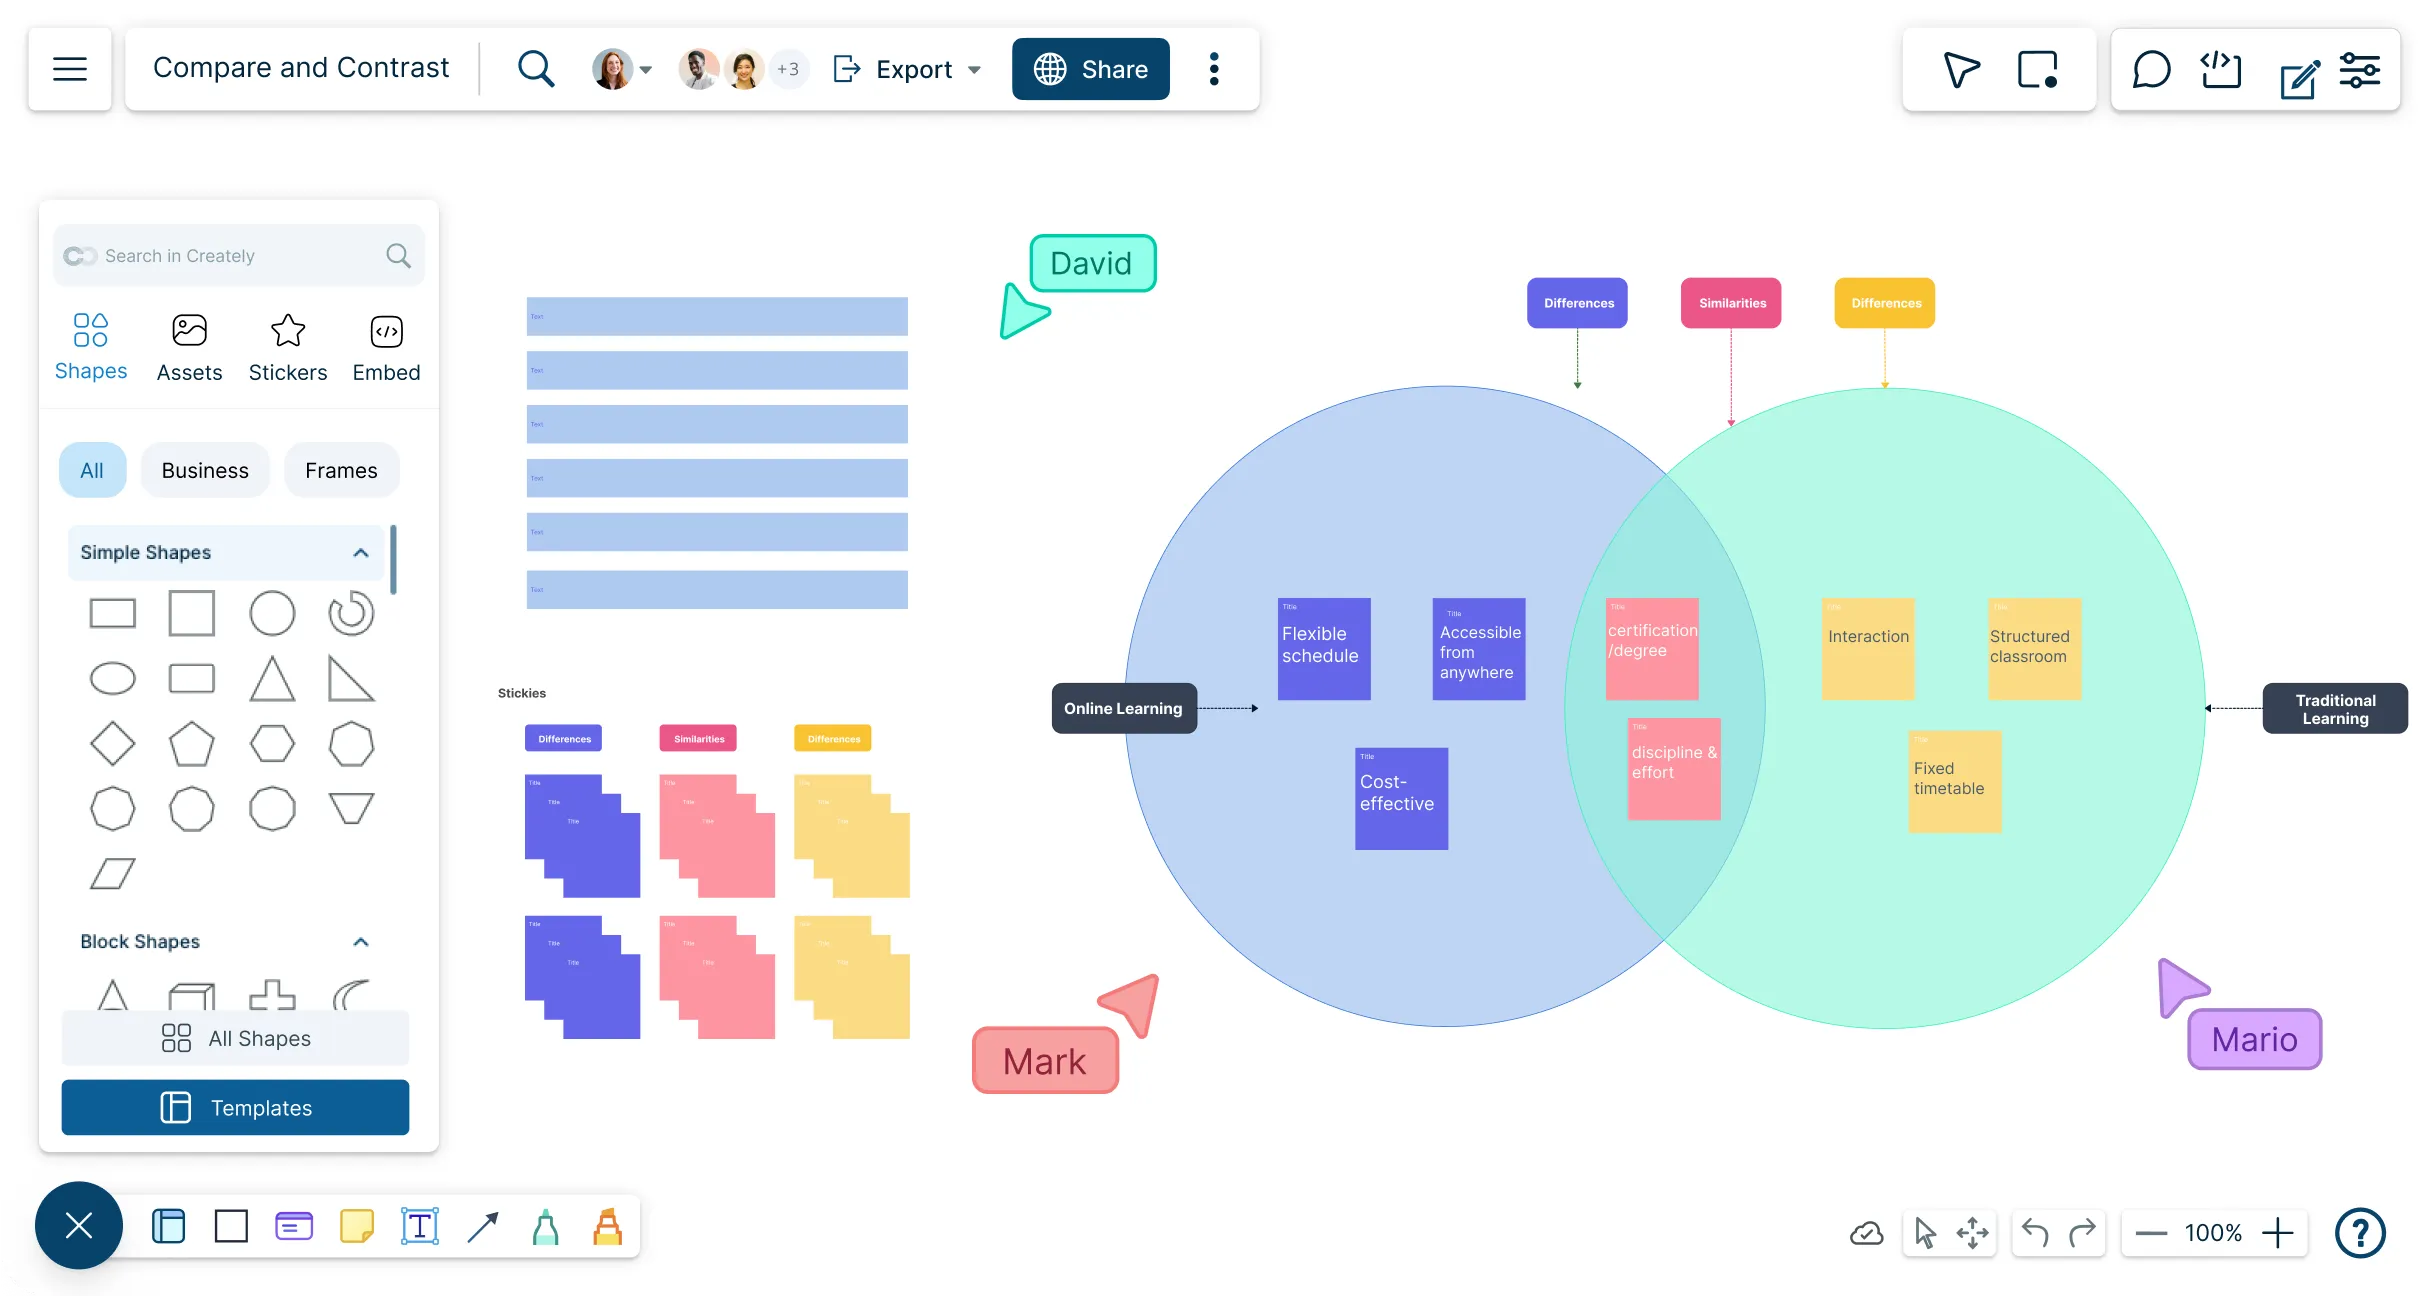
Visualize similarities and differences in one workspace with Creately’s Compare and Contrast Chart Maker to map ideas, brainstorm, and present clearly.
Intuitive drag-and-drop interface to arrange ideas
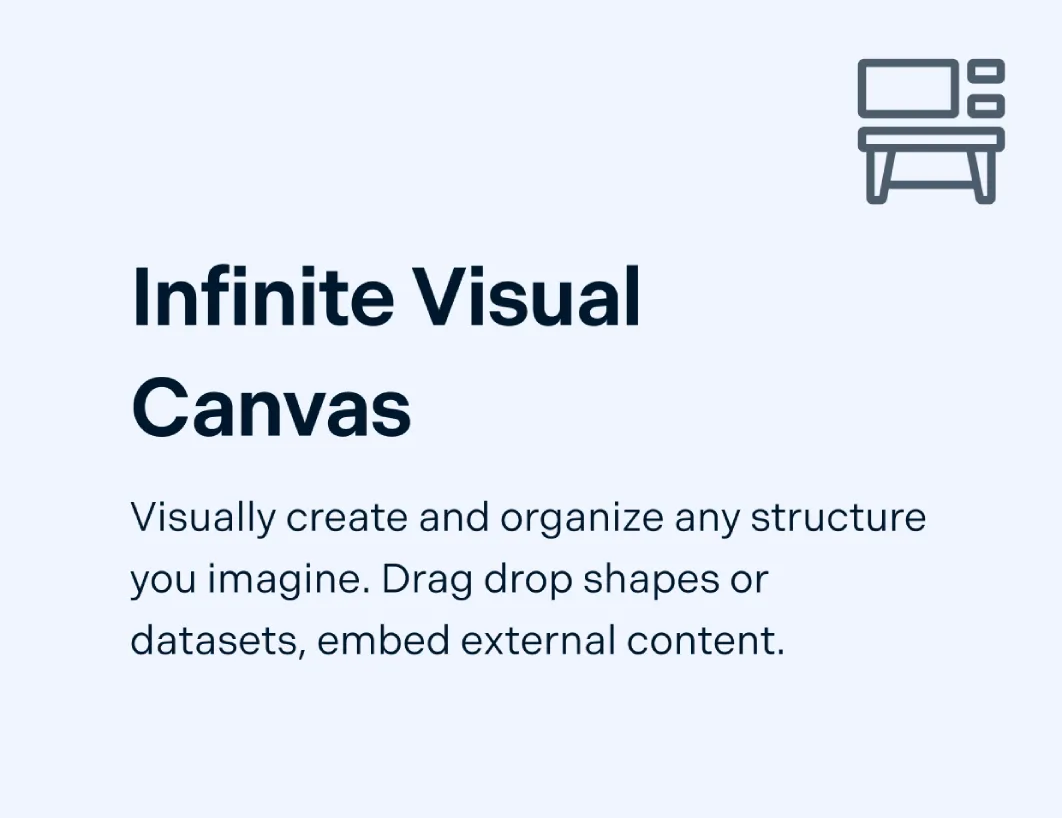
Infinite canvas for brainstorming without limits
Real-time multi cursors and asynchronous editing


 Diagramming Visual Collaboration Org Chart


How to Create a Compare and Contrast Chart?
Help Make Informed Decisions

Quickly jot down ideas with sticky notes and whiteboarding tools
Scale up to thousands of ideas in one view using the infinite canvas
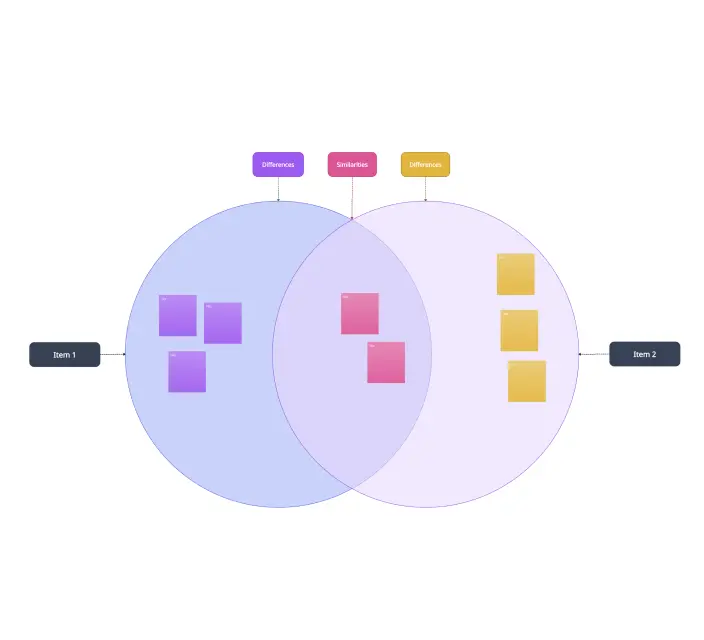
Drag and drop concepts into Venn diagrams, T-charts, or custom layouts
Use color coding, tags, and frameworks to sort similarities and differences

Discuss the Thoughts Behind the Ideas
Brainstorm in real time with multi-user collaboration and live cursors
Comment directly on items to add context or feedback
Share your comparison chart securely via links or export as PNG, SVG, PDF, or JPEG
Work seamlessly with integrations like Google Drive, Confluence, and Slack
Sort Ideas to Compare and Contrast

Structure ideas with frames to create step-by-step lesson plans or presentations
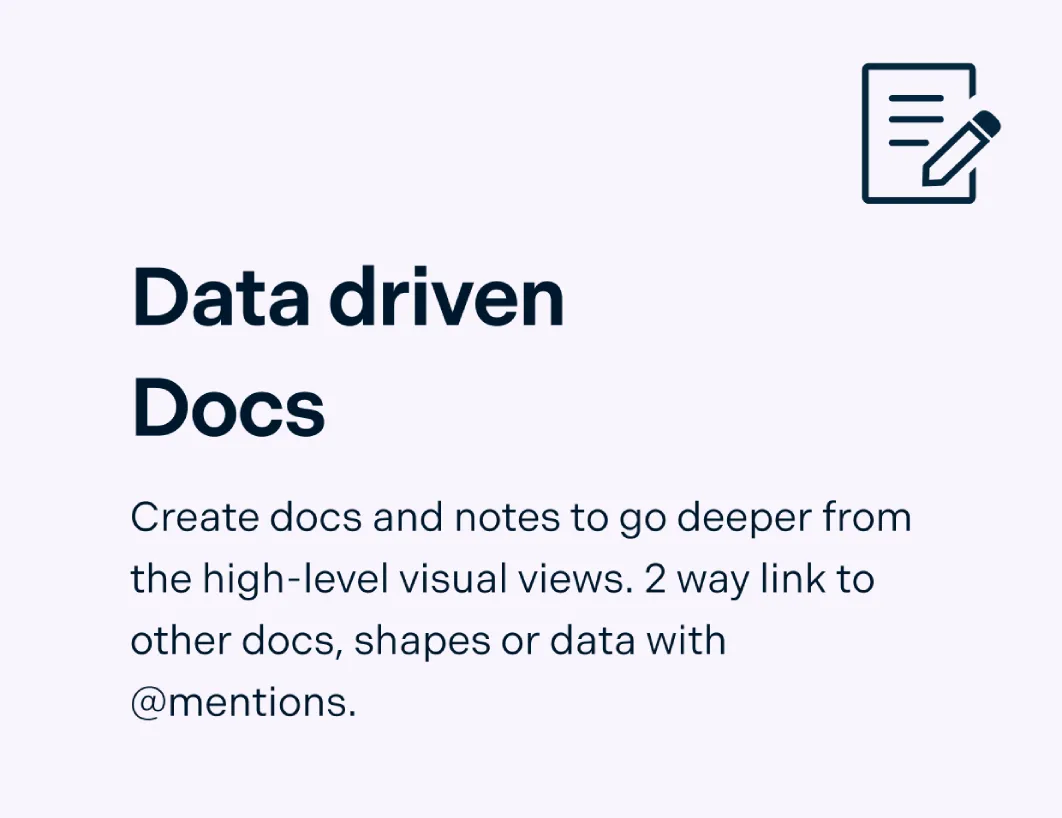
Use Creately’s documentation features to add notes, links, and references
Instantly search across workspaces to connect related charts and topics
Present findings directly with built-in presentation mode, no extra tools needed
What Is a Compare and Contrast Chart?

How to Make a Compare and Contrast Chart?
Launch Creately and define your topic
Open Creately and create a workspace for your team or students. Decide on the topic or concept to compare and contrast, and clarify the purpose and goals using Creately’s whiteboard and collaborative tools.
Select or create a chart template
Choose a Compare and Contrast chart template from Creately’s library (like Venn diagrams or column-style organizers), or build one from scratch using drag-and-drop shapes from the shape library. Set up sections for similarities and differences before adding data.
Gather and organize relevant information in Creately
Invite team members to the workspace with edit access. Collect all relevant information, notes, images, links, and attachments directly on the canvas using sticky notes, the notes panel, and shapes. Structure data clearly within the template.
Identify similarities and differences
Collaborate in real time to populate the chart. Use Venn diagrams or column-style charts to write shared traits in common sections and differences in individual sections. Organize information visually so patterns and contrasts are easy to see.
Review, finalize, and share
Conduct a final review entirely in Creately. Use comments, @mentions, and multi-cursor editing for feedback, then share the finalized chart via a secure link or export it as PNG, PDF, or SVG for presentations or reporting.
Create a Comparison ChartCreate Compare and Contrast Charts with Editable Templates
FAQs About the Compare and Contrast Chart Maker
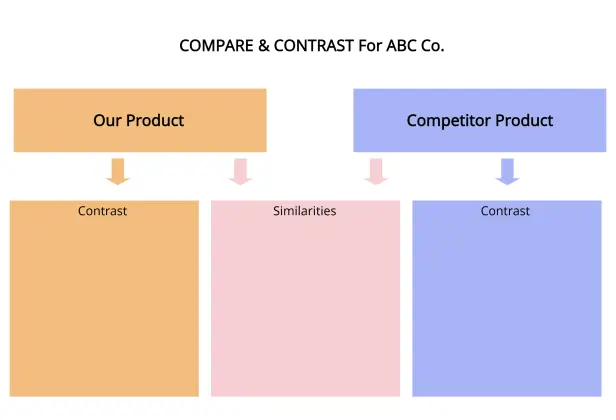
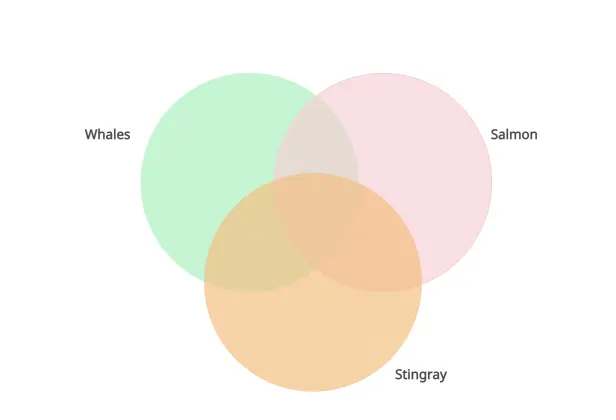
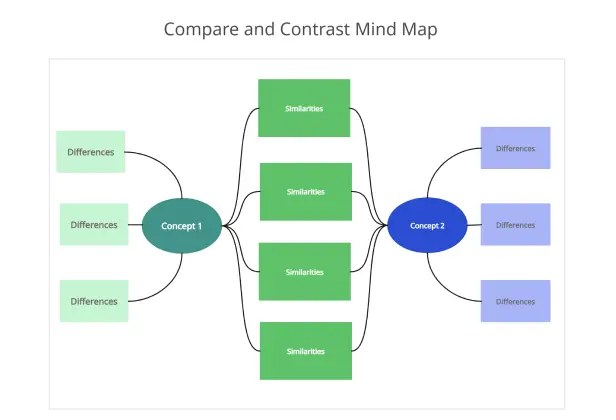
What are the different types of compare and contrast charts?
There are several types of compare and contrast charts that you can use depending on your requirement. Some of the most popular and basic ones are:
When should a compare and contrast chart be used?
Comparing and contrasting works in a variety of contexts. Charts that compare and contrast two ideas can be used in essays that discuss similarities and differences between the ideas.
A compare and contrast chart can be used in education, business and management, research and analysis, decision-making, marketing, medical and technical fields.
Who uses the compare and contrast chart?
How do I use Creately as a compare and contrast tool?
Can I use Creately to create a free online compare and contrast chart?
Can I edit or customize my compare and contrast chart in Creately?
Can I download or share my compare and contrast chart?