Have you ever felt lost in a complicated process at work or struggled to explain how something gets done? That’s where a workflow diagram comes in. It’s a simple, visual way to show the steps of a process from start to finish. By mapping out tasks, decisions, and who is responsible for what, workflow diagrams help teams work more efficiently and avoid confusion.
Whether you’re organizing a business process, improving teamwork, or just trying to make things run more smoothly, a workflow diagram can help. In this guide, we’ll explain what is a workflow diagram, why it’s useful, and how you can create one easily.
Workflow Diagram Meaning
A workflow diagram is a visual tool that shows how a process moves from one step to the next. It uses shapes like boxes, arrows, and symbols to represent tasks, decisions, and the overall flow of work. This makes complex processes easier to understand at a glance.
Workflow diagrams help teams and businesses streamline their work by identifying who is responsible for each step and how tasks should be completed. They are commonly used in industries like healthcare, finance, project management, and customer service to improve efficiency, reduce mistakes, and ensure everyone follows the same process.
By mapping out a workflow, you can spot bottlenecks, eliminate unnecessary steps, and make improvements. Whether you’re automating a business process, organizing a project, or simply looking for a better way to manage tasks, a workflow diagram is a powerful tool to bring clarity and structure to your work.
Workflow Diagram Symbols
Workflow diagrams use simple shapes and symbols to represent different steps in a process. Understanding these symbols makes it easier to read and create workflow diagrams. Here are the most common ones:
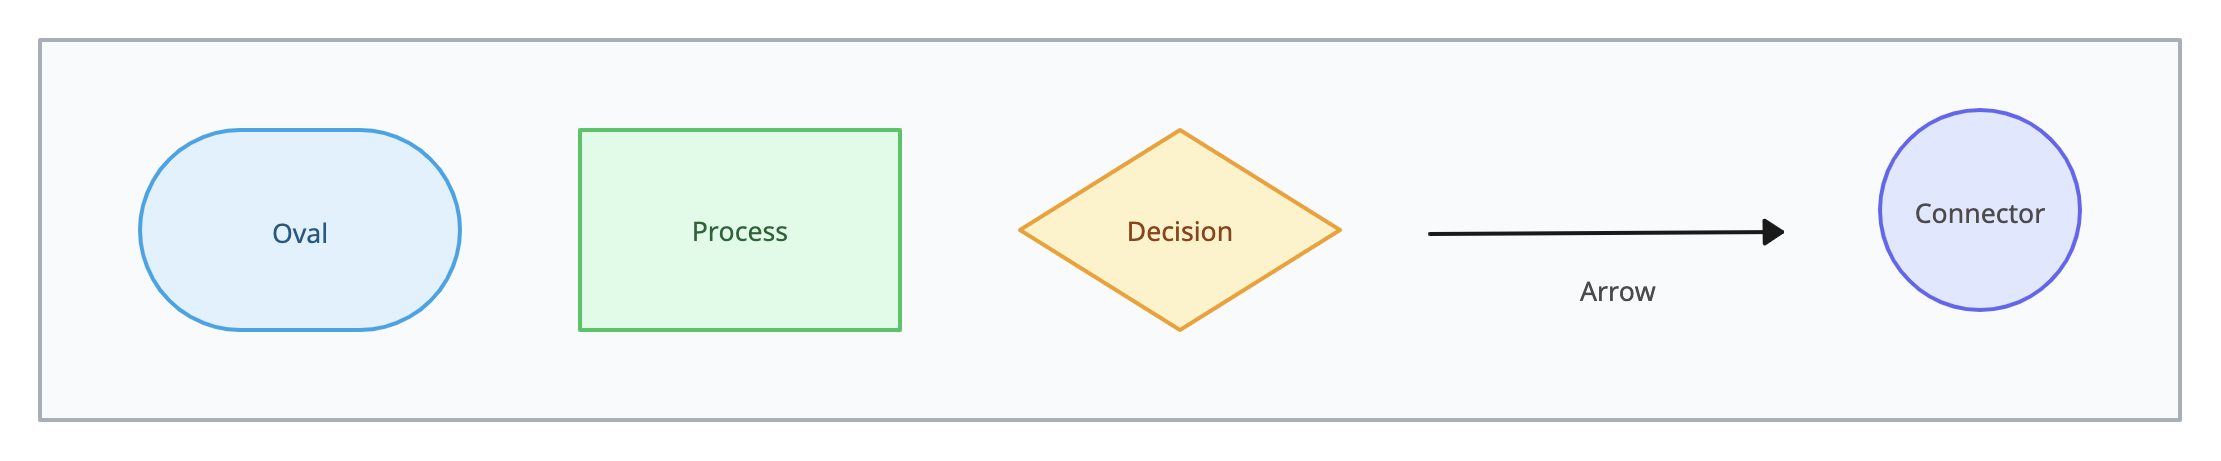
- Oval (Start/End): Marks the beginning or end of a process. Think of it as the starting and finishing points.
- Rectangle (Task/Process): Represents an action or task that needs to be completed. For example, “Review application” or “Send email.”
- Diamond (Decision): Shows a point where a choice must be made, like “Approved?” with arrows leading to “Yes” or “No.”
- Arrow (Flowline): Connects different steps and shows the direction the process moves in.
- Circle (Connector): Helps connect different parts of a diagram, especially when the process continues on another section of the chart.
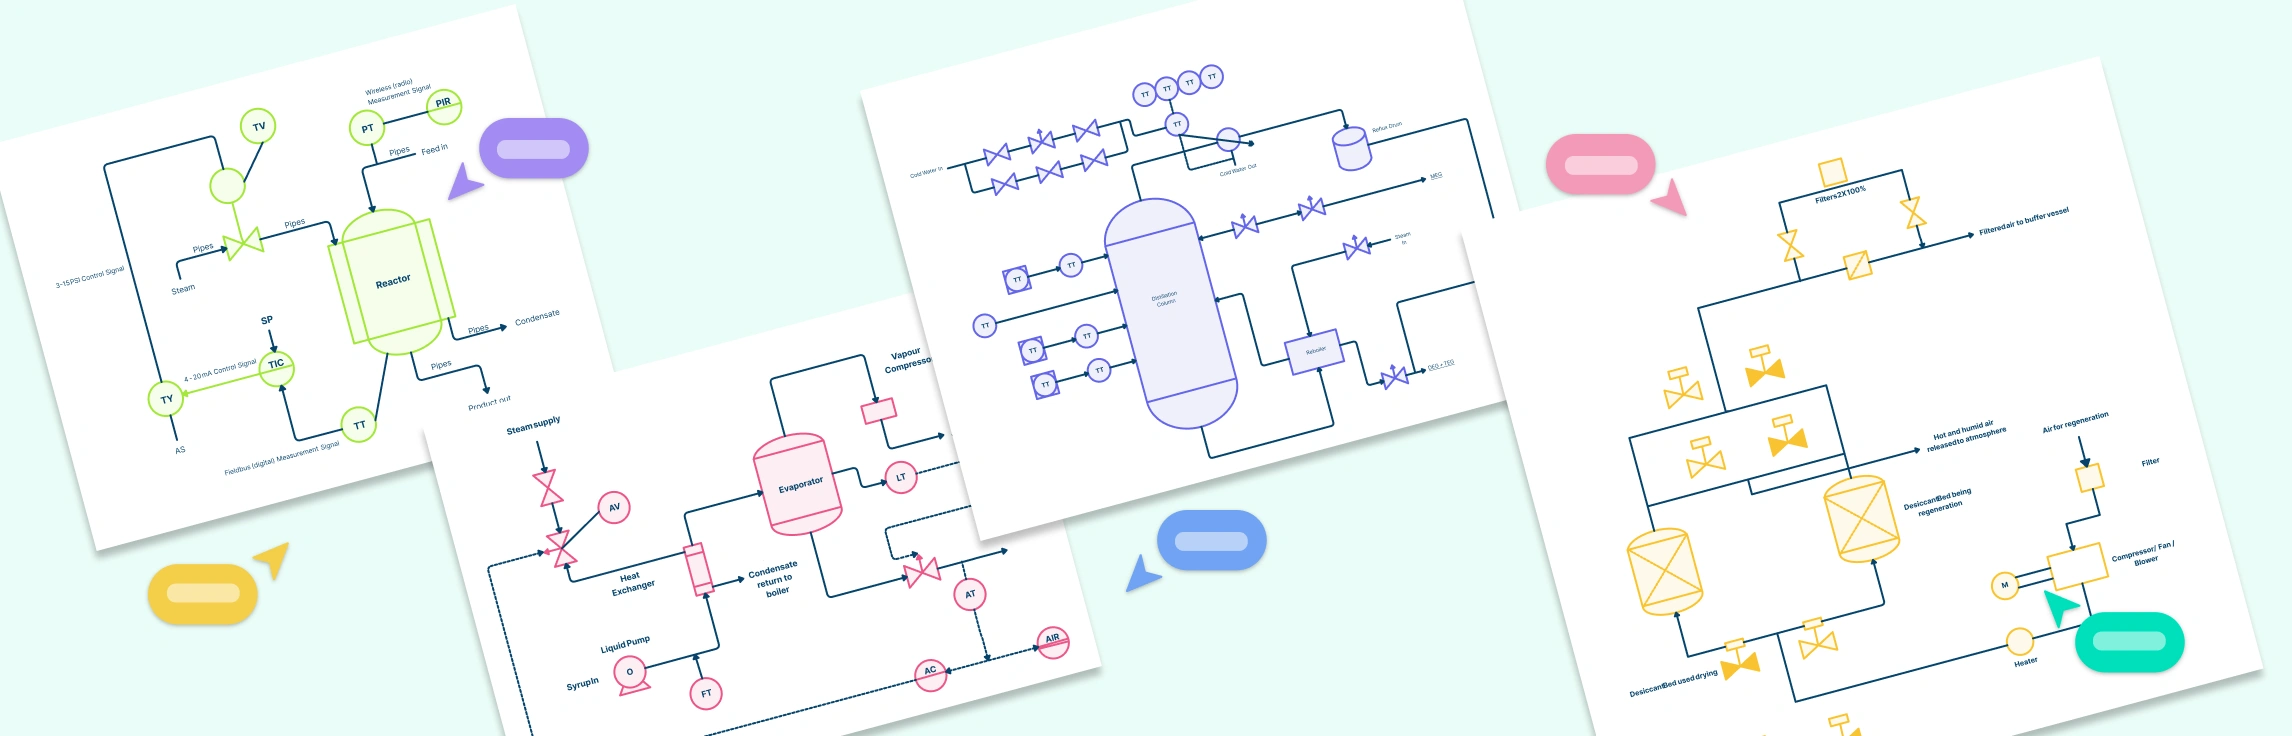
Types of Workflow Diagrams
Selecting the appropriate type of workflow diagram depends on the specific needs of your project, the complexity of the process, and the audience’s familiarity with the process. Each diagram type offers unique insights and advantages, aiding in process analysis, optimization, and communication.
1. Flowchart
A flowchart maps a process step by step using standard symbols like ovals, rectangles, and diamonds. Ideal for simple to moderately complex workflows.


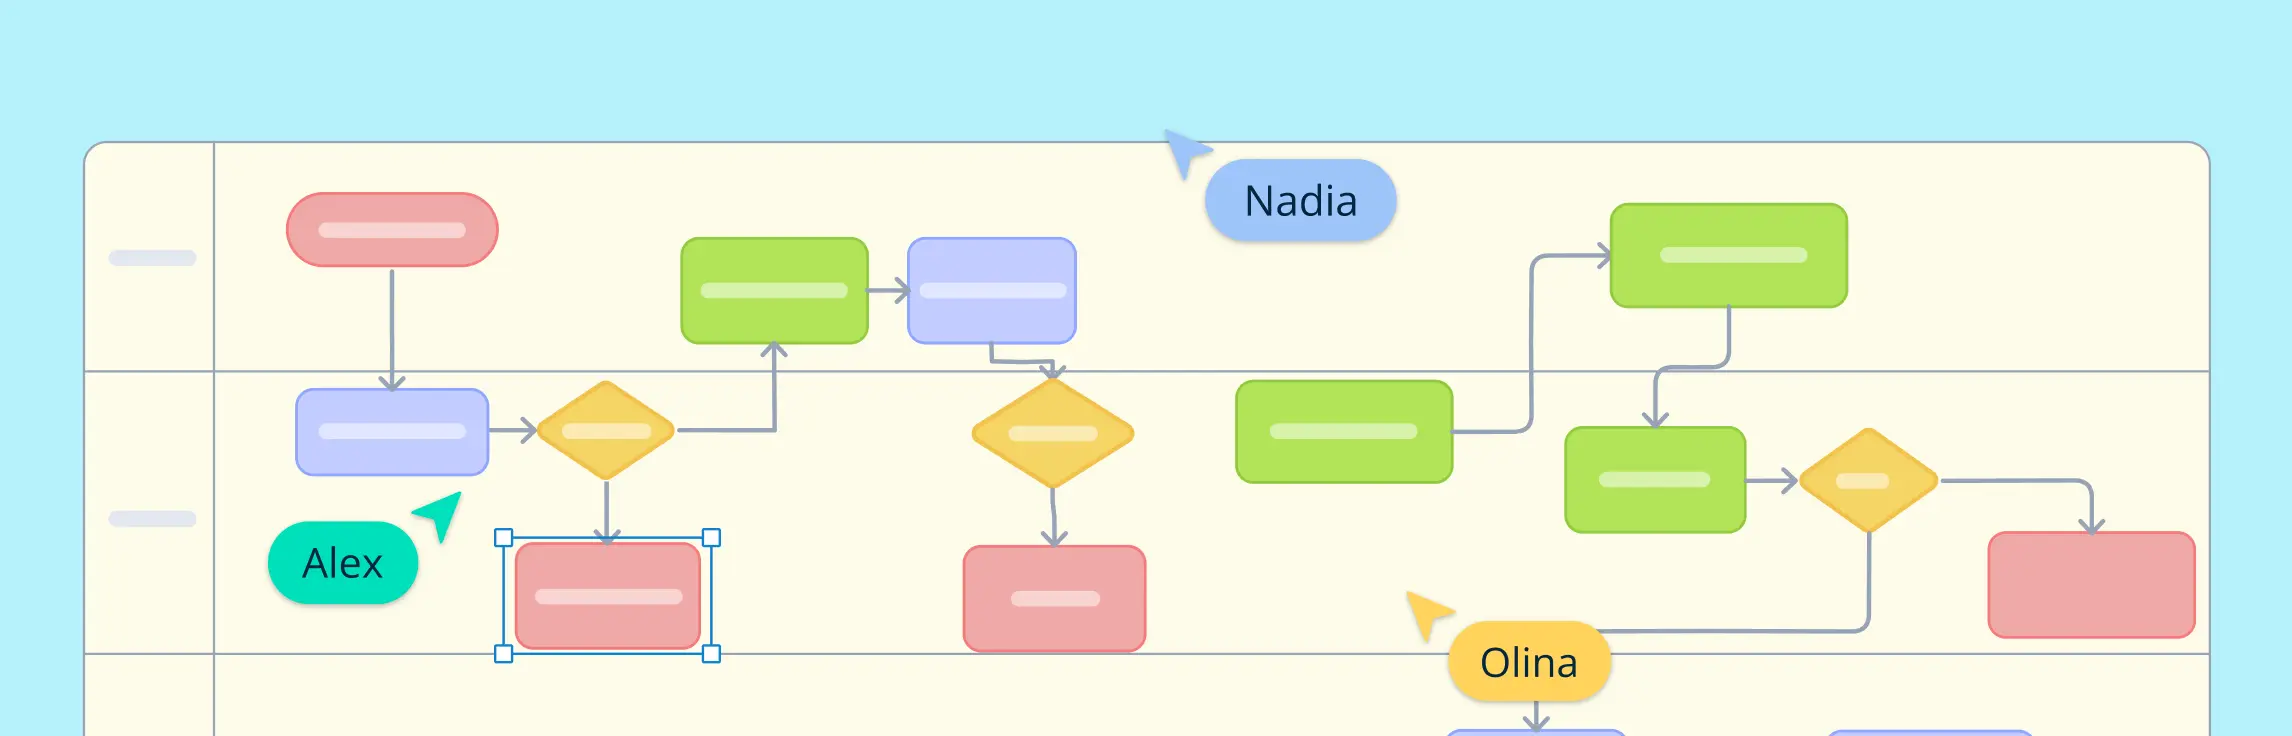
2. Swimlane diagram
A swimlane diagram organizes the steps of a process into “lanes,” where each lane represents a specific person, department, or system. This type of diagram is useful when you want to clarify who is responsible for what and how different groups interact.

3. SIPOC
Stands for Suppliers, Inputs, Process, Outputs, and Customers. The SIPOC diagram provides a high-level overview of a process to see the big picture before detailed mapping.

4. BPMN (Business Process Modelling Notation)
BPMN are standardized diagrams for complex business processes, using symbols for tasks, events, decisions, and data flows. Ensures clear communication between business and IT teams.

5. UML activity diagram
UML Activity Diagrams focus on the flow of control within a system or process. They are mainly used in software development and IT environments to describe workflows in systems.

6. Block diagram
A block diagram uses simple geometric shapes, usually blocks or rectangles, to represent major components of a system or process. These diagrams focus on the relationships and interactions between different parts of a system, often omitting intricate details.

7. Data flow diagram
Data Flow Diagrams (DFD) represent how data moves through a system or process. They show the inputs, processes, outputs, and storage elements of a system, illustrating how information is transferred from one part of the system to another.

How to Make a Workflow Diagram
Now that you know what is a workflow diagram, let’s look at creating one. Creating a workflow diagram is easier than you might think. By following these steps, you can turn any process into a clear, easy-to-follow visual that helps improve efficiency and teamwork.
Step 1. Selecting the process to document
Start by deciding which process you want to map out. It could be something simple, like handling a customer request, or more complex, like managing a project. Choose a process that needs better organization, has common bottlenecks, or could benefit from a clear structure.
Creately tip: Use the AI workflow diagram template to quickly create a first draft by simply describing your process in natural language. The AI automatically generates a structured workflow with tasks, decisions, and flow connections, giving you a ready-to-edit diagram that you can refine and customize.
Step 2. Defining start and end points
Every workflow has a beginning and an end. Identify where the process starts—like receiving an order or a customer submitting a request—and where it finishes, such as delivering a product or completing approval. This helps set clear boundaries for your workflow.
Step 3. Gathering necessary information
Before drawing your diagram, collect all the details about how the process works. Talk to team members involved, review existing procedures, and note any important steps, decisions, or rules. The goal is to capture every step accurately so that the workflow reflects real-life actions.
Creately tip: Collaborate in real time—add notes, comments, and files directly to your diagram to capture insights from the team.
Step 4. Sketch the current process
Before diving into the final diagram, create a rough sketch of the current workflow. This draft helps you visualize how tasks progress and interact with one another. By doing this, you can spot inefficiencies, redundancies, or areas that might need streamlining. It’s an opportunity to get a clearer view of the process before fine-tuning it.
Creately tip: With Creately’s infinite canvas, you can sketch workflows freely using the freehand drawing tool, or quickly build from pre-made workflow templates. Its shape libraries and Plus Create feature let you drop in tasks, decisions, and connectors instantly, so you can experiment with different versions side by side before finalizing.
Step 5. Analyze and design the workflow
Once you have a rough outline, analyze it for any inefficiencies or points where improvements are needed. Use this data to design your final workflow diagram. The goal is to reflect a streamlined, efficient process that minimizes bottlenecks, eliminates unnecessary steps, and ensures that every task flows logically from one to the next.
Use basic workflow symbols like:
- Ovals for start and end points
- Rectangles for tasks or actions
- Diamonds for decisions
- Arrows to show the flow of work
Arrange these elements in a way that makes the process easy to follow. Many people use workflow diagram tools like Creately to create digital versions.
Step 6. Reviewing and refining the diagram
Once your workflow is mapped out, take a step back and review it for accuracy. Share it with the people involved in the process and get their feedback. Look for unnecessary steps, missing details, or ways to make the process smoother. A workflow diagram should make work easier, not more complicated, so tweak it as needed.
Creately tip: Share your diagram with your team for feedback, assign roles using swimlanes, and export it in PDF, PNG, or SVG formats. You can also use Creately’s presentation mode to showcase the workflow directly in meetings or training sessions, making it easy to explain processes visually.
Free Workflow Diagram Templates
Here are workflow diagram templates to help you get started. These templates provide a structured framework for mapping processes quickly and efficiently, saving time and ensuring clarity.
Production Workflow Template

Invoice Processing Workflow

Lead Processing Workflow Example

Credit Approval Workflow Example

Agile Marketing Workflow

Release Process Workflow

Best Practices to Create Effective Workflow Diagrams
Creating clear and effective workflow diagrams is essential to making processes easy to understand and improve. Here are some best practices to follow:
Start with a clear objective: Define the goal of the diagram, whether it’s simplifying, analyzing, or training.
Keep it simple: Focus on essential steps and avoid unnecessary details for clarity.
Use standard symbols: Apply common shapes like ovals, rectangles, and diamonds for consistency.
Define start and end points: Clearly show where the process begins and ends.
Label steps clearly: Use short, simple descriptions that everyone can understand.
Follow a logical flow: Arrange steps in order with clear arrows showing direction.
Involve stakeholders: Get input from team members to ensure accuracy and completeness.
Benefits of Workflow Diagrams
Workflow diagrams offer several advantages that help improve efficiency, clarity, and decision-making within an organization. Here are some key benefits:
Improves process clarity: Breaks down complex processes into simple visual steps, making it easier for everyone to understand their roles and tasks.
Increases efficiency: Highlights inefficiencies, bottlenecks, or redundant steps to streamline operations and boost productivity.
Enhances communication: Provides a clear reference for teams, reducing misunderstandings and keeping stakeholders aligned.
Aids in process improvement: Helps identify problem areas and optimize task sequences for better workflows.
Supports training and onboarding: Serves as a visual guide for new employees to quickly understand processes and responsibilities.
Helps with decision making: A business process flow diagram shows decision points clearly, enabling informed choices at each stage.
Facilitates standardization: Ensures processes are followed consistently across teams, improving quality control.
Increases accountability: Clearly defines roles and responsibilities, making it easier to track task ownership and performance.
References
Long, J. (2014). Eight of the Biggest Process Modeling Problems. Process Modeling Style, [online] pp.1–5. doi:https://doi.org/10.1016/b978-0-12-800959-8.00002-x.
Dumas, M. and ter Hofstede, A.H.M. (2001). UML Activity Diagrams as a Workflow Specification Language. ≪UML≫ 2001 — The Unified Modeling Language. Modeling Languages, Concepts, and Tools, pp.76–90. doi:https://doi.org/10.1007/3-540-45441-1_7.
FAQs About Workflow Diagrams
Why are workflow diagrams important?
What is the difference between a workflow diagram and a flowchart?
Can workflow diagrams be used for any industry?
How do workflow diagrams benefit project management?
What is the difference between a workflow diagram and a data flow diagram?
When should I use a workflow diagram?
What is the history of workflow diagrams?