Ever wondered how complex systems keep everything running smoothly, on time, and in sync? Timing is everything, and understanding it can make the difference between a system that works and one that fails. In this guide, you’ll learn the key components, types, and step-by-step process for creating timing diagrams, along with best practices to make your diagrams clear, accurate, and easy to understand.
What Is a Timing Diagram in UML?
Definition and purpose
A UML Timing Diagram is a type of diagram used in software and system design to show how objects or components change their state over time. Think of it like a timeline for your system—it helps you see what happens, when it happens, and how long it takes. Timing diagrams are especially useful when you want to focus on time-dependent behavior rather than just what the system does.
Comparison with other UML diagrams
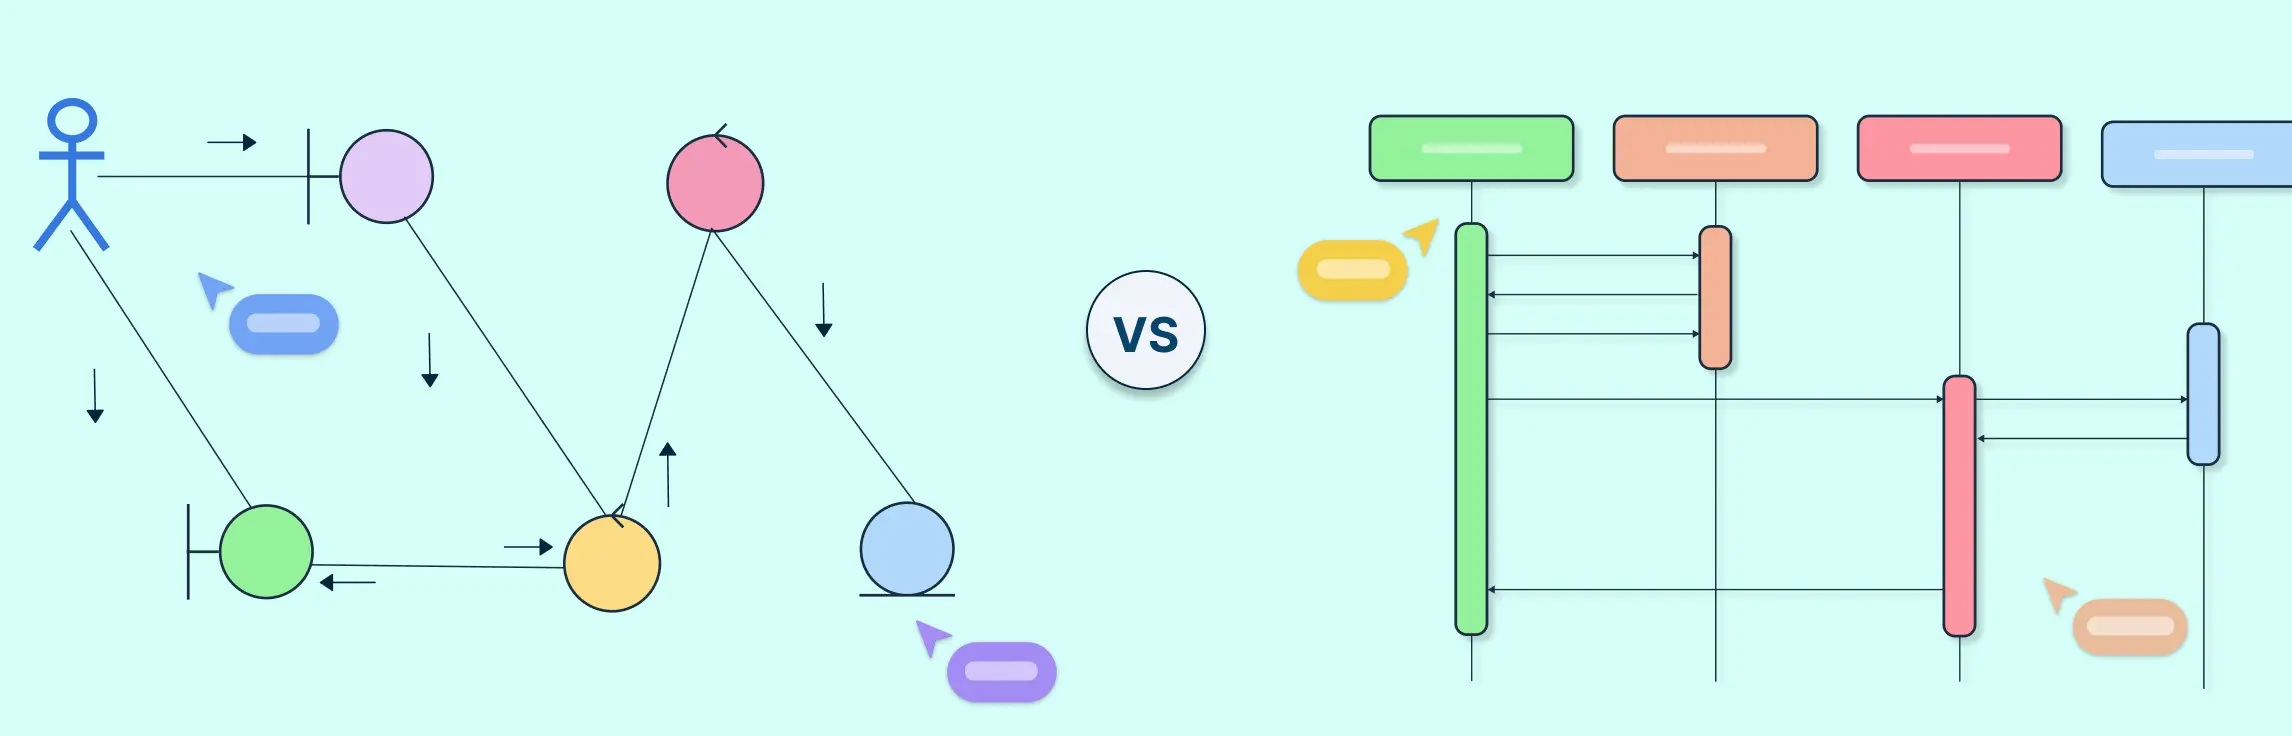
Sequence Diagram: A sequence diagram shows the order of messages between objects, focusing on “who talks to whom” and the sequence of interactions.
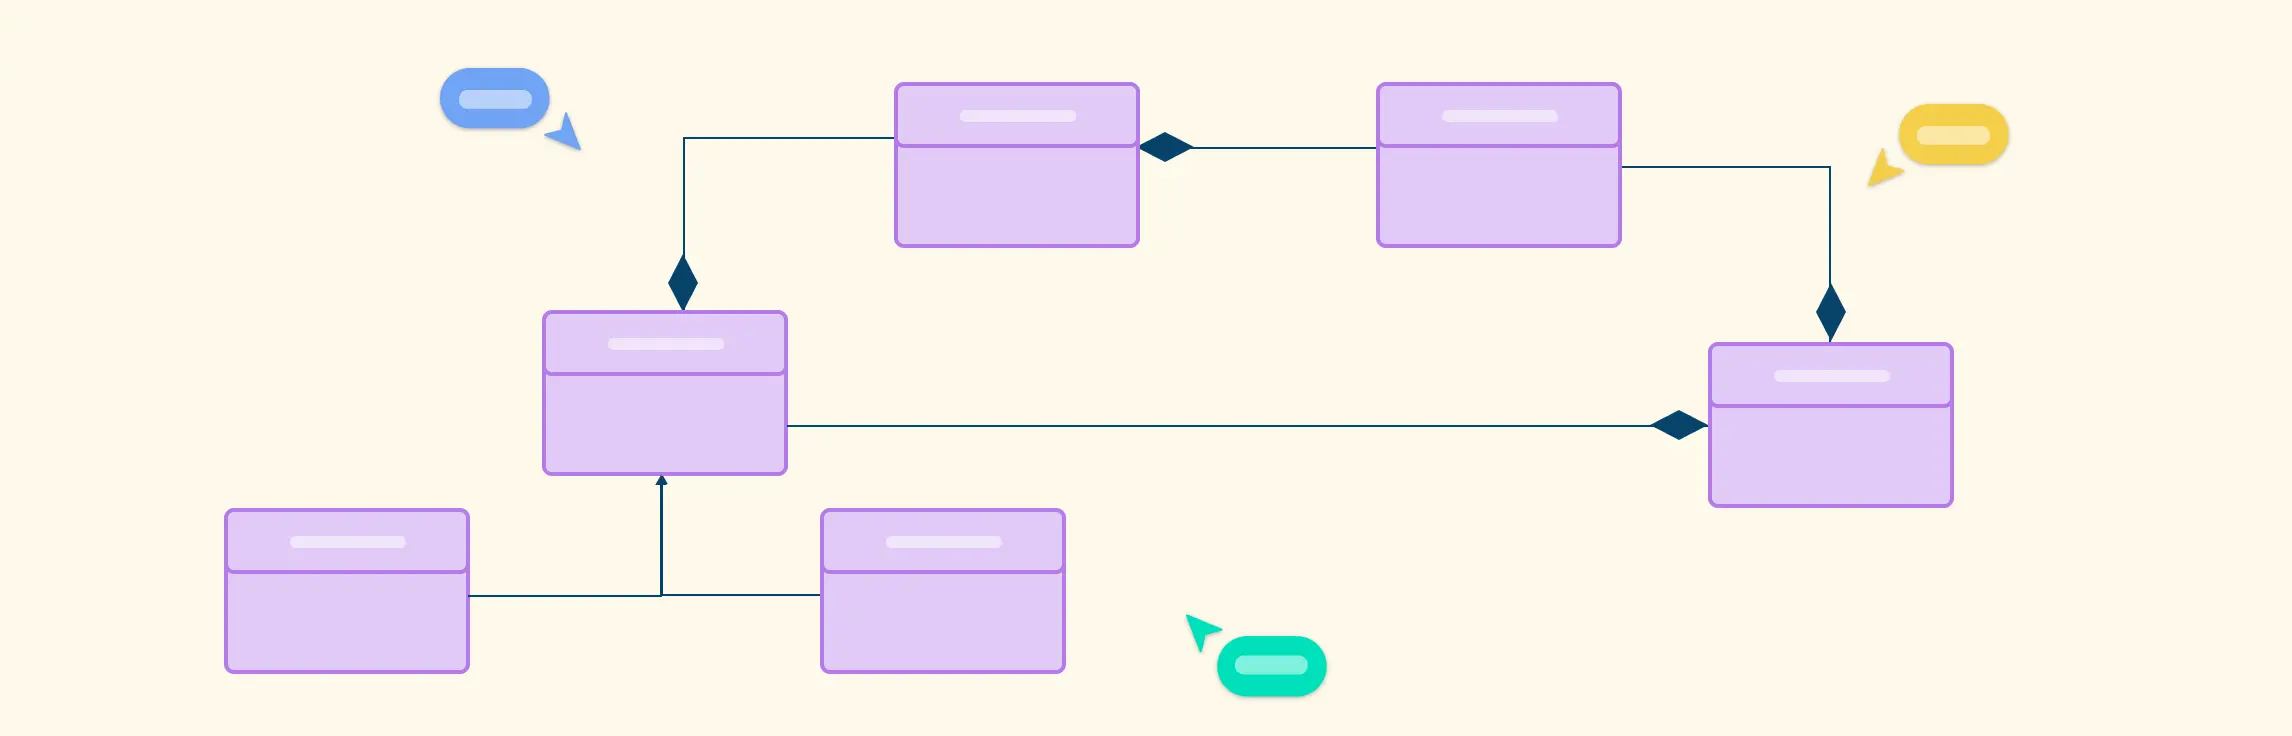
State Diagram: State diagrams show all possible states of an object and how it transitions from one state to another.
Timing Diagram: Focuses specifically on when changes happen over time. While sequence and state diagrams tell the story of interactions and states, timing diagrams add the time dimension to the story.
Importance in system design
Timing diagrams are essential when working with systems where timing matters, such as real-time applications or embedded systems like traffic lights, medical devices, or control systems in factories.
Role in modeling real-time and embedded systems
These diagrams help designers and developers understand and plan how a system should behave second by second or even millisecond by millisecond. They show delays, timeouts, and the exact sequence of state changes—critical for systems that rely on precise timing.
Benefits for developers and system architects
Clear visualization: Makes complex time-based interactions easier to understand.
Error prevention: Helps spot potential timing problems before coding.
Better communication: Everyone on the team, from developers to managers, can see how the system behaves over time.
Efficient design: Makes it easier to plan real-time features and optimize system performance.
Core Components of a Timing Diagram
| Component | What it is | Example |
| Lifelines | Vertical dashed lines that represent people, objects, or system parts. | In a login process, lifelines could be the user, web server, and database. |
| State or Condition Timeline | Shows what state a participant is in at different times. | A machine might go from “Idle” → “Processing” → “Completed.” |
| State Changes | Points where a participant changes from one state to another. | A user changes from “Logged Out” to “Logged In” after signing in. |
| Duration Constraints | Shows how long a participant should stay in a state. | A server must respond within 500 milliseconds. |
| Interaction Occurrences | Events that cause a state to change or trigger an action. | Clicking “Submit” sends data to the server, changing its state. |
| Annotations | Notes added to explain parts of the diagram. | Explains that a state change happens only if a previous step succeeds. |
| Timing Ruler | A horizontal line at the top showing the passage of time. | Helps see when events happen and how long they take. |
| Time Intervals | Shows the time between events or state changes. | Time between sending a request and getting a response. |
| Time Constraints | Rules about when an event or state change must happen. | A process must finish within 2 seconds. |
| Value Lifelines | Shows how a value changes over time. | A temperature sensor reading changes from 20°C → 22°C → 25°C. |
| Time Messages | Shows the passage of time between two events or actions. | 100ms pass between two steps in a communication protocol. |
Types of Timing Diagrams
Timing diagrams can be drawn in two main styles, depending on how much detail you want to show: concise notation and robust notation.
1. Concise Notation
Concise timing diagrams are simple and easy to read. They show the main state changes of participants over time but skip unnecessary details. This type is useful when you want a quick overview of a process without getting bogged down in tiny steps. For example, you could show a user logging into a system with just the key states: “Logged Out” → “Logging In” → “Logged In.”
2. Robust Notation
Robust timing diagrams are more detailed. They show all the state changes, interactions, and timing information for each participant. This type is helpful when you need to analyze a system closely, such as an embedded system or real-time application where timing is critical. For example, it could show every step a vending machine goes through when dispensing a product, including internal checks and exact time intervals.
How to Draw a Timing Diagram
Step 1: Define the scenario
Start by deciding what process or system you want to model. This could be anything where timing matters. For example, imagine you want to model how a ticket vending machine works, from when a user selects a ticket to when the ticket is dispensed. Defining the scenario gives you a clear focus for your diagram.
Step 2: Identify lifelines
Next, figure out who or what participates in the process. These participants are called lifelines in a timing diagram. For the ticket vending machine example, the lifelines could be the User, the Machine, and the Ticket. Each lifeline will get its own vertical line in the diagram.
Step 3: Determine states and transitions
Decide what states each lifeline can be in and how they move from one state to another. States are conditions like “Idle,” “Processing,” or “Dispensing.” Transitions happen when the state changes—for example, the machine goes from “Idle” to “Processing” after the user selects a ticket.
Step 4: Set duration constraints
Some actions take a certain amount of time. Duration constraints show how long a lifeline stays in a state before changing. For example, you might specify that the machine should process a ticket within 5 seconds. This ensures the system meets timing requirements.
Step 5: Add interaction occurrences
Now add the events that cause state changes. These are called interaction occurrences. In our example, a user pressing the “Select Ticket” button triggers the machine to start processing. Interaction occurrences help show what triggers the system to move between states.
Step 6: Incorporate annotations
Finally, add notes or explanations to make the diagram easier to understand. Annotations can clarify special conditions, like “If payment fails, the machine returns to Idle” or “Timeout occurs if no selection is made within 30 seconds.”
Free Timing Diagram Templates
Now that you know what is a timing diagram and how to create one, here are some ready-to-use Creately templates to get started right away.
Timing Diagram Example


Timing Diagram Template

Timing Diagram UML

UML Timing Diagram Template

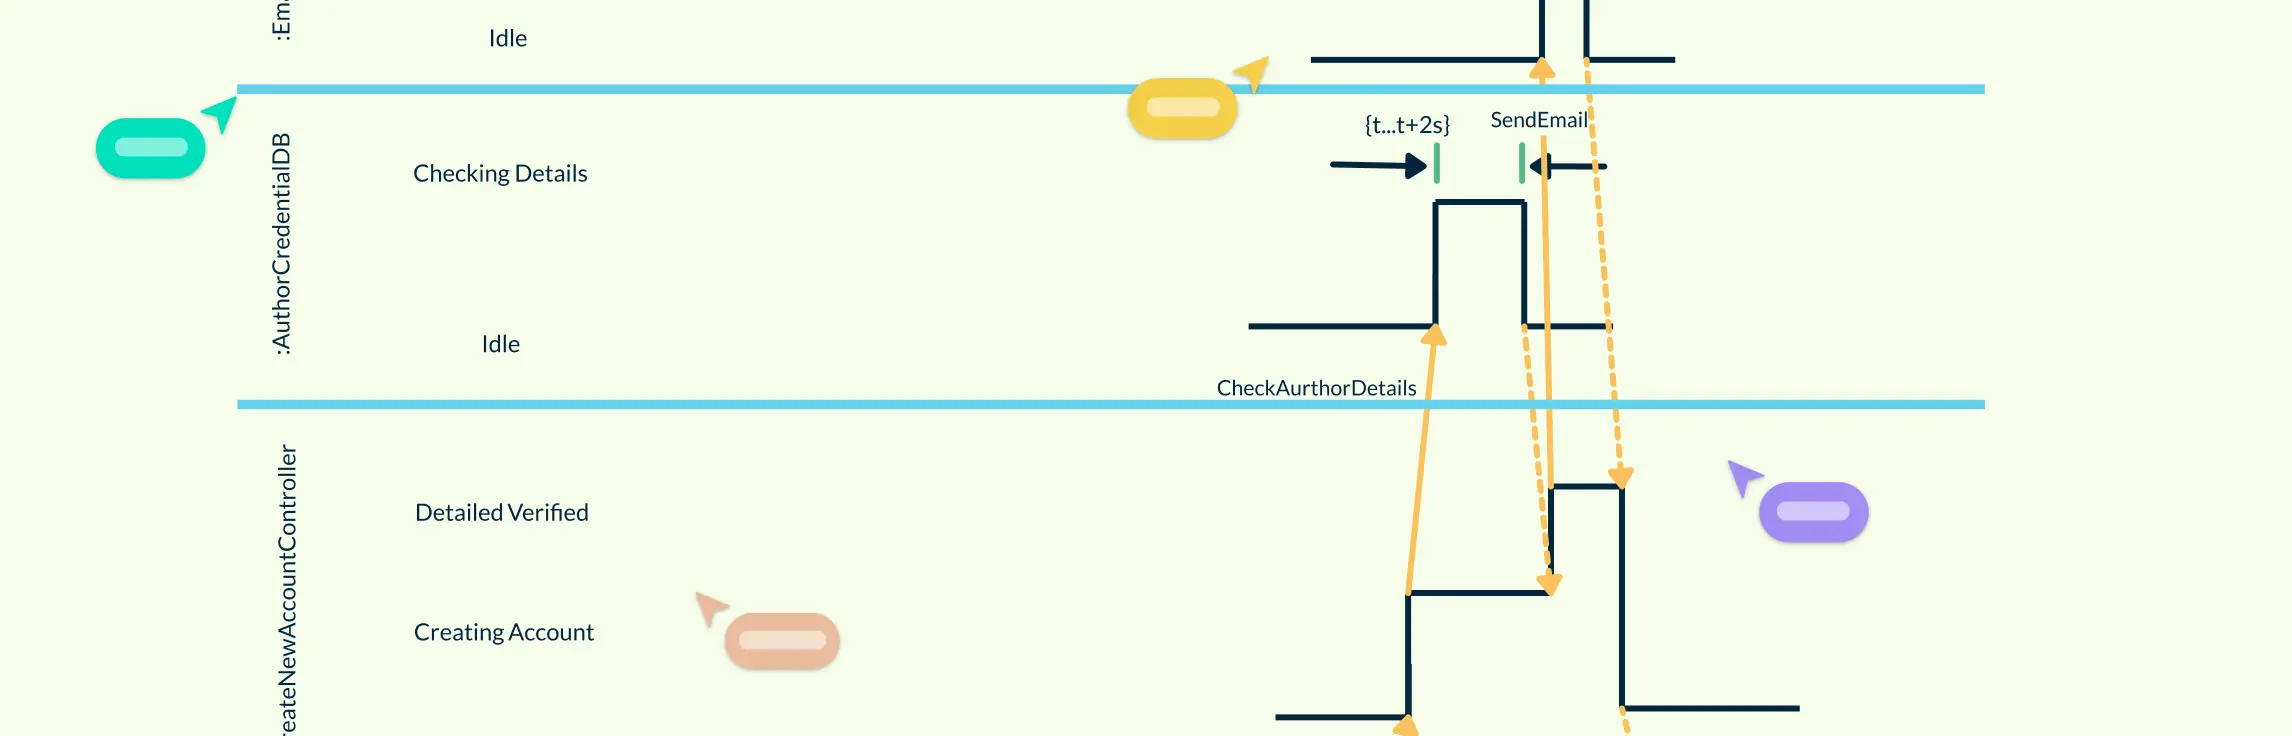
Credit Approval Timing Diagram Examples

Best Practices for Effective Timing Diagrams
1. Keep it clear and simple: Timing diagrams can get complex quickly, so focus on the main participants, states, and interactions. Avoid adding too many details that can confuse readers. A clear diagram is easier to understand and more useful.
2. Use consistent symbols and notation: Stick to standard UML symbols for lifelines, states, and transitions. Consistency helps anyone reading the diagram quickly understand it, especially if they are familiar with UML diagram types.
3. Label everything clearly: Use descriptive names for lifelines, states, and events. Include units for time intervals and make sure duration constraints are easy to read. Clear labeling reduces mistakes and misinterpretation.
4. Highlight important timing constraints: Make critical time-related events or constraints stand out, such as timeouts, maximum response times, or delays. This ensures important system requirements aren’t overlooked.
5. Group related interactions: If multiple interactions happen together or in sequence, group them visually. This makes it easier to see patterns and understand the flow of events over time.
6. Add annotations where needed: Use notes to explain special conditions or exceptions, like what happens if a timeout occurs or if an input is invalid. Annotations improve the diagram’s readability and usefulness.
7. Validate your diagram against real scenarios: Check your diagram against actual system behavior or use case scenarios. Make sure states, transitions, and timing constraints match what the system is supposed to do.
8. Use software features to your advantage: Creately’s timing diagram software can make diagrams cleaner and faster to create. Features like UML shape libraries, smart connectors, quick editing toolbars, integrated notes, and real-time collaboration help maintain accuracy, readability, and efficiency.
Reference
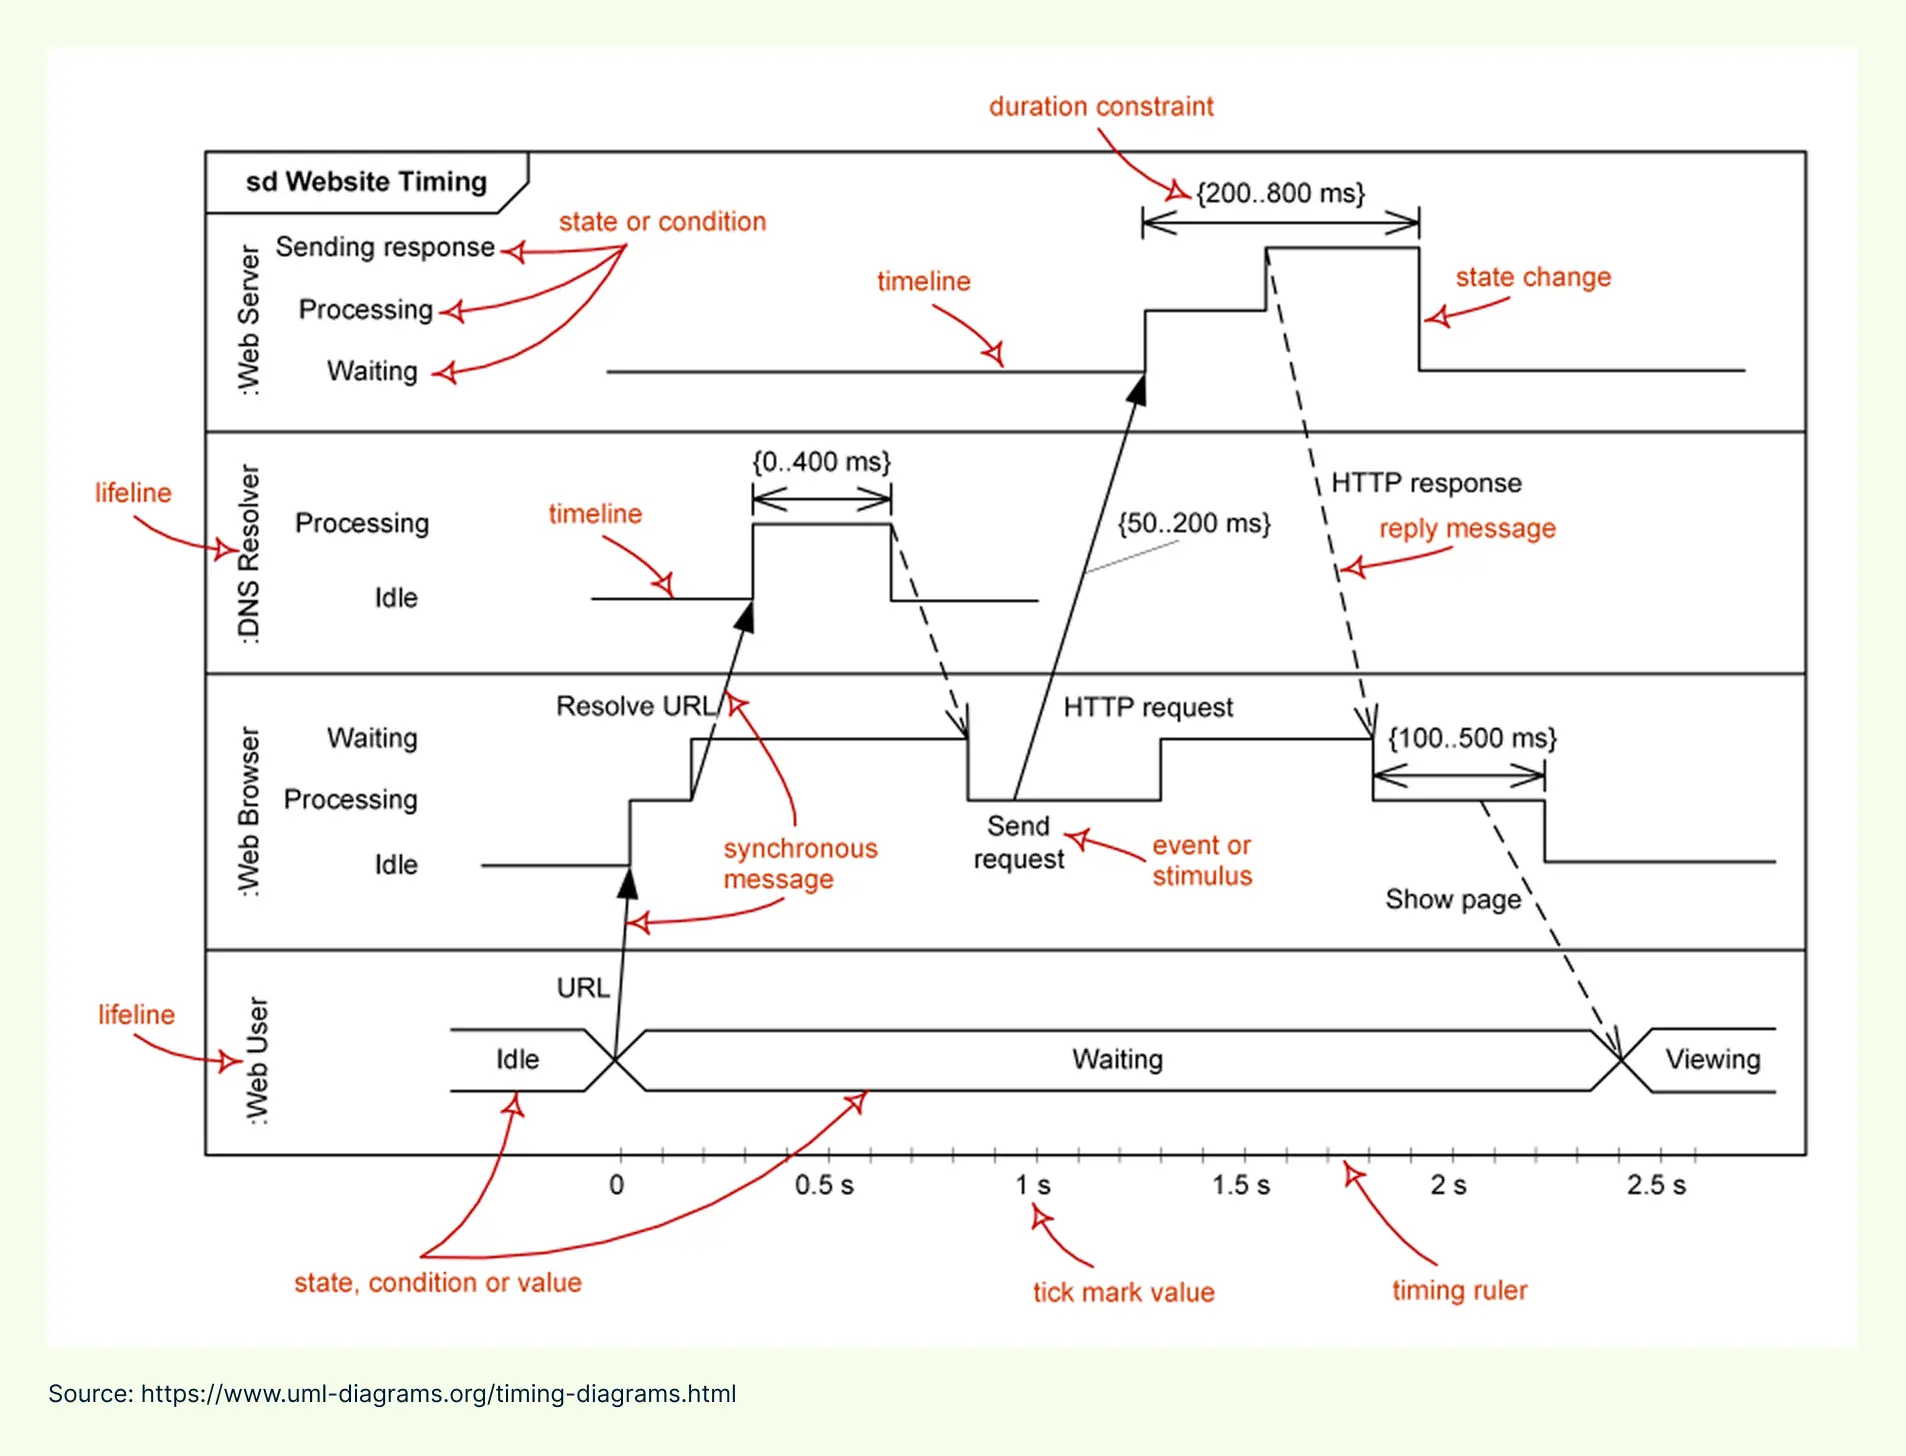
www.uml-diagrams.org. (n.d.). UML Timing Diagrams - Overview of Graphical Notation. [online] Available at: https://www.uml-diagrams.org/timing-diagrams.html.
FAQs About UML Timing Diagrams
When to use UML timing diagrams?
Who can use timing diagrams?
What is the difference between a timing diagram and a sequence diagram?
Are timing diagrams only used for real-time systems?
Can timing diagrams help in testing and debugging?
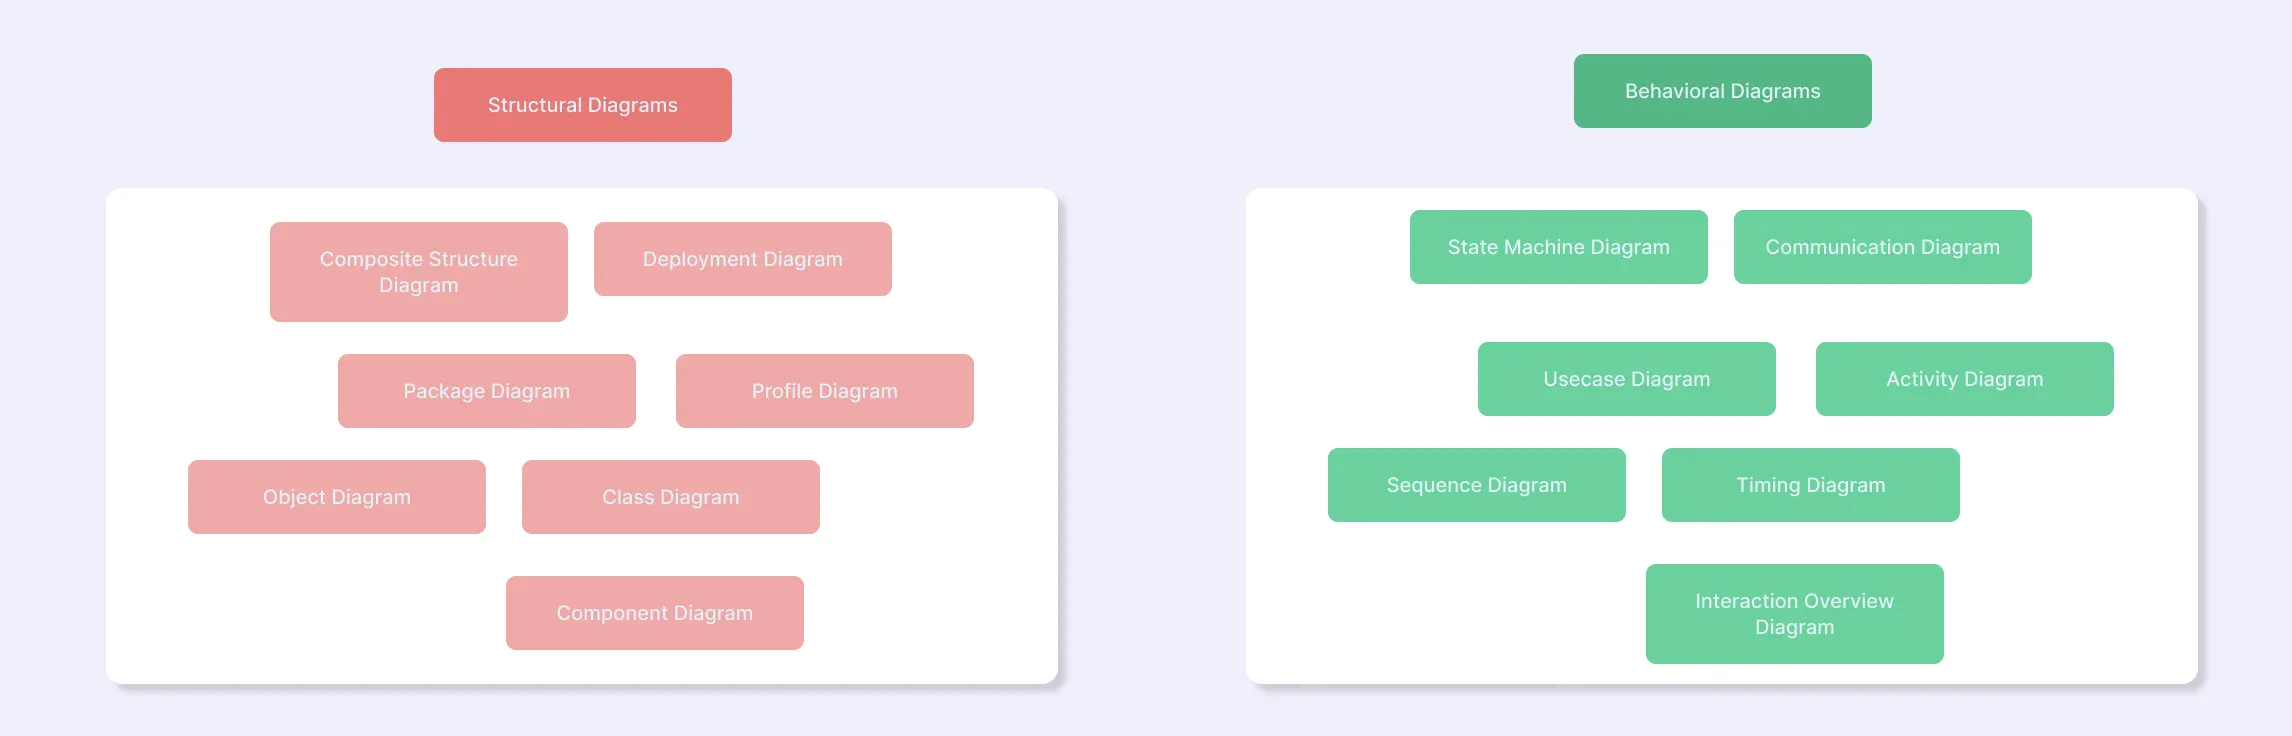
Are UML timing diagrams part of behavioral diagrams?