When it comes to understanding sets, relationships, and overlaps, symbols are your secret weapon. They turn complex concepts into something visual, clear, and even fun to work with. This guide dives deep into all the key Venn diagram symbols, showing you not just what they mean, but how to use them confidently in diagrams, exercises, and real-world examples.
What Is a Venn Diagram
Venn diagrams are more than just overlapping circles—they’re a visual language that helps make sense of relationships, comparisons, and connections. They have a rich history, dating back to the 1880s when John Venn introduced them as a way to represent logical relationships in set theory.
At their core, Venn diagrams are about clarity. They allow you to see how sets interact, which elements overlap, and which stand alone. That’s where symbols come in: they transform visual patterns into formalized expressions that can be read, analyzed, and applied across mathematics, logic, probability, and even everyday problem-solving.
The Foundation of Venn Diagrams
To use Venn diagrams effectively, you need to understand both the visual components and the Venn diagram icons.
Visual Components of a Venn Diagram
| Component | What it is | How it appears | Why it matters / Example |
| Sets | Distinct groups or categories | Circles or ellipses | They are the main “actors” in a diagram. Example: cats or dogs in a pet diagram. |
| Universal set (U) | The “universe” of all elements under consideration | Rectangle surrounding all circles | Provides context and boundaries. Example: all pets, including cats, dogs, birds, etc. |
| Intersection | Elements common to two or more sets | Overlapping area of circles | Shows shared members. Example: students who play both soccer and basketball. |
| Disjoint / non-overlapping regions | Areas of a set not overlapping with any other | Parts of circles that don’t touch other circles | Highlights unique elements. Example: dogs that are not cats. |
| Empty regions (∅) | Areas of overlap with no elements | Blank region or marked with ∅ | Shows that no elements exist in that combination. Example: no pets that are both reptiles and mammals in a certain scenario. |
| Labels | Names or identifiers for sets | Inside or next to circles | Provides clarity. Example: “A” = students who play soccer, “B” = students who play basketball. |
| Elements / members | Individual items in a set | Written inside circles (numbers, symbols, or examples) | Makes the diagram concrete. Example: “Max” in dogs, “Whiskers” in cats. |
| Shading / highlighting | Indicates specific operations (optional) | Colored or filled regions | Helps visualize union, intersection, complement, etc. Example: shading A ∩ B shows students playing both sports. |
Venn Diagram and Set Theory
Venn diagrams are essentially a visual representation of set theory, which studies collections of objects called sets and how they relate or interact with each other. Venn diagram set notation turns abstract ideas about sets into diagrams that are easy to understand and analyze.
Basic Set Notations
{ }— Defines a set. Example: A = {1, 2, 3}∈— “Element of.” Example: 2 ∈ A (2 is in set A)∉— “Not an element of.” Example: 5 ∉ A (5 is not in set A)∅— Empty set, a set with no elementsUniversal set (U) — Contains all possible elements in the context of the problem
Connecting Sets to Venn Diagrams
Sets are represented as circles.
Universal set is represented as a rectangle surrounding all circles.
Overlaps between circles show intersections.
Shaded areas represent operations like union, difference, or complement.
Example
A = students who play soccer
B = students who play basketball
A ∩ B — students who play both sports (overlap shaded)
A ∪ B — all students who play at least one sport (both circles shaded)
By linking sets to visual diagrams, Venn diagrams make abstract set operations tangible, intuitive, and easier to reason about.
Venn Diagram Symbols Meaning
Venn diagram sets symbols are the shorthand language of set theory — simple marks that pack a lot of meaning. They let you describe how sets overlap, exclude, or combine using concise notation. These symbols aren’t just “mathy”; they help you translate a visual diagram into formal logic, so you can reason clearly and precisely.
Here are the key symbols you should know;
Basic Set Operations
| Symbol | Meaning | Example / Venn Diagram |
| ∪ | Union | All elements in A or B or both |
| ∩ | Intersection | Elements in both A and B |
| ′ or ᶜ | Complement | All elements not in A (outside the circle) |
| – or \ | Set difference | Elements in A but not in B |
| Δ or ⊖ | Symmetric difference | Elements in exactly one set, not both |
| ∅ | Empty set | No elements, nothing shaded |
Relationships Between Sets
| Symbol | Meaning | Example / Venn Diagram |
| ⊆ | Subset | A is fully inside B |
| ⊂ | Proper subset | A is smaller and inside B |
| ⊇ | Superset | A contains all elements of B |
| ⊃ | Proper superset | A contains B and extra elements |
| ∈ | Element of | 3 ∈ A (3 is in A) |
| ∉ | Not element of | 7 ∉ A (7 is not in A) |
Other Useful Symbols
| Symbol | Meaning | Example / Venn Diagram |
| U or ξ | Universal set | Rectangle around all sets |
| , | Element separator | {1, 2, 3} inside a circle |
Optional Advanced Note: De Morgan’s Laws
De Morgan’s laws help us understand how complements interact with unions and intersections in sets. They are especially useful when shading regions in a Venn diagram or simplifying set expressions.
- Complement of a union:
(A∪B)′=A′∩B′
This means that everything not in A or B is the same as the elements not in A and not in B.
- Complement of an intersection:
(A∩B)′=A′∪B′
This means that everything not in both A and B is the same as the elements not in A or not in B.
Tip: Visualizing these with a Venn diagram can make them much easier to remember — just shade the regions outside the sets according to the rule.
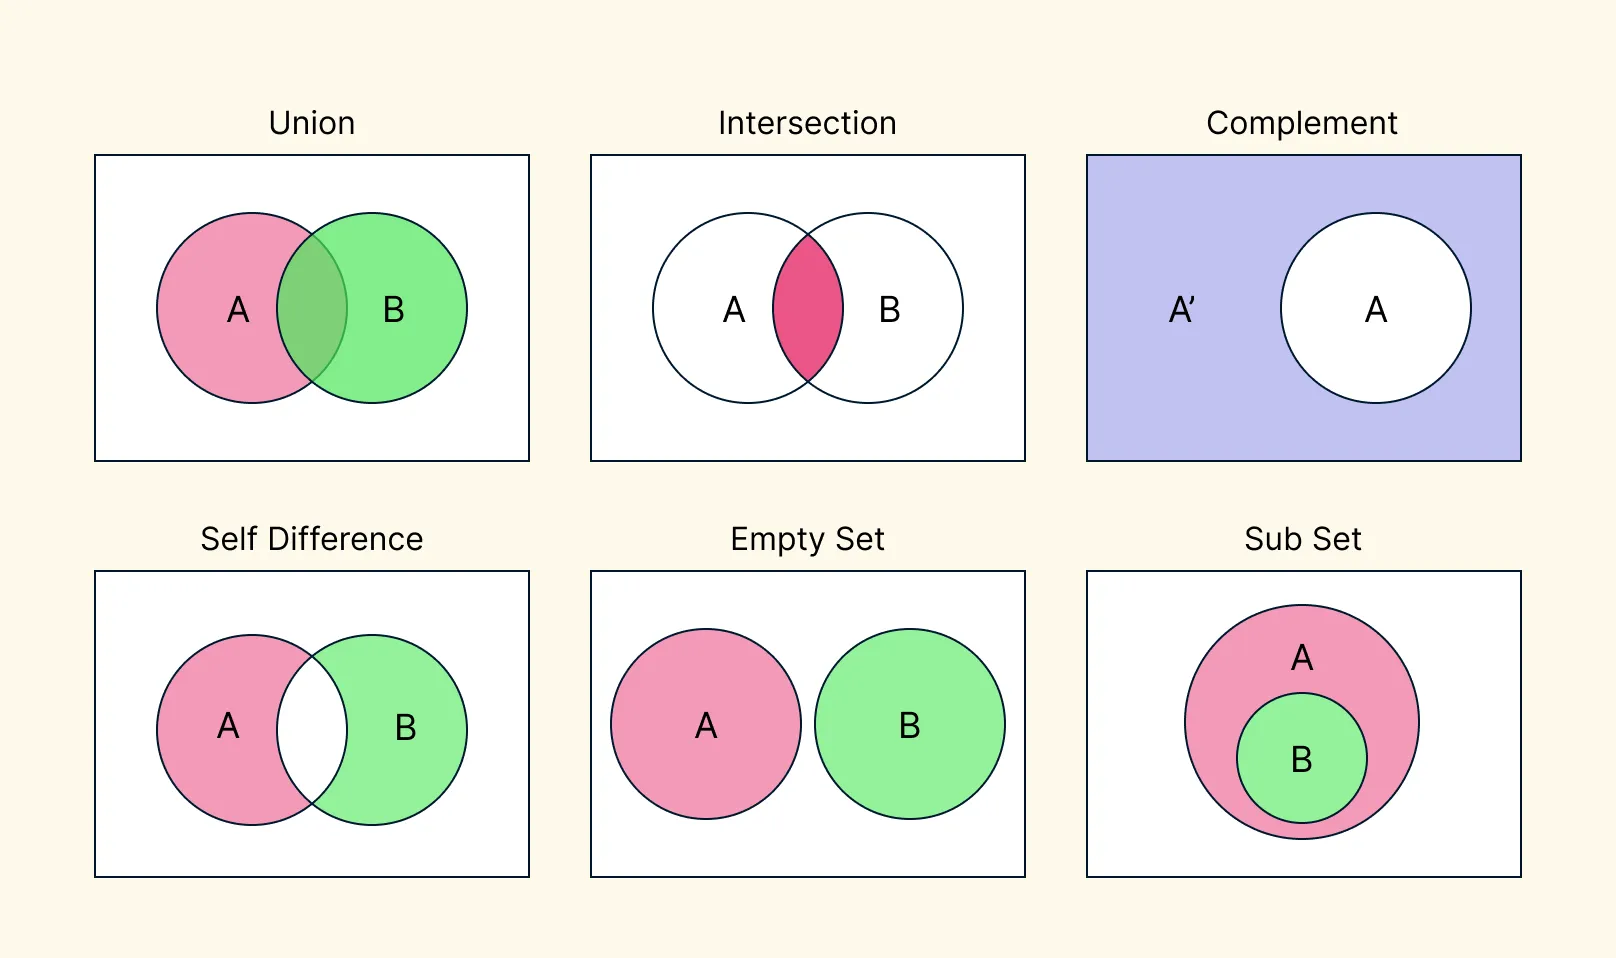
How to Shade Venn Diagrams
Shading a Venn diagram is all about highlighting the regions that satisfy a set expression. Here’s a clear, step-by-step guide for two-set Venn diagrams:
Step 1. Draw the basic diagram
Draw two overlapping circles.
- Label the left circle A and the right circle B.
The overlapping area represents elements in both A and B.
Step 2. Understand the set expression
Identify whether you are dealing with:
Union ( ∪ ) → “or” → all elements in either set.
Intersection ( ∩ ) → “and” → only elements in both sets.
Complement ( ’ or ᶜ ) → “not” → everything outside the set.
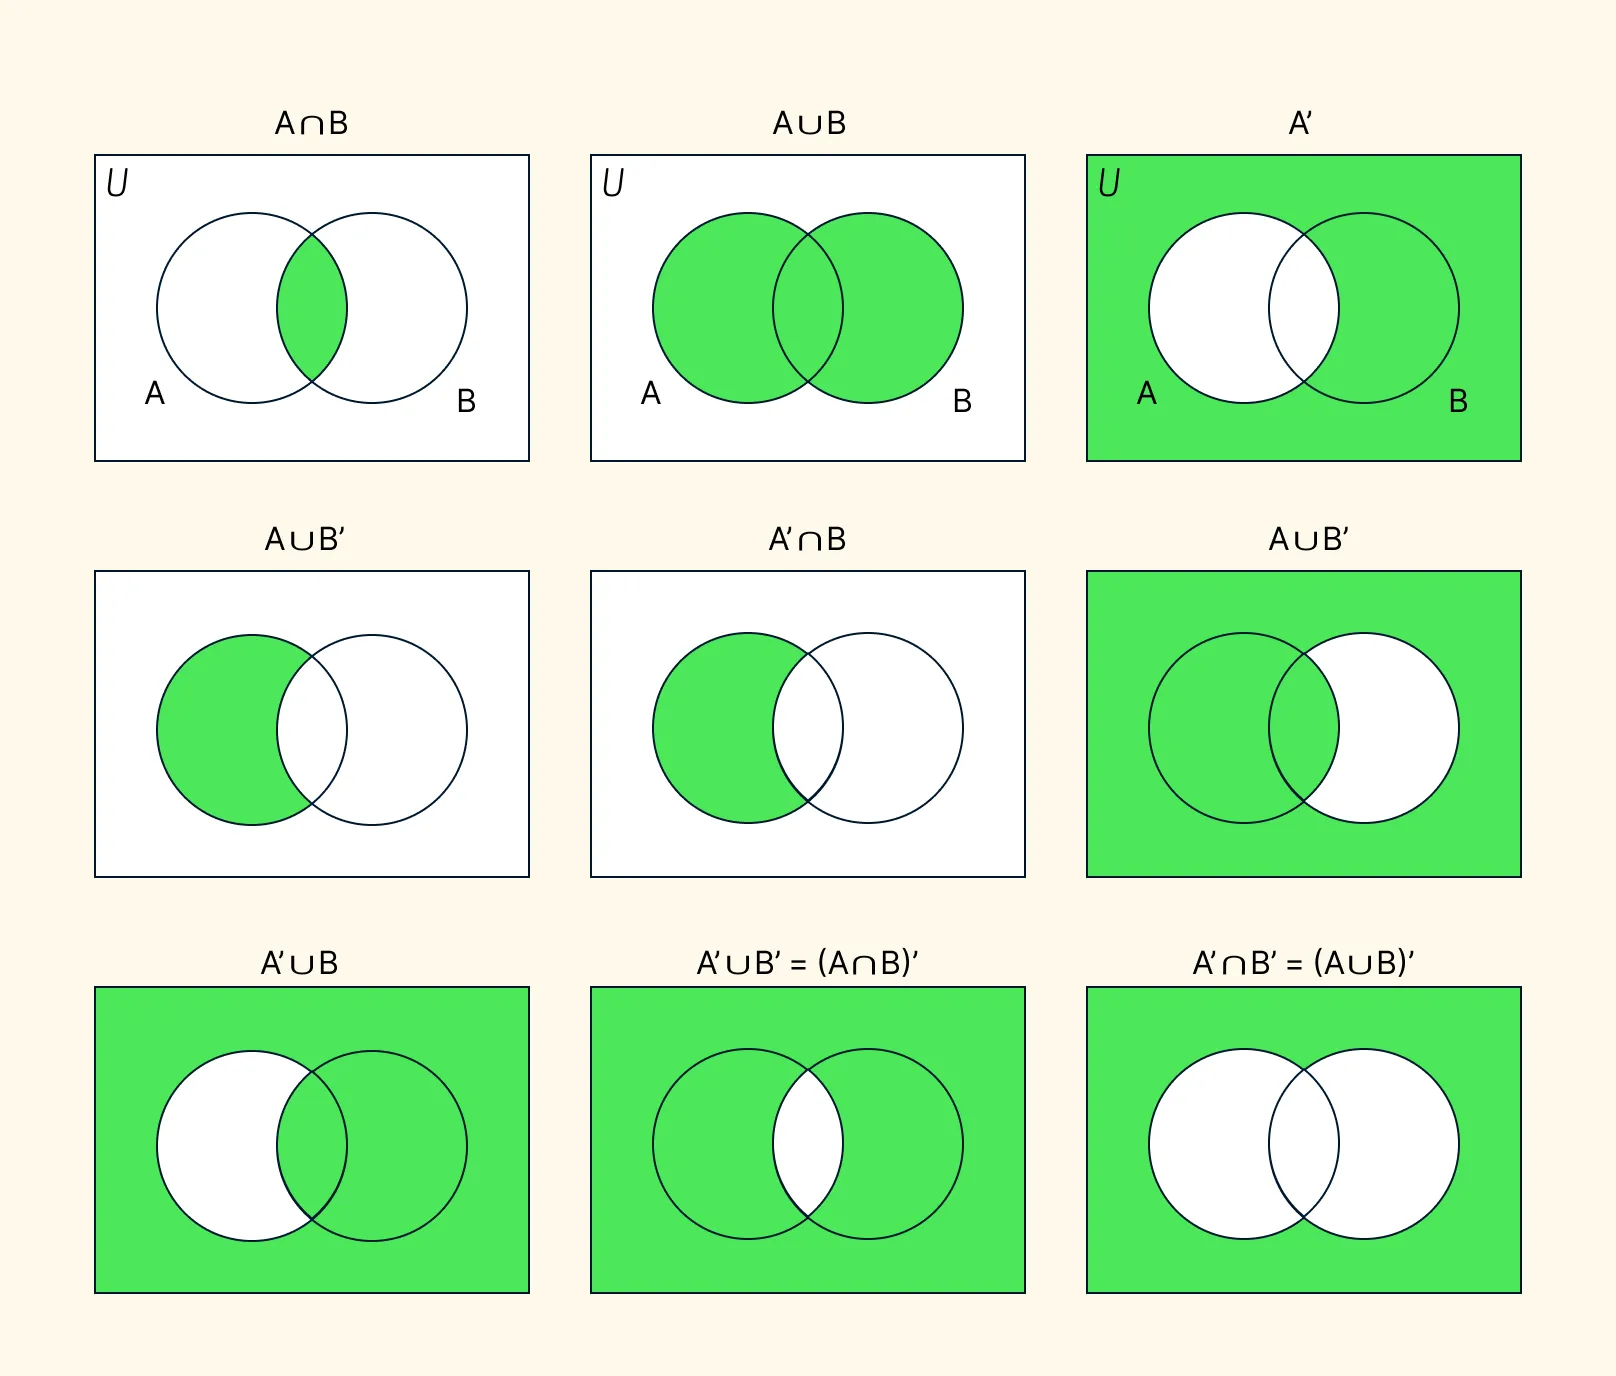
Step 3. Shade step by step
A ∩ B (A intersect B)
- Shade only the overlapping region of A and B.
A ∪ B (A union B)
- Shade all areas inside both circles, including the overlap.
A’ (A complement)
- Shade everything outside circle A, including outside B.
A ∩ B’ (A intersect B complement)
- Shade the part of A that does not overlap B (left-only region).
A’ ∩ B (A complement intersect B)
- Shade the part of B that does not overlap A (right-only region).
A ∪ B’ (A union B complement)
Shade all of A and everything outside B.
Only the part of B not in A remains unshaded.
Venn Diagram Examples
Now that you are familiar with the Venn diagram symbols, here are some templates to help you start drawing them. You can use Creately’s Venn diagram maker to get a head start.
Simple Venn Diagram Example


Plant Cells vs Animal Cells Venn Diagram

WW1 vs WW2 Venn Diagram

Venn Diagram Template on Different Blogging Platforms

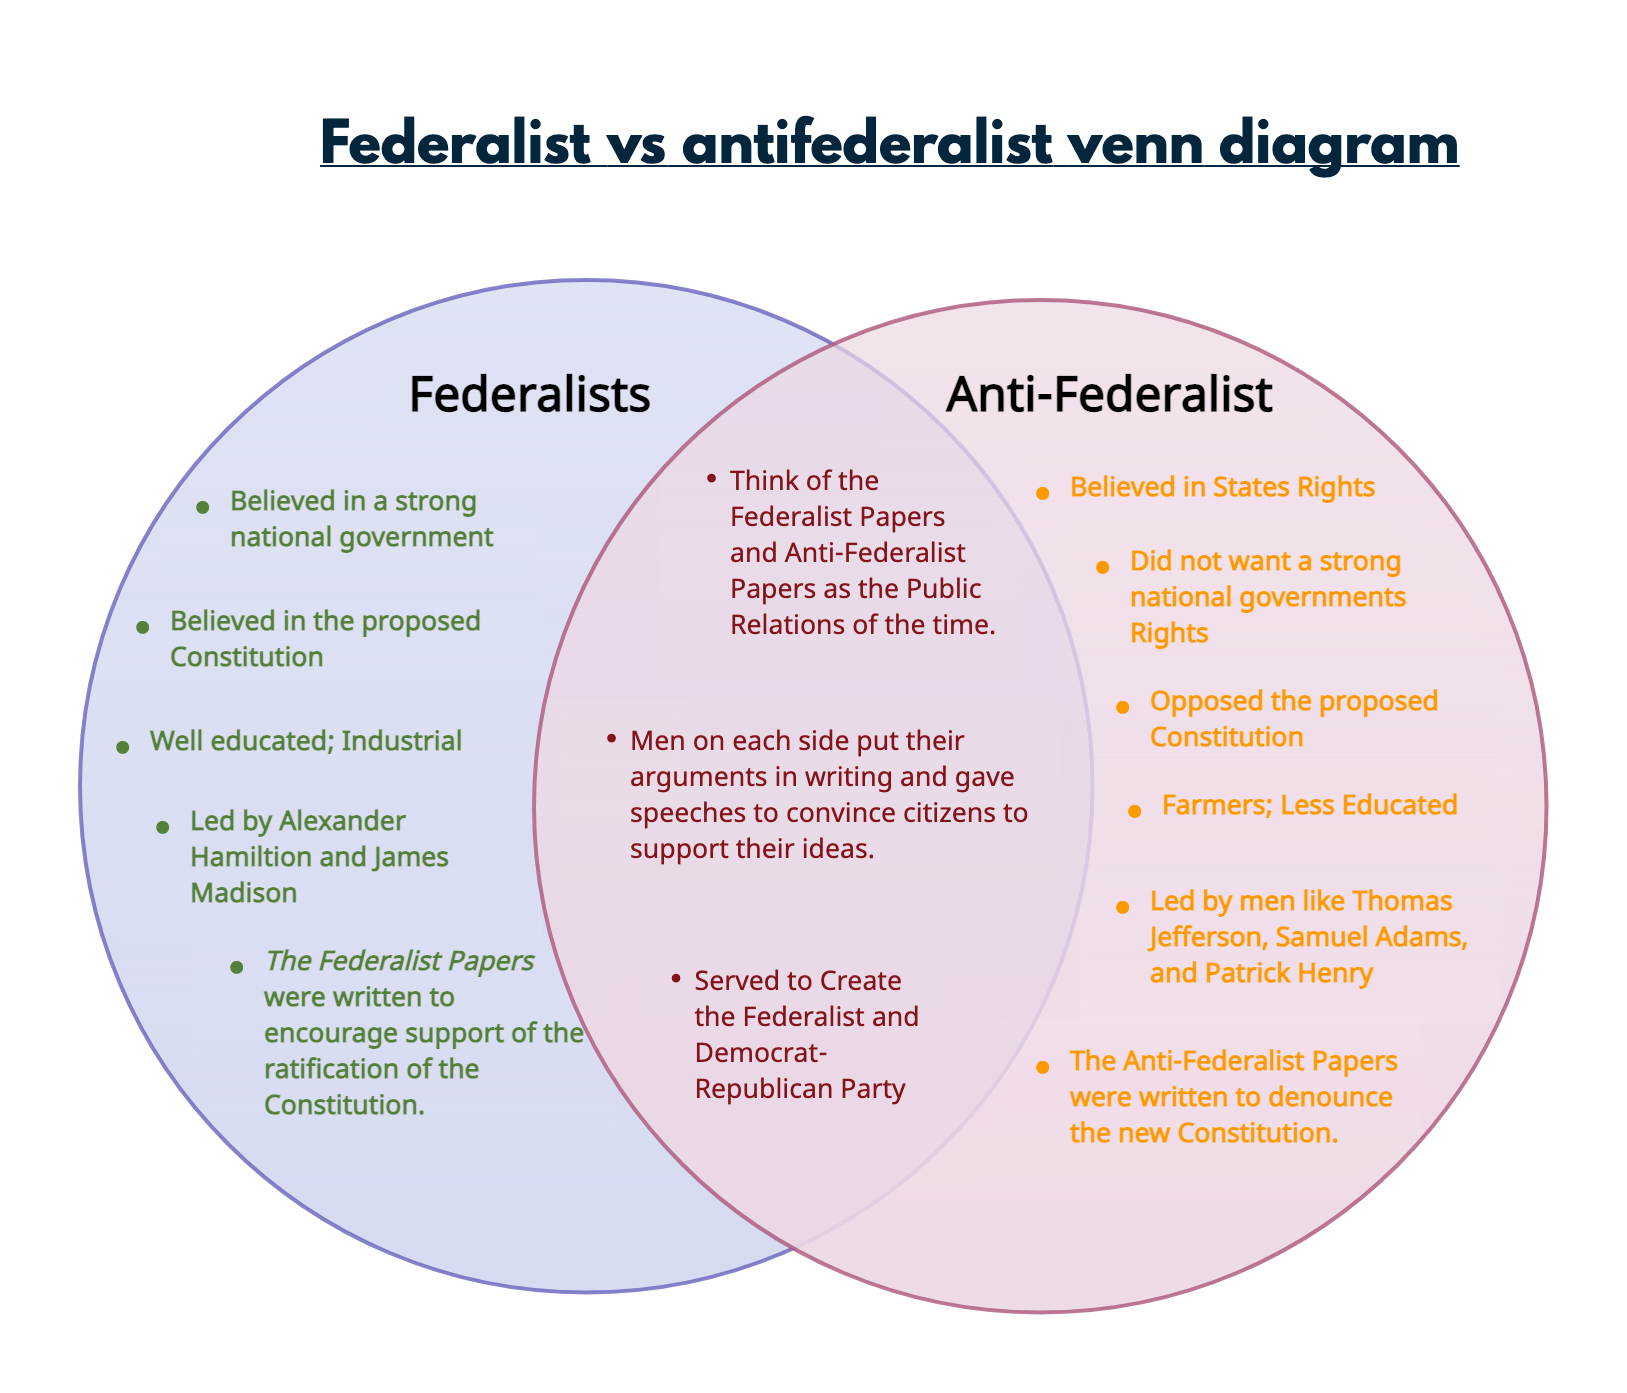
Federalist vs Antifederalist Venn Diagram
Applications of Venn Diagram Notations
Venn diagram symbols are not just abstract math—they are used in many real-world scenarios to simplify, visualize, and analyze relationships between groups. Here are some common applications:
1. Mathematics and Set Theory
Representing unions, intersections, and complements in problems.
Solving logic puzzles, probability problems, and set operations.
Visualizing De Morgan’s laws and other set-theoretic relationships.
2. Statistics and Data Analysis
Comparing survey results or market research data.
Visualizing overlapping populations, such as customers who buy multiple products.
Identifying common or unique elements between data sets.
3. Computer Science and Logic
Representing logical expressions and Boolean operations.
Visualizing database queries (e.g., finding records that meet multiple criteria).
Designing decision-making algorithms with AND, OR, NOT operations.
4. Education and Learning
Teaching mathematics, logic, and probability visually.
Helping students understand relationships between concepts, like subjects, skills, or categories.
5. Everyday Life
Comparing preferences or choices (e.g., fruits, hobbies, pets).
Planning events or groups where multiple criteria overlap.
Making decisions based on shared or exclusive characteristics.
References
www.sciencedirect.com. (n.d.). Venn Diagram - an overview | ScienceDirect Topics. [online] Available at: https://www.sciencedirect.com/topics/earth-and-planetary-sciences/venn-diagram.
Katemba, C. and Sihombing, N. (2023). Enhancing students’ reading comprehension through venn diagram strategy and KWL (know, want, learn) strategy. Journal of English Language Pedagogy, Literature, and Culture, [online] 8(1), p.2023. doi:https://doi.org/10.35974/acuity.v8i1.3015.
∪ (Union): Represents all elements that are in A, B, or both. In a Venn diagram, you shade everything inside both circles. ∩ (Intersection): Represents elements that are in both A and B at the same time. In a Venn diagram, you shade only the overlapping area. “Not A” is written as A’ (A complement). In a Venn diagram, shade everything outside circle A, including the area outside both circles or in other sets (like B) that are not in A. Yes, depending on the context: A subset (A ⊆ B) means all elements of A are in B. A superset (A ⊇ B) means A contains all elements of B. If A = B, then A is both a subset and a superset of B (called an improper subset/superset). An empty intersection (A ∩ B = ∅) means the sets have no elements in common. In a Venn diagram, draw the circles separately so they do not overlap. The universal set (U) contains all possible elements under consideration. It helps define complements (e.g., A’ = everything in U that is not in A) and provides a reference for all set operations in the diagram. A Δ B represents elements that are in A or B but not in both. In a Venn diagram, shade the parts of A and B excluding the overlap.FAQs on Symbols for Venn Diagrams
What is the difference between ∪ and ∩?
How do I represent “not A” in a diagram?
Can a set be both a subset and a superset?
How do I show an empty intersection?
Why do we need a universal set?
What is a symmetric difference (A Δ B)?