If you’re wondering how to create a Venn diagram in Excel, then you’ve come to the right place. We explore what Venn diagrams are, how to make a Venn diagram in Excel, and understand the challenges of using Excel for this. This guide also covers an easier to use and better alternative which comes with plenty of ready-made templates for making Venn diagrams.
What is a Venn Diagram?
A Venn diagram is a visual method for comparing two or more sets by illustrating how they intersect and how they stand apart. It uses overlapping circles to show common traits in shared areas and distinct attributes in the non-overlapping parts. Frequently used in math, logic, data analysis, and decision-making, Venn diagrams help simplify relationships and make comparisons easy to interpret at a glance.
How to Make a Venn Diagram in Excel
Follow these steps to learn how to draw a Venn Diagram in Excel.
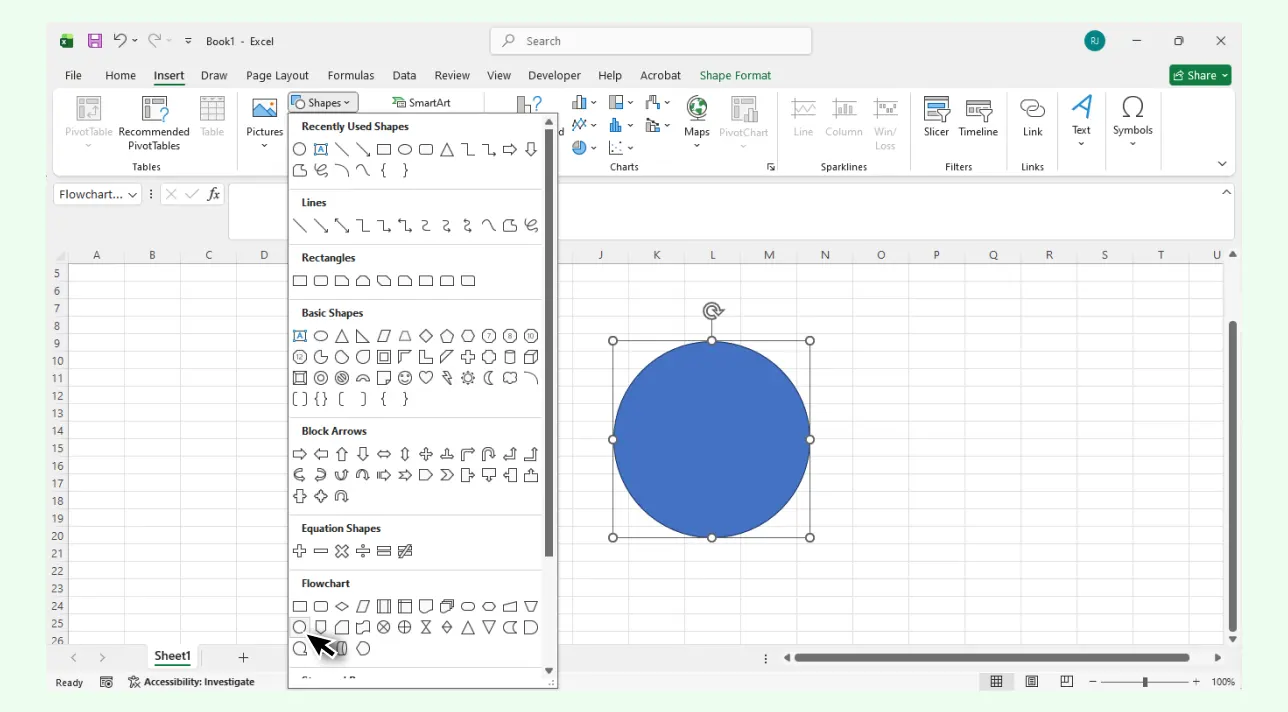
Step 1: Insert the drawing shapes
Go to Insert → Shapes and choose the Oval tool. Excel doesn’t include a built-in Venn diagram option, so each circle must be created manually.
Alternative: You can try Insert → SmartArt → Relationship, which offers a basic Venn layout, but it’s limited in how much you can customize circle size, overlap, and transparency. This is why most users still prefer drawing the circles manually for accuracy.
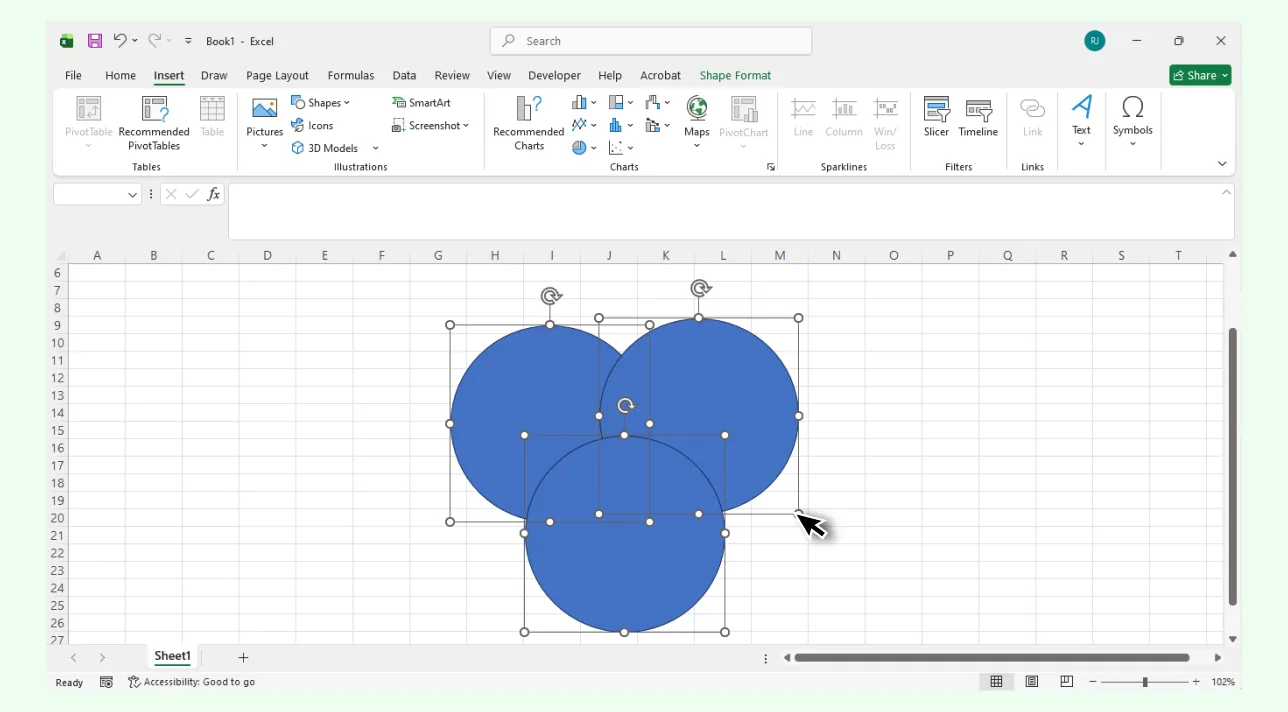
Step 2: Draw and duplicate your circles
Hold Shift while drawing to keep the circle perfectly round. Copy and paste to create additional circles, then position them so they overlap. Since Excel has limited snapping, achieving precise alignment may take a bit of trial and error.
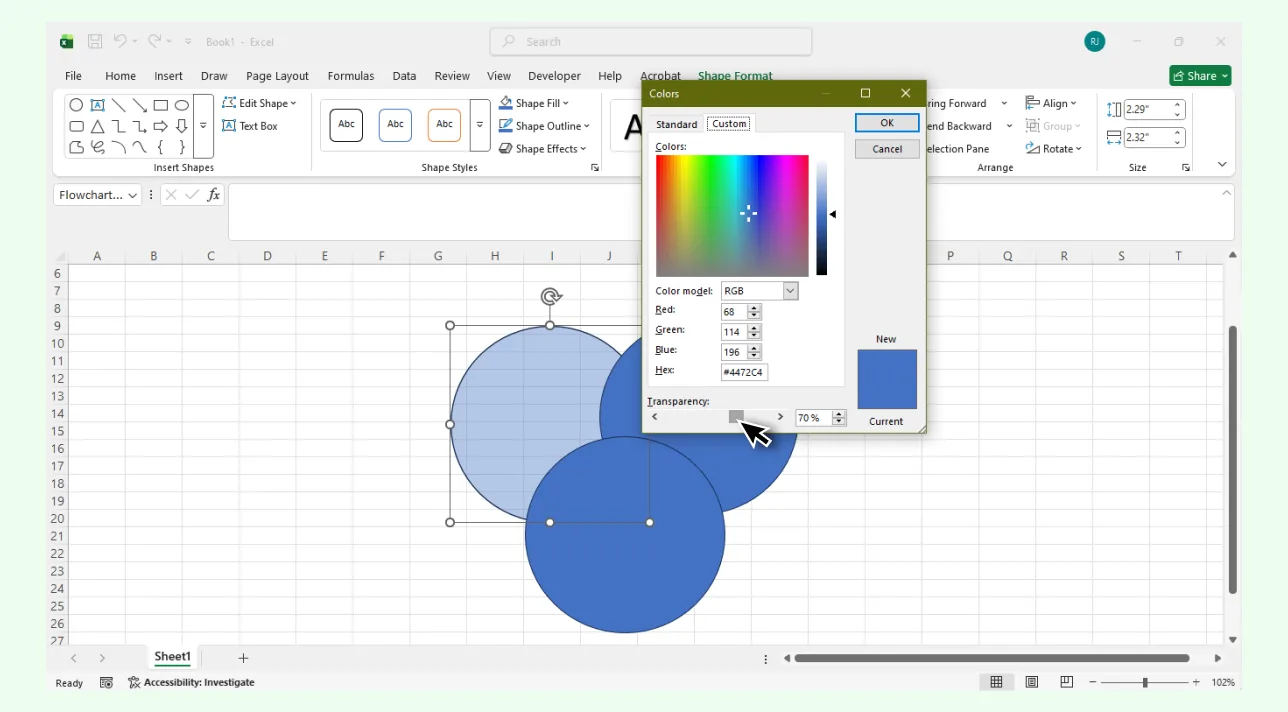
Step 3: Adjust transparency to show the overlap
Select a circle → Shape Fill → More Fill Colors → adjust Transparency. Because Excel doesn’t blend shapes automatically, visibility of the overlap depends on careful opacity adjustments.
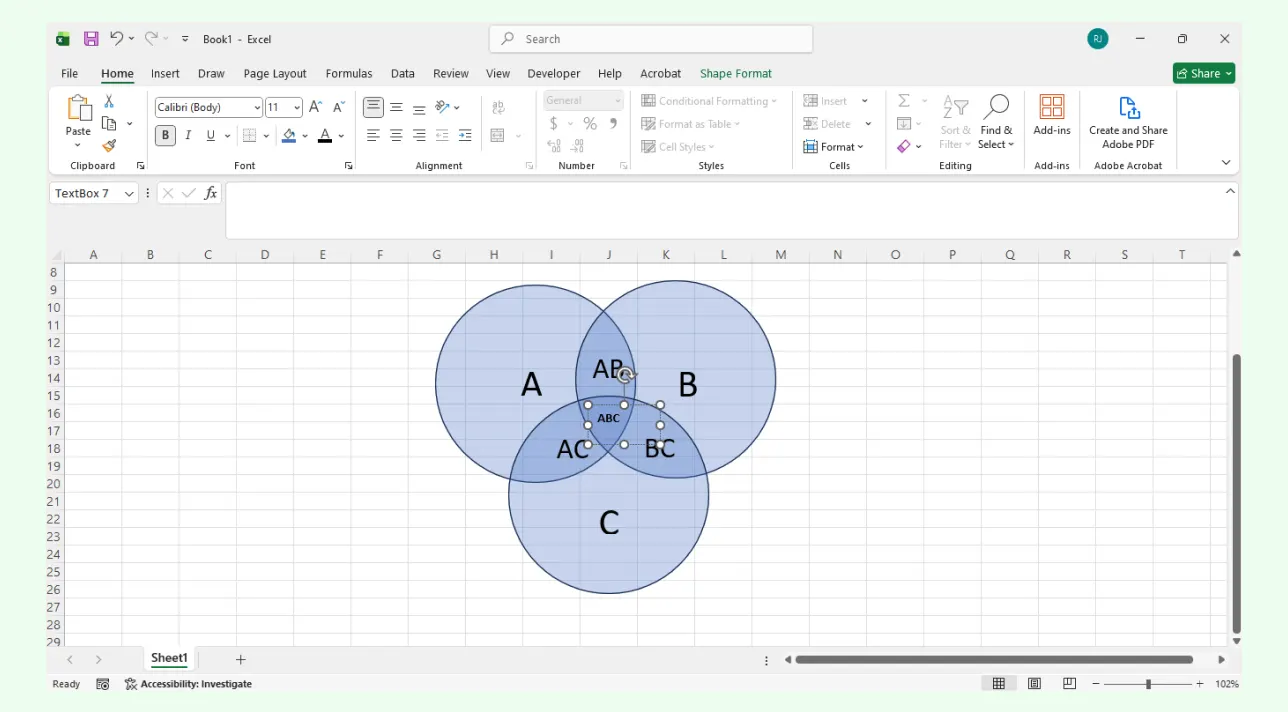
Step 4: Add labels and comparison points
Use Insert → Text Box to add set labels and place text inside each circle and the overlapping regions. Since Excel doesn’t anchor or auto-align text to shapes, placing everything neatly often requires manual fine-tuning.
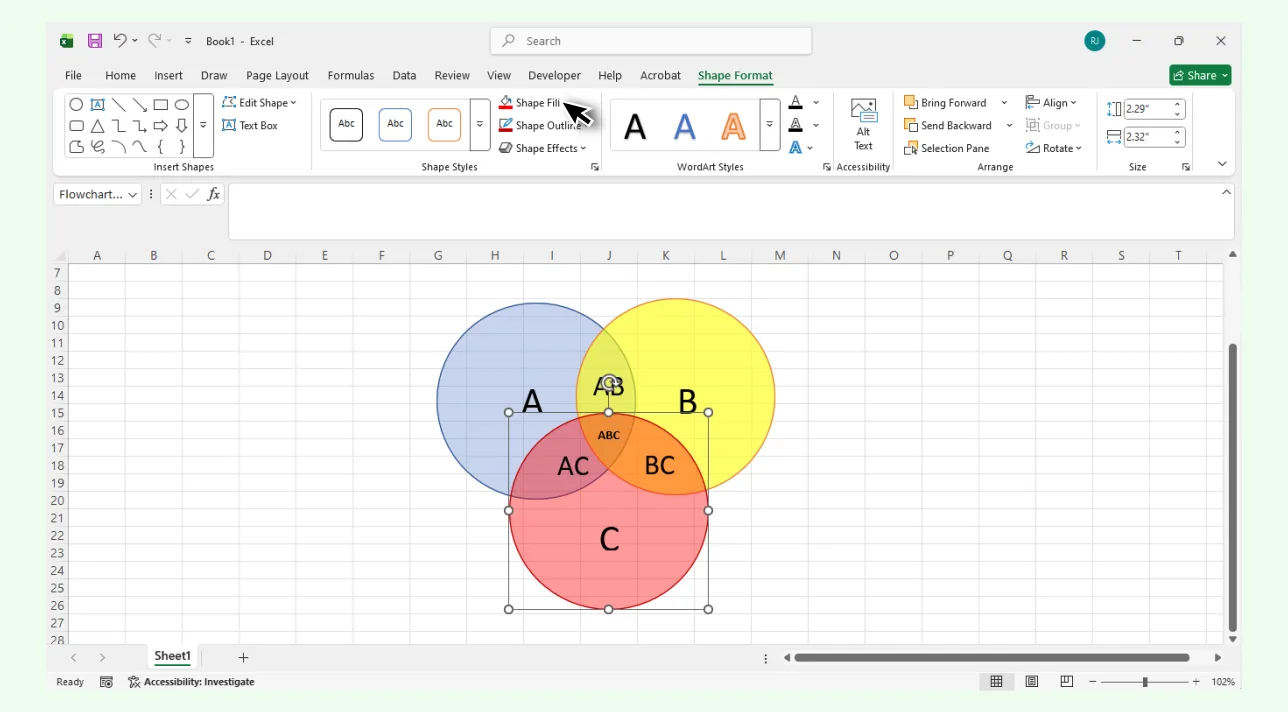
Step 5: Style your diagram
Update colors, borders, and typography using Shape Fill, Shape Outline, and Text Options. While Excel offers some styling controls, they’re not optimized for producing polished diagrams, so formatting may take extra effort.
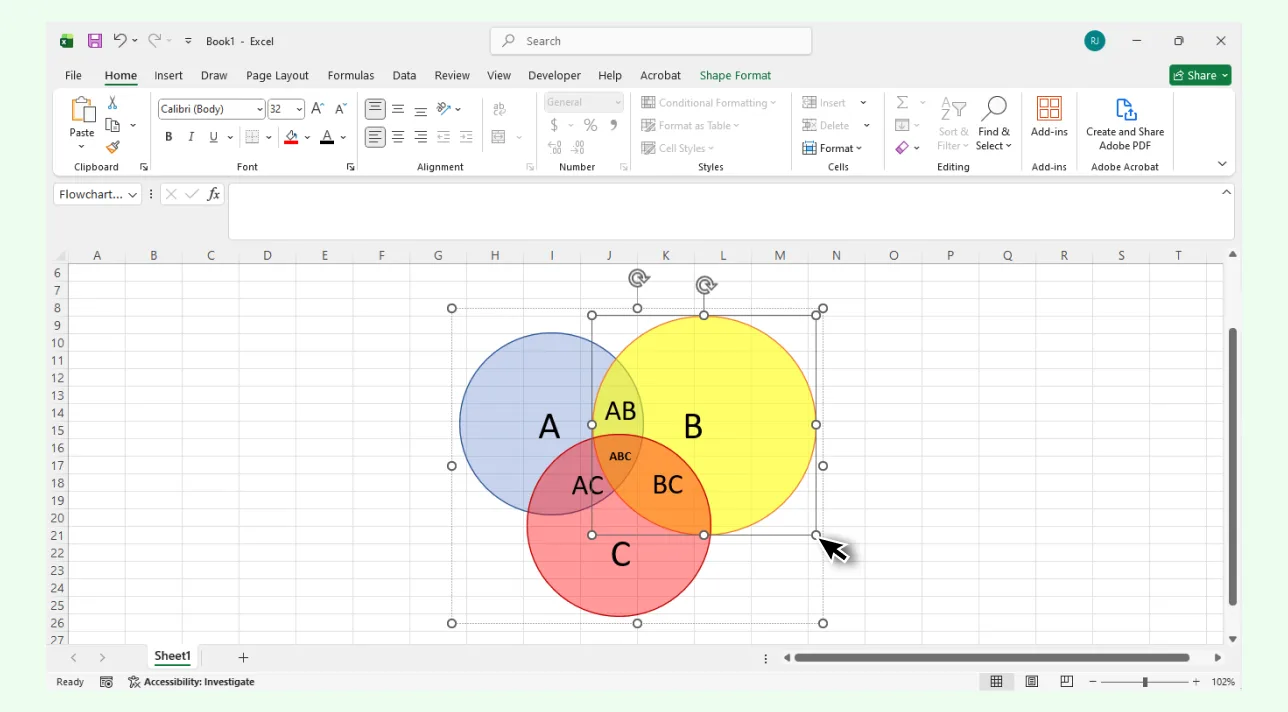
Step 6: Position or resize the diagram on your worksheet
Move or resize the diagram as needed. Larger or multi-circle diagrams can be tricky because shapes float over the grid instead of sitting in a dedicated drawing canvas.
Step 7: Share or export your diagram
You can keep the Venn diagram inside your workbook or use a screenshot/export to PDF if you need it elsewhere. Note that Excel doesn’t offer a way to export the diagram on its own as an image.
Challenges of Creating a Venn Diagram in Excel
Now that you know how to do a Venn Diagram in Excel, let’s look at some of the limitations of this method.
No dedicated Venn diagram tool: Excel doesn’t include a native Venn diagram feature, so users must manually build diagrams using shapes or rely on limited SmartArt layouts.
Manual alignment and overlap: Circles don’t snap or auto-align, making it difficult to position shapes accurately and create clean intersections.
Limited styling and transparency control: Achieving clear overlaps requires careful manual adjustments, and formatting options aren’t optimized for visual diagrams.
Text boxes that don’t anchor to shapes: Labels must be positioned manually, and any resizing or moving of circles requires repositioning the text.
Restricted workspace: Since diagrams sit on top of grid cells, larger or multi-set Venn diagrams can become cramped and hard to manage.
SmartArt constraints: SmartArt’s Venn layouts allow basic visuals but offer minimal control over circle size, spacing, and transparency, limiting customization.
Challenging to edit or reuse: Modifying or expanding a diagram often disrupts alignment, making updates time-consuming.
No easy export option: Excel doesn’t provide a way to export the Venn diagram as a standalone image without workarounds like screenshots.
Because of these challenges, even basic Venn diagrams can take longer to build and adjust in Excel. A dedicated diagramming tool like Creately simplifies the layout, styling, and structure so you can create clear, accurate Venn diagrams much more efficiently.
Why Creately is the Best Alternative for Making Venn Diagrams
Creately’s Venn diagram maker is designed specifically for visual diagramming, giving you a far smoother and more accurate experience than Excel’s shape-based workflow. Instead of manually aligning circles or fixing formatting issues, you get a complete set of tools built for clarity, speed, and precision.
Diagramming & Design Features
Accurate circle control: Easily resize, overlap, and position circles with precision, without the trial-and-error that Excel’s manual shapes require.
Ready-made Venn diagram templates: Instantly start with 2-set, 3-set, 4-set, or more complex multi-set layouts.
Advanced styling options: Customize colors, opacity, borders, and text in a way that goes beyond Excel’s basic shape formatting.
Consistently polished visuals: All elements stay perfectly aligned as you edit, expand, or rearrange your diagram.
Collaboration & Workflow Features
True real-time collaboration: Build diagrams together with multi-cursor editing and live comments, something Excel’s shape editor can’t support.
Integrated notes and attachments: Add context, files, or links directly to diagram elements for richer documentation.
Built-in version history: Track edits and revert to earlier versions anytime without worrying about overwritten files.
Ease of Use & Flexibility
Simple drag-and-drop editing: Create and refine diagrams without the manual alignment headaches common in Excel.
Infinite canvas space: Work without grid constraints or worksheet limits as your diagram grows.
Suitable for complex diagrams: Easily build multi-layered or advanced Venn diagrams that are difficult to maintain in Excel’s grid-based interface.
For a step-by-step walkthrough using Creately’s tools, check out our guide on how to create Venn diagrams quickly and effectively.
Venn Diagram Excel Vs Creately Features Comparison
Creating a Venn diagram in Excel often means wrestling with manual shapes, alignment issues, and a grid that isn’t built for visual work. So here’s how Creately compares when you need something faster, cleaner, and easier to manage.
Feature | Excel | Creately |
Built-in Venn diagram templates | Limited SmartArt option with minimal control | Multiple ready-made 2-set, 3-set, 4-set, and advanced multi-set templates |
Circle alignment & positioning | Manual adjustments; no snapping or precision guides | Auto-alignment, smart guides, and pixel-level control |
Transparency & overlap visibility | Manual opacity settings, harder to fine-tune | Adjustable opacity with smooth blending and clear intersections |
Label placement | Text boxes float; need to be repositioned manually | Anchored labels with smart alignment tools |
Styling options | Basic colors, outlines, and effects | Full styling control for colors, borders, text, and themes |
Handling complex / multi-set Venns | Difficult to scale beyond 2–3 circles | Supports multi-layered, nested, and advanced Venn diagrams |
Editing workflow | Shapes sit over grid cells; updates often disrupt layout | Fluid canvas editing with intuitive drag-and-drop |
Real-time collaboration | Limited when editing shapes | True multi-cursor collaboration and live comments |
Canvas flexibility | Confined to worksheet grid | Infinite canvas with no layout restrictions |
Export options | No direct image export; requires screenshots | Export as PNG, SVG, or PDF instantly |
Free Venn Diagram Templates to Get Started


Helpful Resources for Creating Venn Diagrams
Learn how to make Venn diagrams using Microsoft Word.
Learn how to make Venn diagrams using Google Docs.
Understand the differences between Venn diagrams and Euler diagrams.
Discover all the different symbols used in Venn diagrams.