Understanding the difference between UML vs. ERD is essential for anyone involved in software or database design. While both are visual modeling tools, they serve distinct purposes. In this guide, we’ll explore what UML and ER diagrams are, their key differences, use cases, and comparison through examples to help you decide which diagram to use for your next project.
What are UML Diagrams?
UML (Unified Modeling Language) diagrams are standardized visual representations used to model the structure and behavior of software systems. They help developers, analysts, and designers understand how different components of a system interact, making complex systems easier to design and maintain. UML diagrams can be broadly classified into two categories:
- Structural diagrams – such as Class, Component, and Deployment Diagrams, which describe the static aspects of a system (what it is).
- Behavioral diagrams – such as Use Case, Sequence, Activity, and State Machine Diagrams, which represent the dynamic aspects (how it behaves).


What are ER Diagrams?
ER (Entity-Relationship) diagrams are visual tools used in database design to represent the logical structure of data and the relationships between different data entities. They form the foundation for building relational databases by clearly mapping how data is stored, organized, and connected. An ER diagram consists of three main components:
Entities – Represent real-world objects or concepts (e.g., Customer, Order, Product).
Attributes – Define the properties or details of an entity (e.g., Customer Name, Order ID).
Relationships – Show how entities are connected, such as one-to-one, one-to-many, or many-to-many associations.

UML Vs. ERD Key Differences
Understanding the distinctions in UML vs. ERD is crucial for choosing the right modeling approach in software and database design. While both are powerful visual tools, they serve different purposes. The table below highlights the key differences between ERD Vs. UML to help you understand when and where to use each.
Aspect | UML Diagram | ER Diagram |
Full Form | Unified Modeling Language | Entity-Relationship Diagram |
Primary Purpose | Models the structure and behavior of a software or system | Models the data structure and relationships in a database |
Focus Area | System design — how components, classes, and objects interact | Database design — how entities, attributes, and data relate |
Used In | Object-oriented software development and system modeling | Database and data architecture design |
Key Elements | Classes, attributes, operations, associations, actors | Entities, attributes, relationships, primary and foreign keys |
Relationship Types | Association, aggregation, composition, inheritance (generalization) | One-to-one, one-to-many, many-to-many |
Behavior Representation | Supports behavioral modeling (e.g., sequence, activity, and state diagrams) | Focuses only on data structure; does not represent behavior |
Perspective | Describes how the system works and interacts | Describes how data is stored and connected |
Diagram Variants | 14 types (e.g., Class, Use Case, Component, Activity) | Typically one type (ER model) with varying notations (Chen, Crow’s Foot, etc.) |
Users | Software engineers, system analysts, designers | Database designers, data architects, analysts |
Output | Software architecture and system design documentation | Logical and physical database schema design |
When to Use UML Diagrams Vs. ER Diagrams
Both UML and ER diagrams are valuable modeling tools, but they apply to different stages and aspects of system development. Here’s when to use each.
UML Diagram Use Cases
Model software systems and architecture — visualize classes, components, and interactions in object-oriented design.
Understand system behavior — use behavioral diagrams like sequence, state machine, and activity diagrams to map workflows and logic.
Communicate between stakeholders — provide developers, analysts, and clients with a shared visual language for system design.
Plan software implementation — document how modules, functions, and user interactions connect before coding begins.
Model complex applications — ideal for large-scale systems involving multiple processes, integrations, and user roles.
Whether it’s for mapping complex software architectures or documenting user flows, Creately’s online UML diagram maker can help you model every part of your system, edit, and share your designs in real time with your team.
ER Diagram Use Cases
Design and structure databases — identify entities, attributes, and relationships to create a logical or physical database schema.
Plan data storage and retrieval — ensure efficiency, normalization, and minimal redundancy in database design.
Map relationships between datasets — define one-to-one, one-to-many, or many-to-many relationships clearly.
Document existing databases — visualize how data is connected and how different tables relate in an existing system.
Support data-centric projects — ideal for analytics, data warehousing, or backend data architecture planning.
Use Creately’s ER diagram maker to design and structure databases visually, map complex data relationships, and ensure efficiency and accuracy across all your data-driven projects, all while collaborating seamlessly with your team in real time.
UML Vs. ERD Comparison Through Real-World Examples
To better understand the difference between ERD Vs. UML, let’s look at some examples.
UML Class Diagram Example for a Reporting System
In UML, you might create a class diagram to show how different components of the system interact.
Classes: CEO, Project, Report, Employee
Attributes:
- CEO → login, password
- Project → projectID, name, taskIDs, accessRights
- Report → reportID, dateCreated, taskDetails, projectReference
- Employee → employeeID, login, password
Relationships:
- A CEO manages Projects, assigns Employees, and controls their Reports (association)
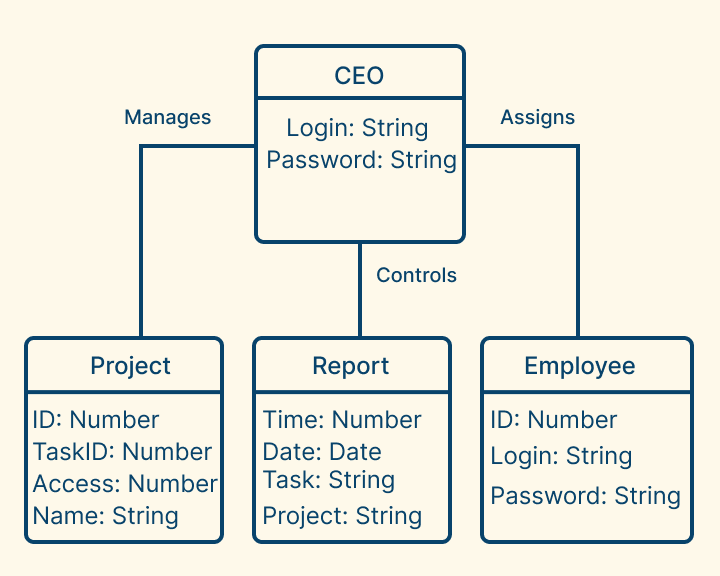
This UML diagram helps visualize how different roles and components of the reporting system are connected, ensuring clarity in system design and implementation. Find a wide variety of class diagrams in our collection of ready-made class diagram templates.
ER Diagram Example for a Reporting System
An ER diagram models the data structure of a company’s reporting system, showing how different entities relate to one another.
Entities: CEO, Project, Report, Employee
Attributes:
- CEO → CEO_ID (Primary Key), login, password
- Project → Project_ID (Primary Key), name, task_IDs, accessRights
- Report → Report_ID (Primary Key), dateCreated, timeCreated, task_ID, project_ID
- Employee → Employee_ID (Primary Key), login, password
Relationships:
- A CEO manages multiple Projects (one-to-many)
- A Project is assigned to one or more Employees (many-to-many)
- An Employee creates one or more Reports (one-to-many)
- Each Report is linked to a specific Project (many-to-one)
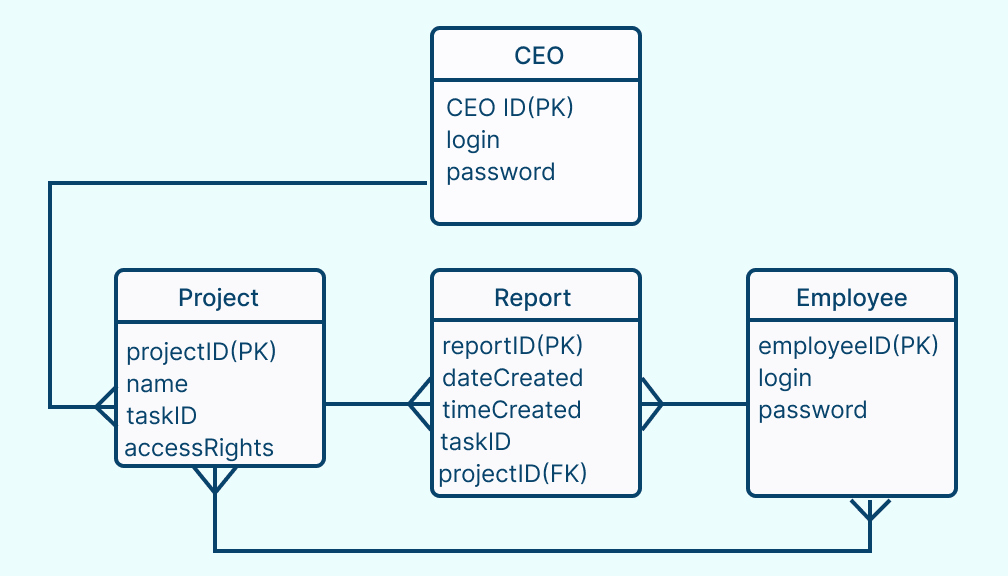
This ER diagram helps database designers understand how data is organized, showing entity connections, cardinalities, and keys essential for building a well-structured relational database. To find more ER diagrams, browse our collection of customizable ERD templates.
Free ERD and UML Diagram Templates to Get Started


FAQs about UML and ER Diagram Differences
Can UML diagrams represent databases?
Can I convert a UML Class Diagram into an ER Diagram?
Can ER diagrams show system behavior?
Are UML and ER diagrams interchangeable?
Resources
Al-Shamailh, Ahmad. “An Experimental Comparison of ER and UML Class Diagrams.” International Journal of Hybrid Information Technology, vol. 8, no. 2, 28 Feb. 2015, pp. 279–288, https://doi.org/10.14257/ijhit.2015.8.2.26.
Andrea De Lucia, et al. Data Model Comprehension: An Empirical Comparison of ER and UML Class Diagrams. 1 June 2008, https://doi.org/10.1109/icpc.2008.26.