The four main types of concept maps are spider maps, flowcharts, hierarchy maps, and system maps. Each layout supports a different job: brainstorming ideas, explaining a process, organizing categories, or analyzing relationships in a system. Use this guide to choose the right concept map type, then start from an editable template.
What Are the 4 Types of Concept Maps?
Concept maps are visual thinking tools that make it easier to understand and analyze relationships between ideas. Different types of concept maps are useful for different jobs, so picking the right layout improves clarity from the start.
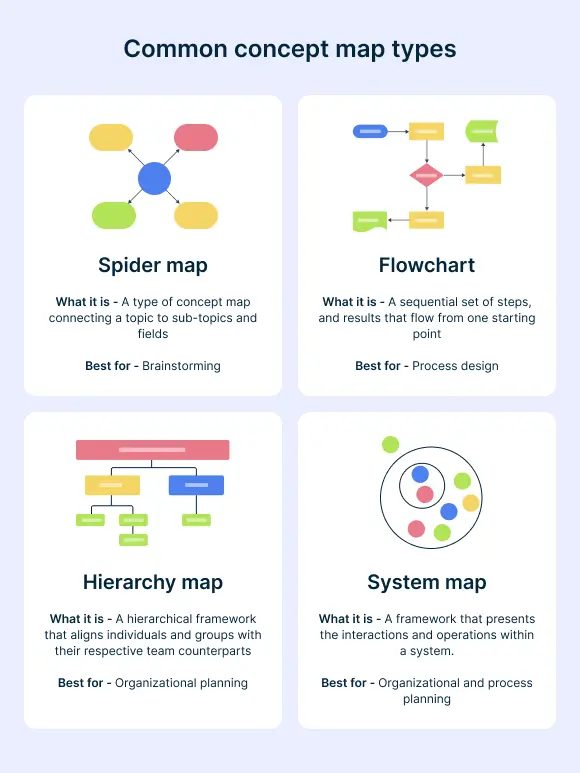
The four most commonly used types of concept maps are:
- Spider Maps: Organize ideas around a central topic, making them ideal for brainstorming and idea generation.
- Flowcharts: Visually map processes and workflows, showing step-by-step sequences for better decision-making.
- Hierarchy Maps: Represent structured relationships and ranked categories, commonly used for organizational charts and classification systems.
- System Maps: Illustrate complex systems by showing how different components interact with each other.
Each type has different strengths. The sections below explain when to use each one and what makes it effective.
4 Types of Concept Maps Explained
Type 1: Spider Maps for Brainstorming and Organizing Ideas
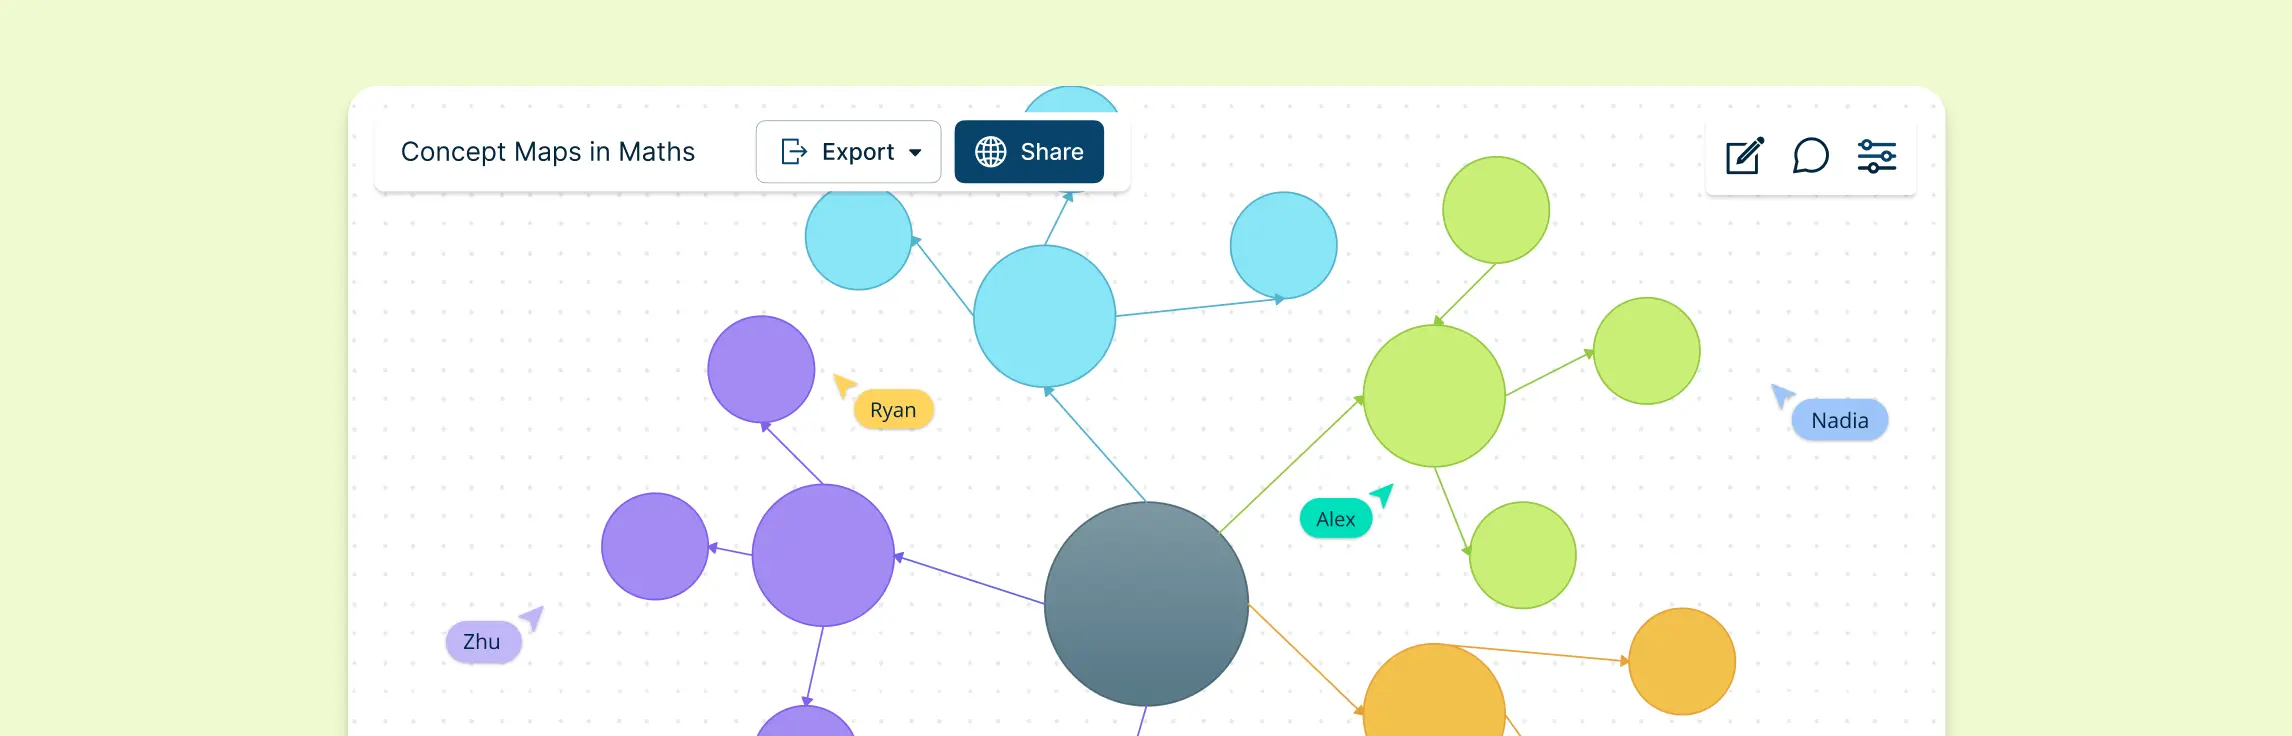
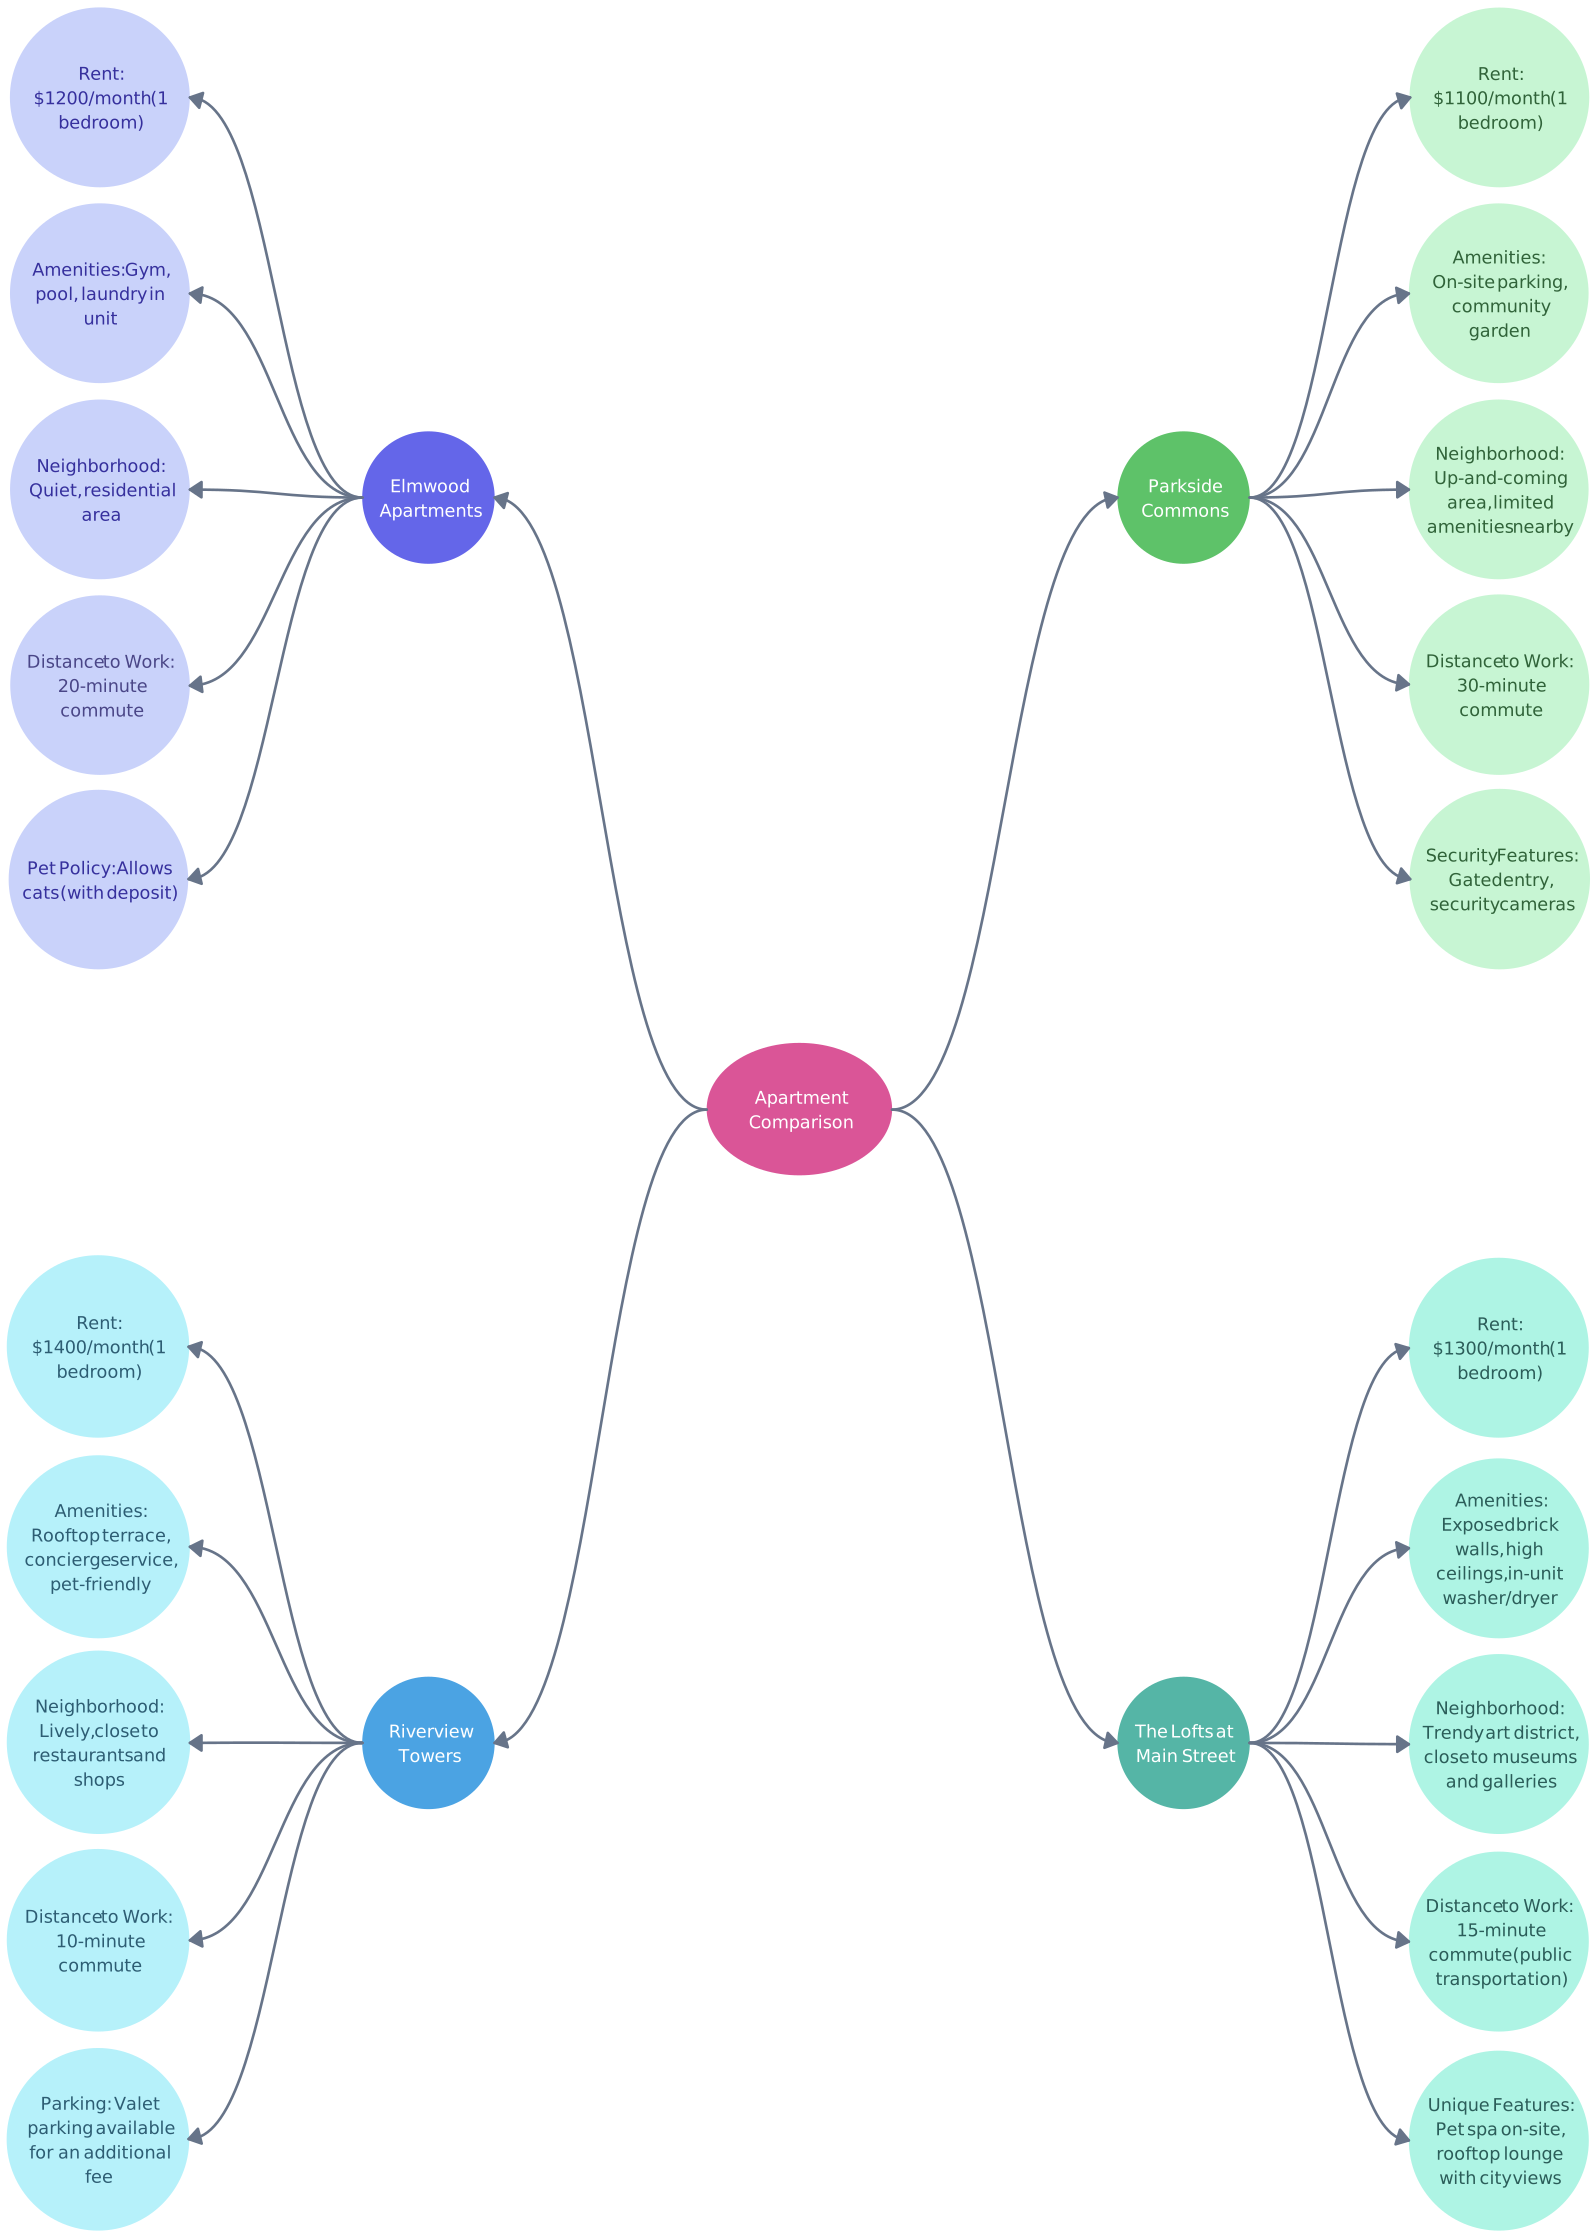
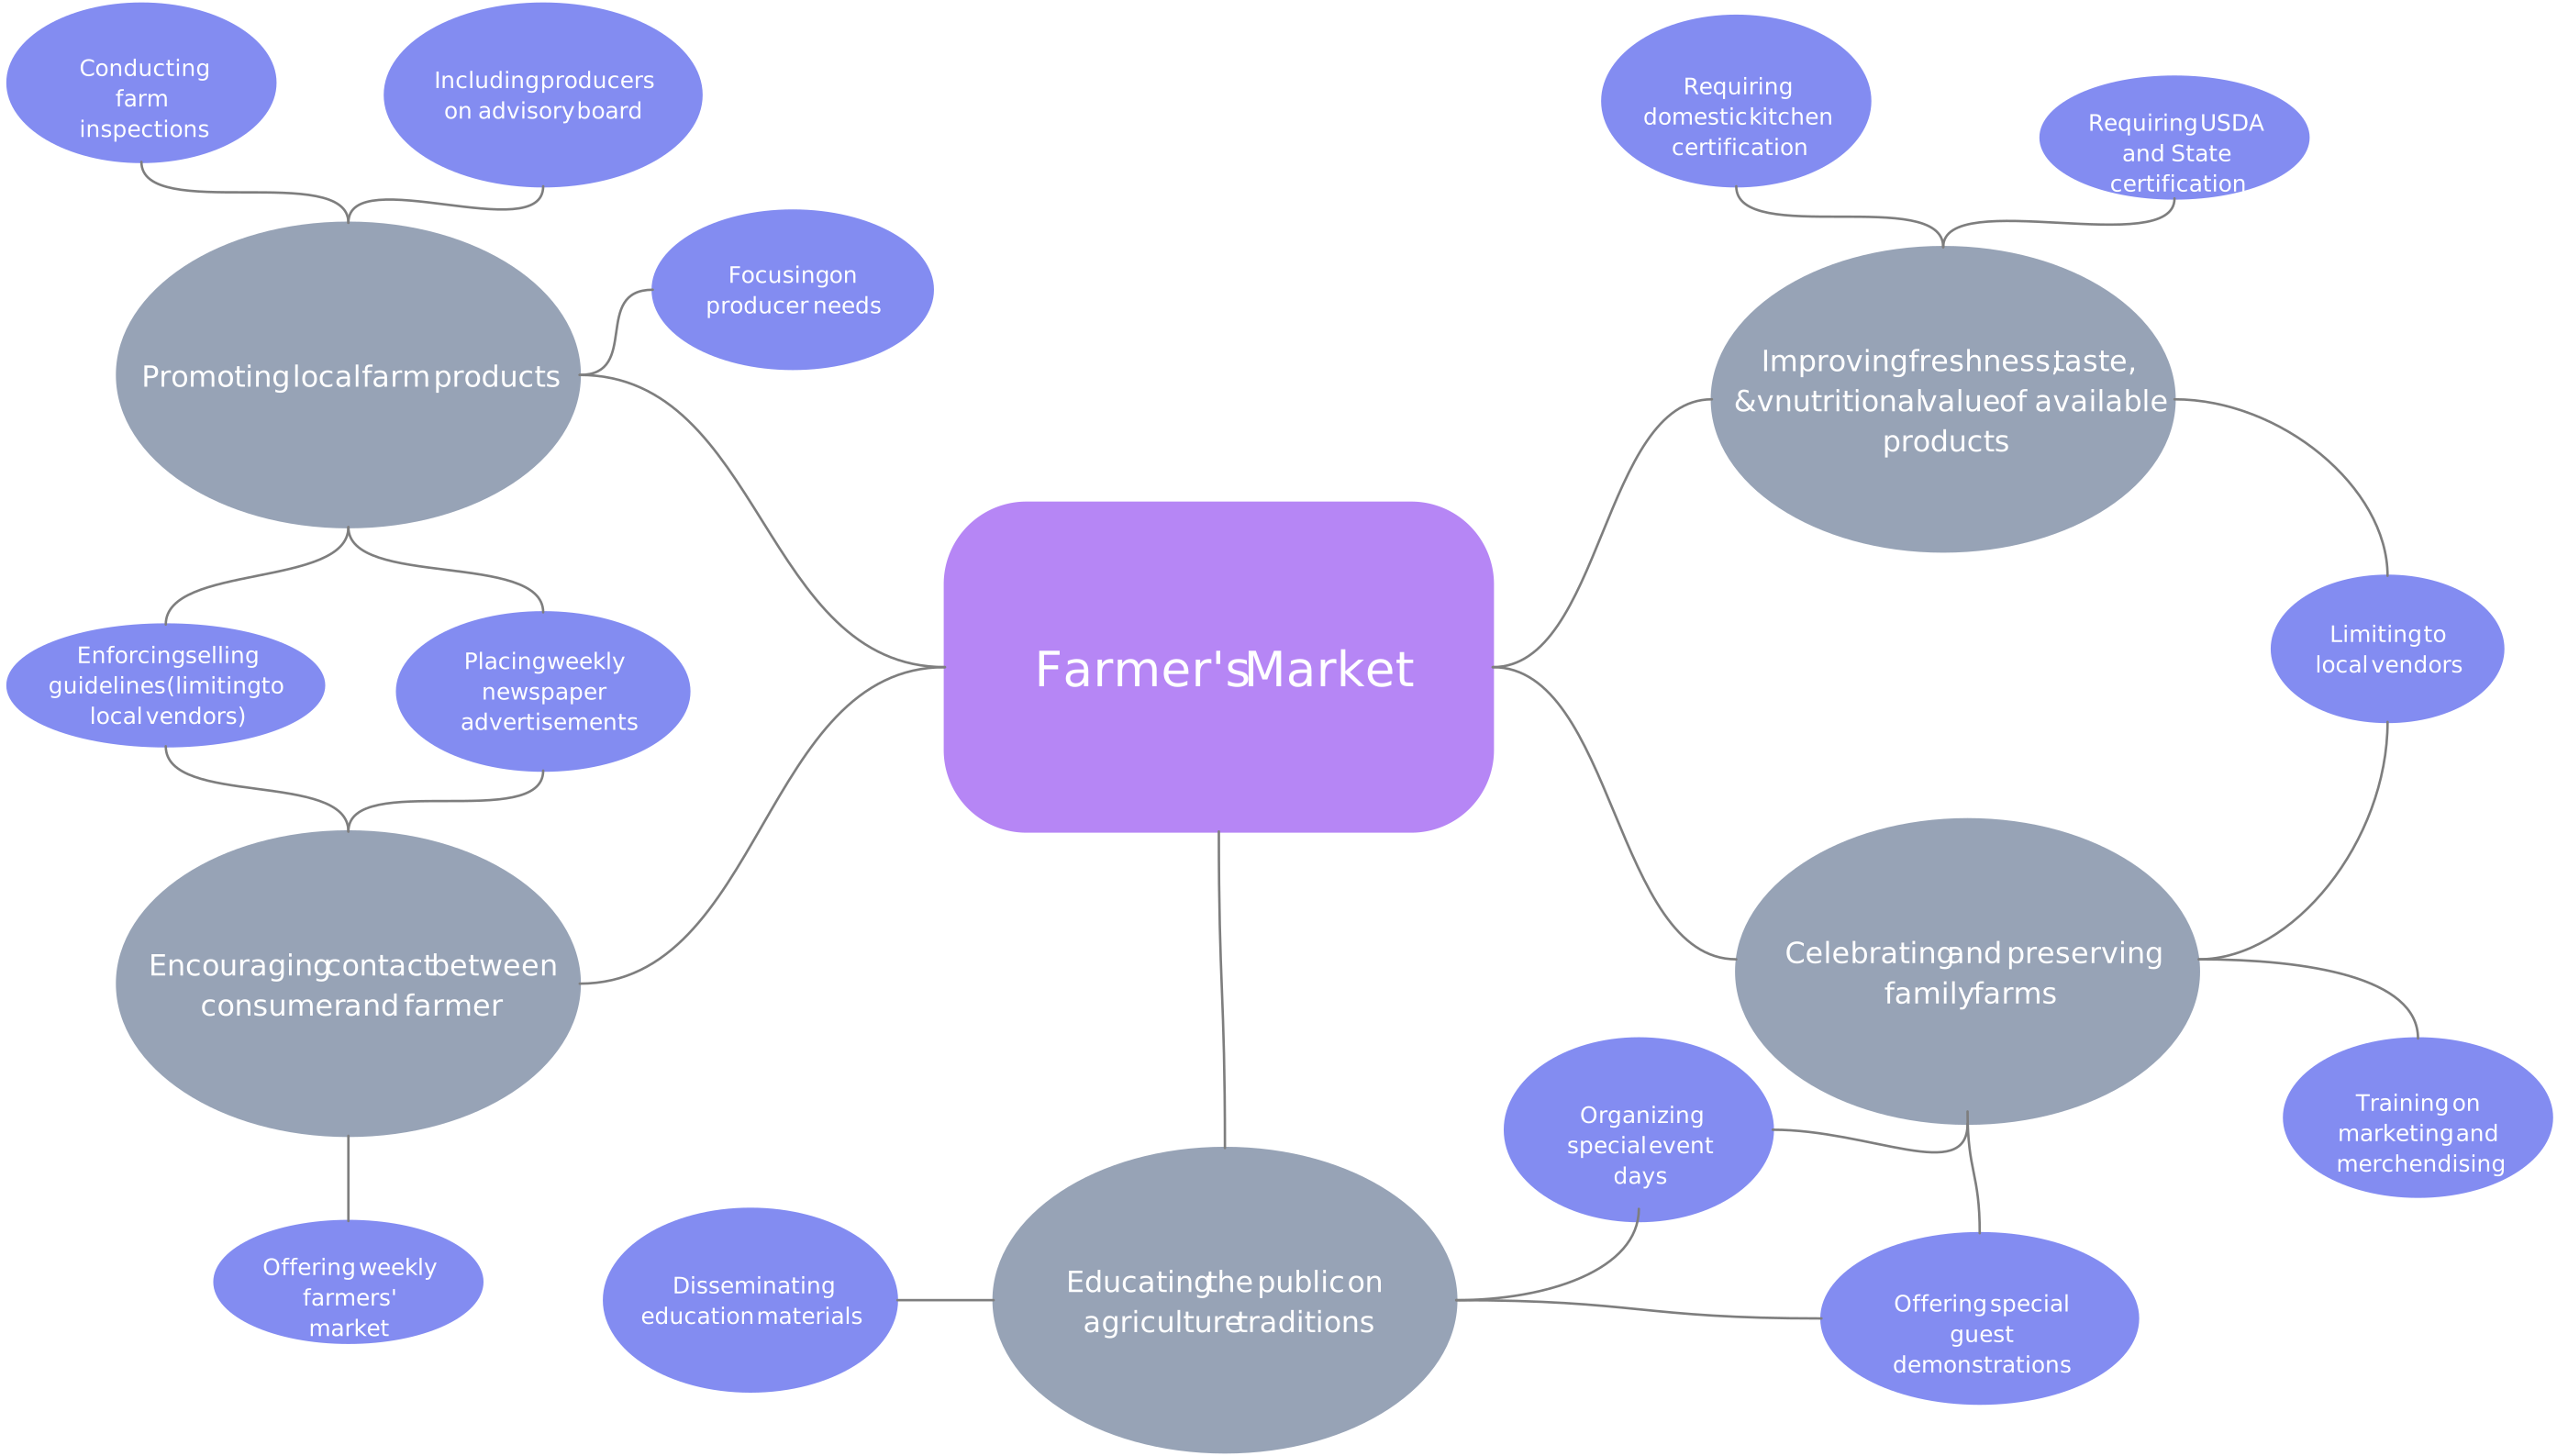
Spider maps are a popular type of concept map built around a main idea or theme, with related ideas radiating outward like the legs of a spider. This structure makes spider maps especially useful for brainstorming, note-taking, and organizing complex information around one core subject.
By visually connecting key concepts, spider maps can improve understanding and recall. They work well in both education and professional planning because they make it easy to capture ideas quickly before organizing them further.
Key Features of Spider Maps
- Central topic at the core: The main concept stays at the center as a clear focal point.
- Branches for related ideas: Subtopics and supporting concepts branch outward to show relationships.
- Strong fit for early-stage thinking: Spider maps are useful when you are exploring, brainstorming, or collecting ideas before narrowing them down.

Type 2: Flowcharts for Visualizing Processes and Workflows
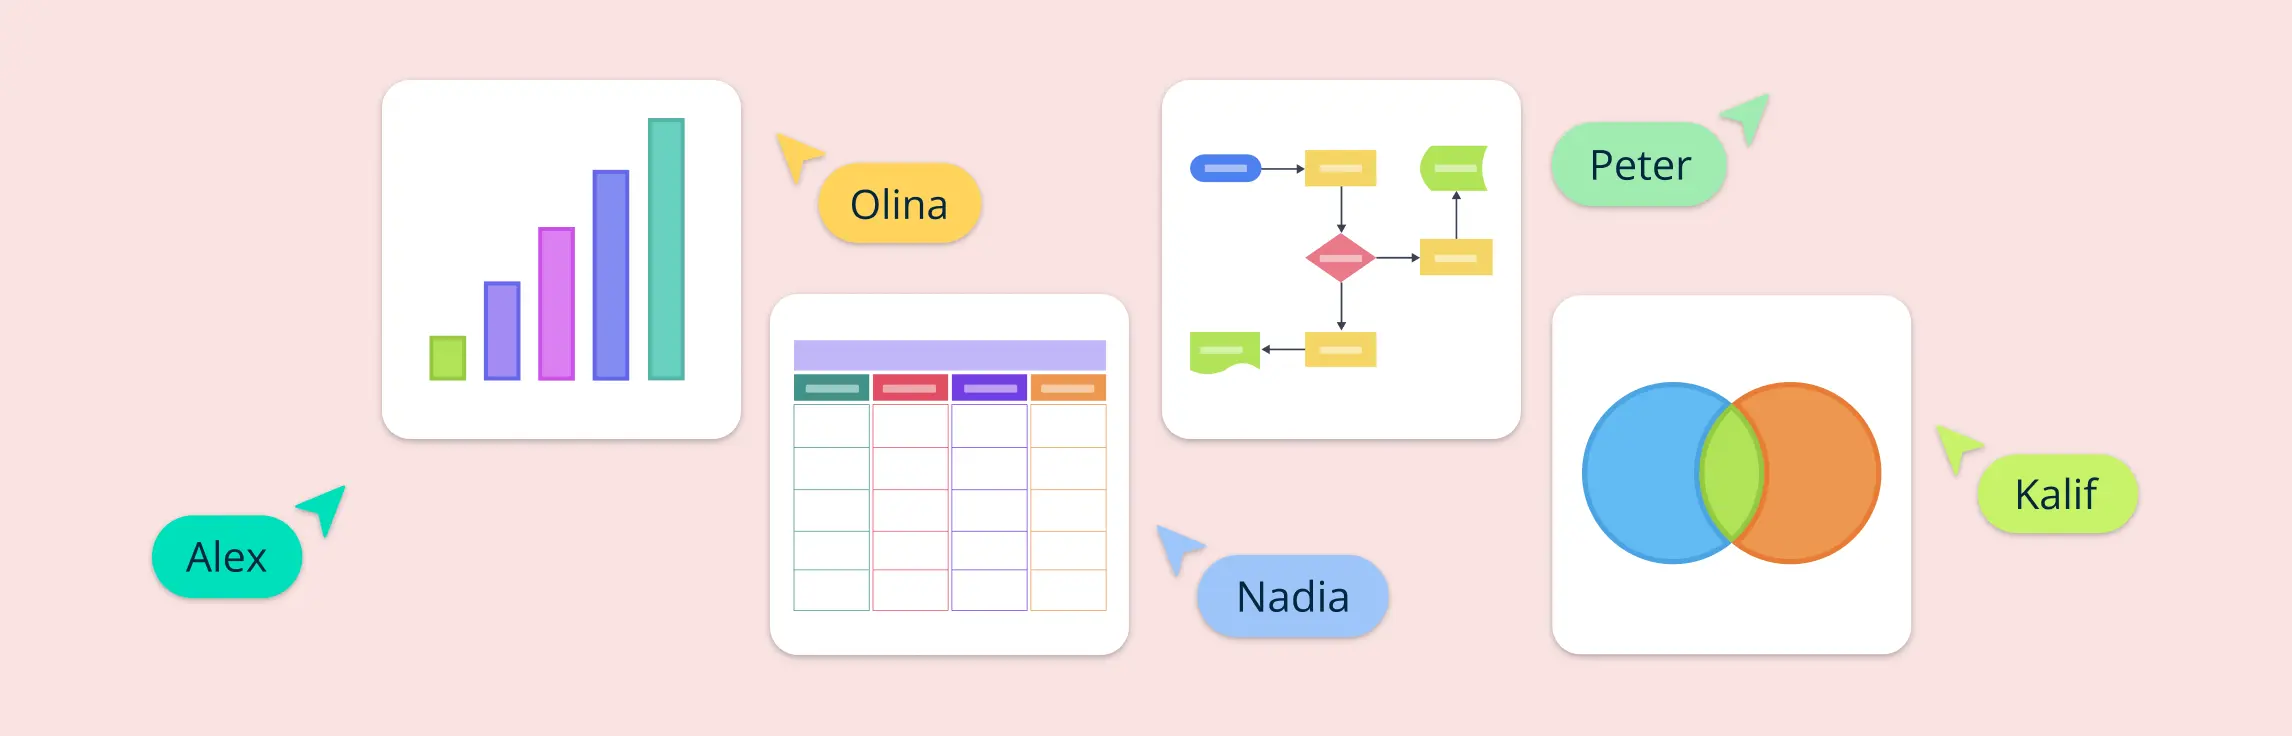
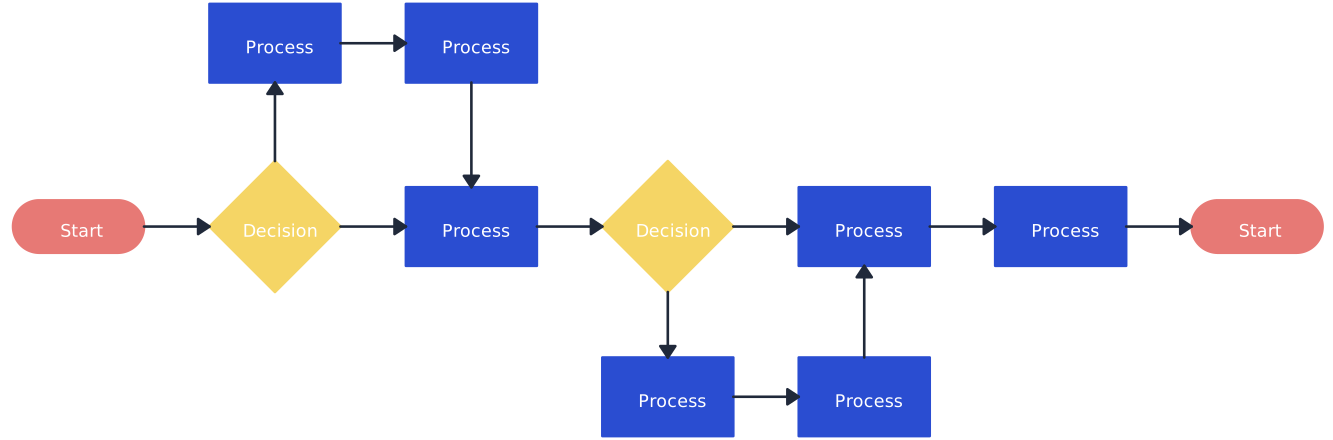
Flowcharts are a widely used type of concept map for representing processes, workflows, and decision paths. They use shapes such as rectangles, diamonds, and ovals to show actions, decisions, and endpoints, while arrows show the order of steps.
Flowcharts are effective when you need to explain how something works from start to finish. They are often used in business process documentation, software development, training, and operations planning because they make each step and handoff easy to follow.
Key Features of Flowcharts
- Step-by-step process visualization: They break down workflows into clear stages.
- Directional arrows for sequence: They show how decisions and actions connect over time.
- Useful for documentation: Flowcharts are strong choices for guides, SOPs, and training materials.
Type 3: Hierarchy Maps for Visualizing Structures
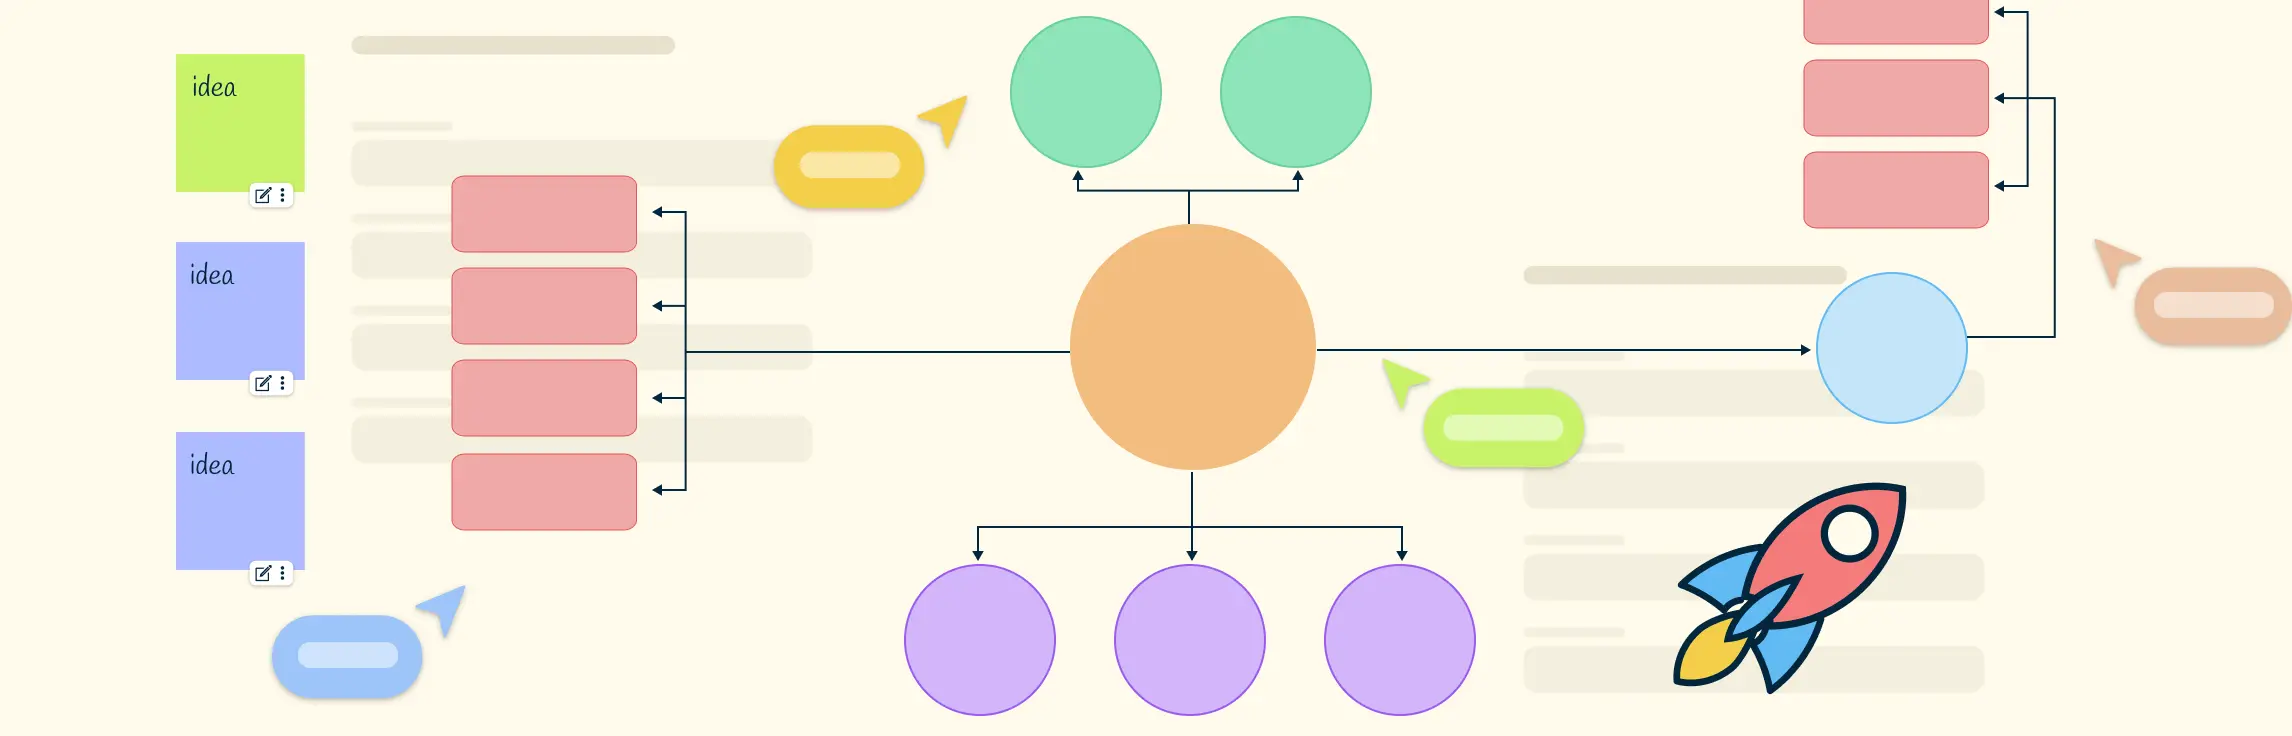
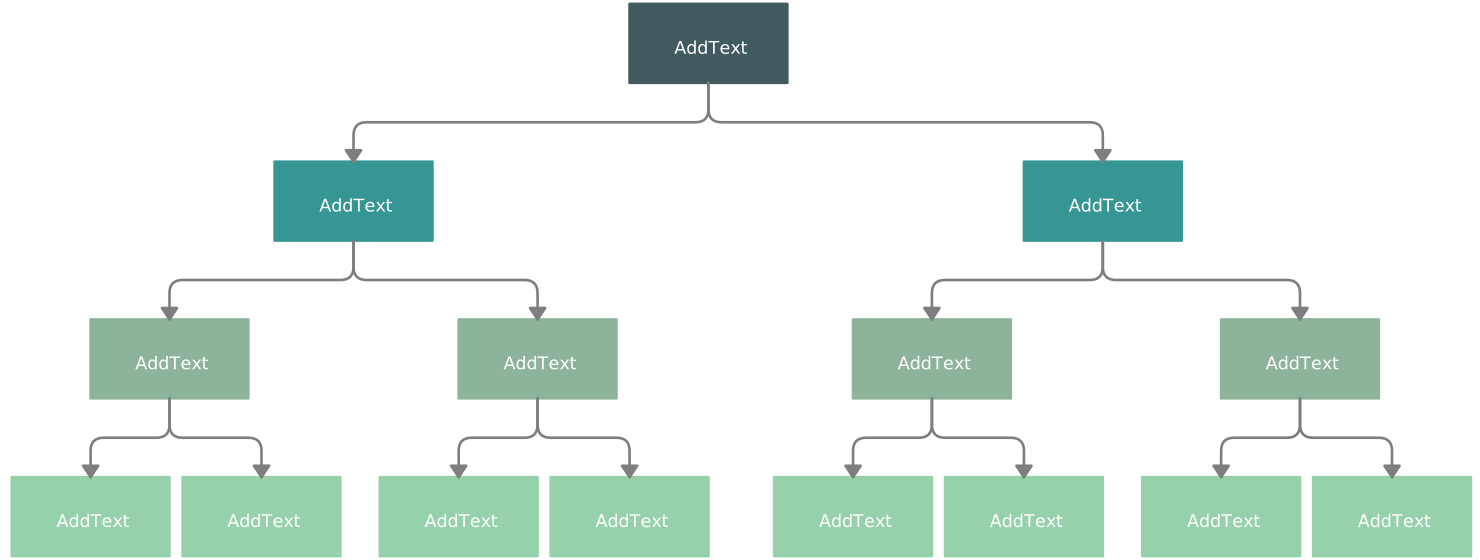
Hierarchy maps, also known as organizational charts, are concept maps that show levels, categories, or reporting relationships in a top-down structure. They are especially useful when you need to show who or what belongs under a larger category.
Hierarchy maps are commonly used for company structures, taxonomies, educational classification, and systems with parent-child relationships. Because they show ranked relationships clearly, they help teams understand ownership, decision-making, and structure at a glance.
Key Features of Hierarchy Maps
- Top-down structure: The layout makes levels and categories easy to scan.
- Clear hierarchical relationships: They show rank, ownership, or classification clearly.
- Useful beyond org charts: They also work for taxonomies, curriculum design, and system structures.
Type 4: System Maps for Analyzing Complex Systems
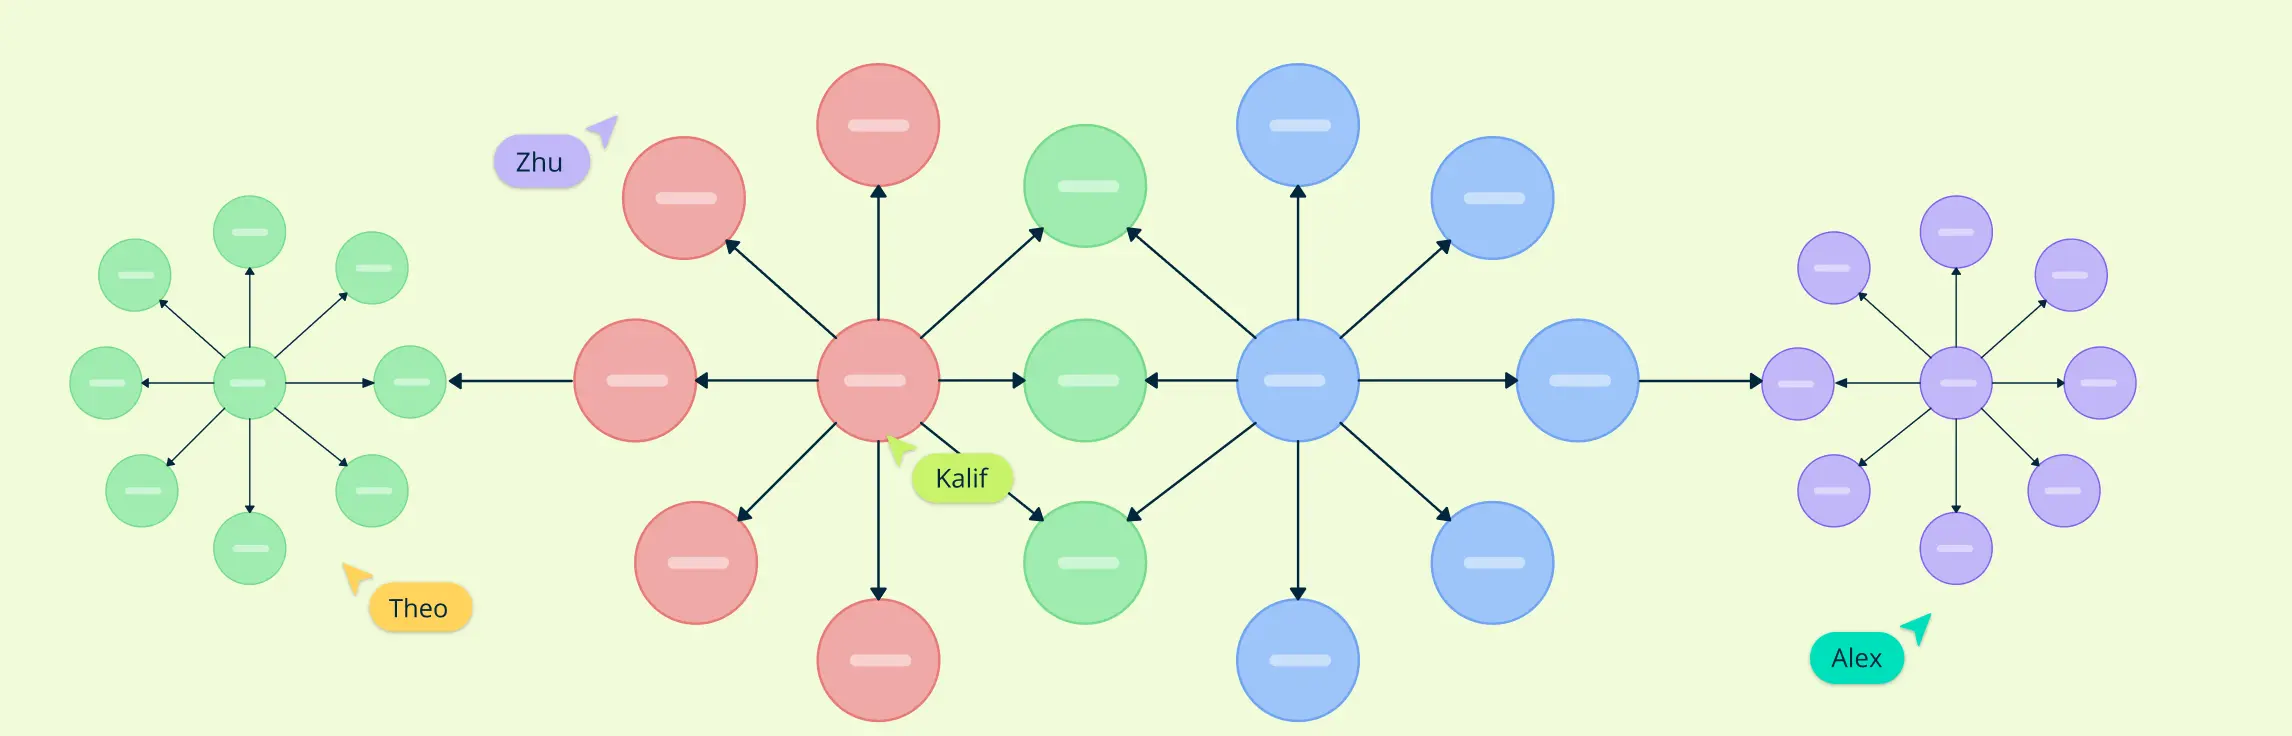
System maps are concept maps designed to show how different parts of a system interact. They often include stakeholders, processes, resources, and influences so you can see dependencies, constraints, and opportunities in one view.
System maps are especially useful in systems thinking, strategic planning, service design, healthcare, education, and environmental management. When a topic has many moving parts, a system map helps reveal how changes in one area may affect others.
Key Features of System Maps
- Shows components and interactions: System maps connect people, processes, resources, and influences.
- Useful for complex analysis: They help break down systems with many interdependencies.
- Supports planning and problem-solving: They help identify issues, leverage points, and opportunities for intervention.
Summary: Comparing Different Types of Concept Maps
| Type of Concept Map | Purpose | Structure | Best Use Case |
|---|---|---|---|
| Spider Map | Brainstorming ideas and exploring relationships | Central topic with sub-themes radiating outward | Ideal for brainstorming, note-taking, and idea generation |
| Flowchart | Representing processes and workflows | Sequential flow with arrows and standard process shapes | Best for process documentation, software development, and business workflows |
| Hierarchy Map | Visualizing structure and rank | Tree-like top-down structure showing levels and categories | Useful for organizational charts, taxonomies, and decision-making structures |
| System Map | Analyzing complex systems and interactions | Network of interconnected components such as stakeholders, processes, and resources | Useful for systems thinking, strategic planning, and multi-factor problem-solving |
Practical Uses of Concept Maps Across Different Industries
Concept maps are useful across many industries because they simplify complex ideas and make relationships easier to understand.
Concept Maps for Education
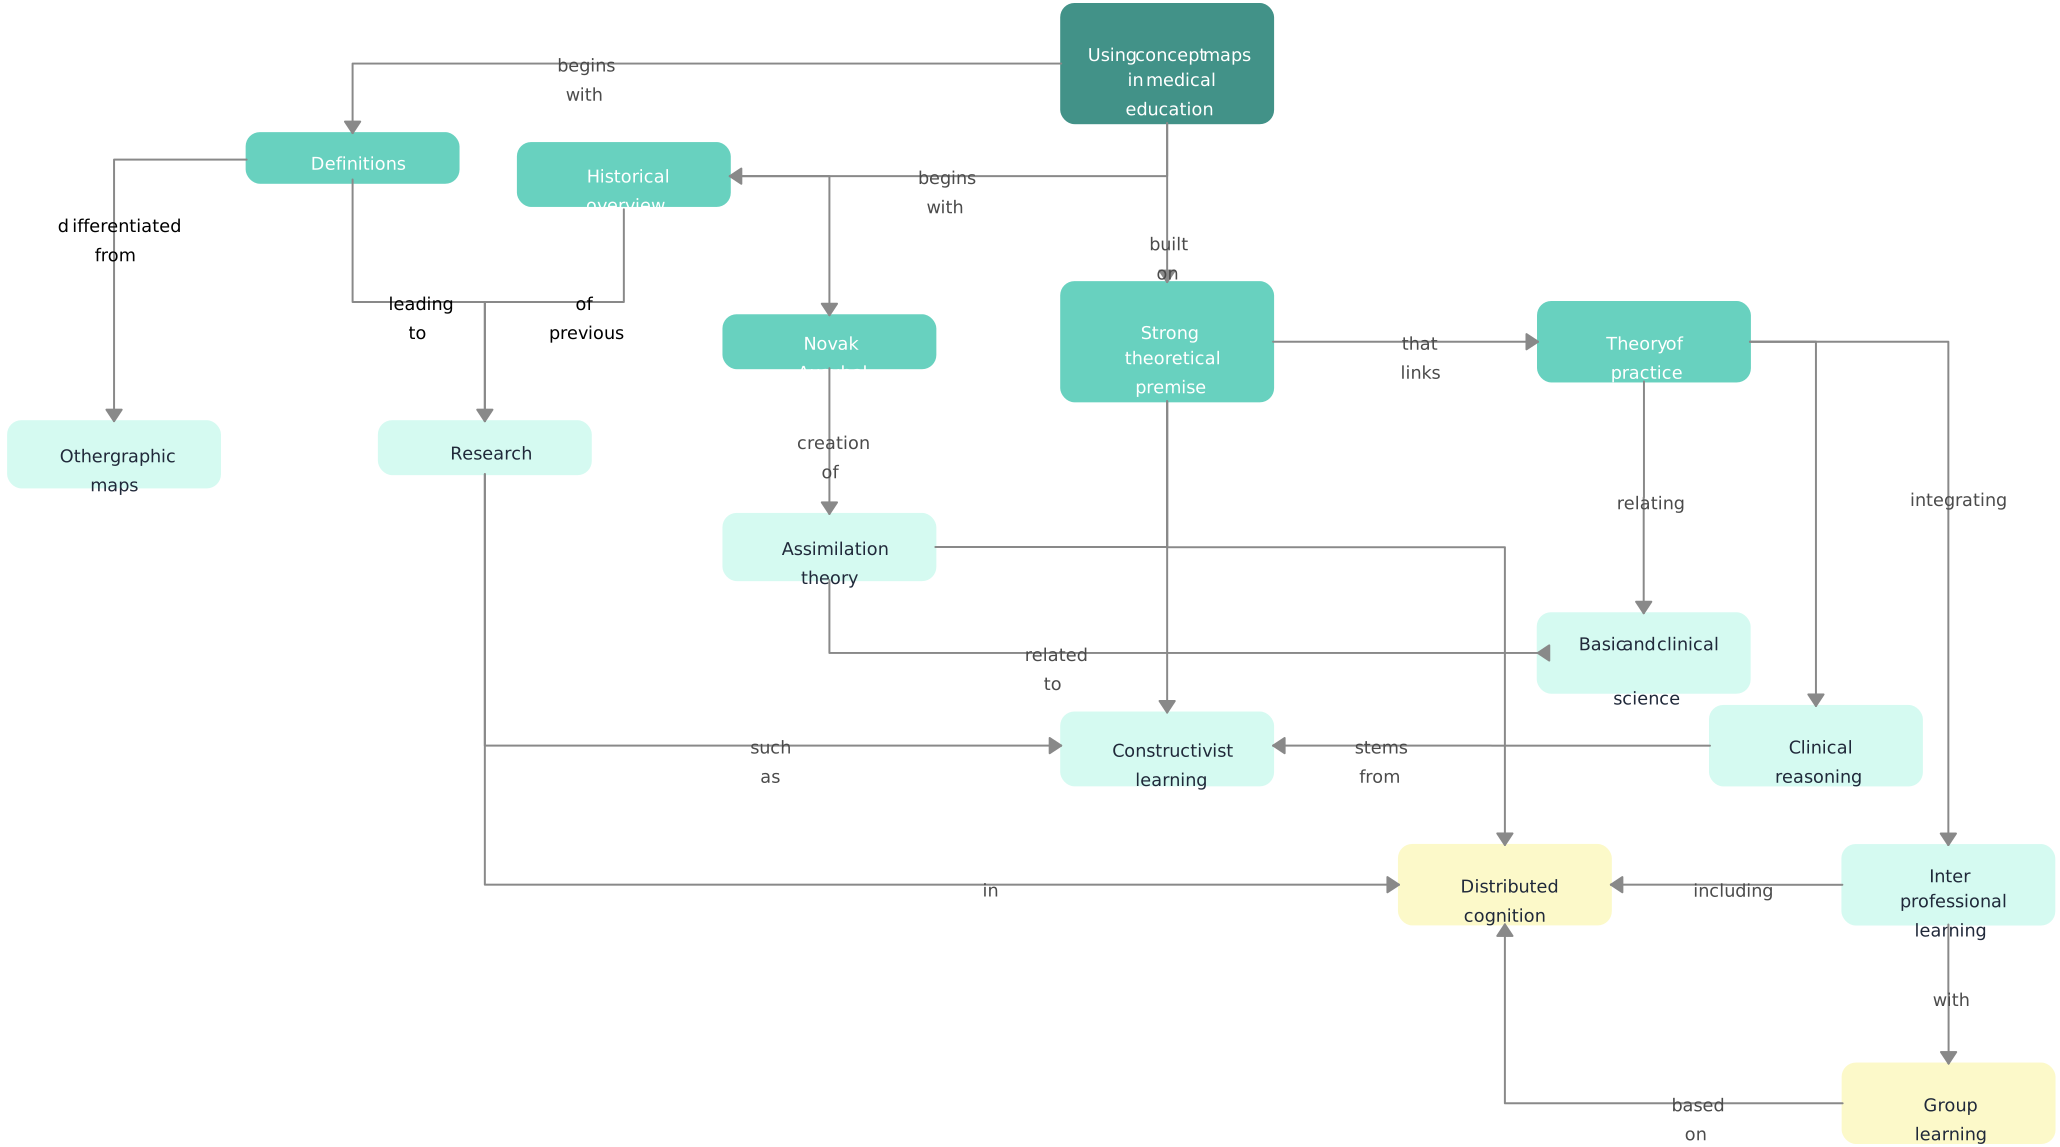
In education, concept maps help break down complex topics into connected ideas that are easier for students to understand and remember. Teachers use them to encourage critical thinking, review topics, and connect new knowledge to prior understanding.
Concept Maps for Business
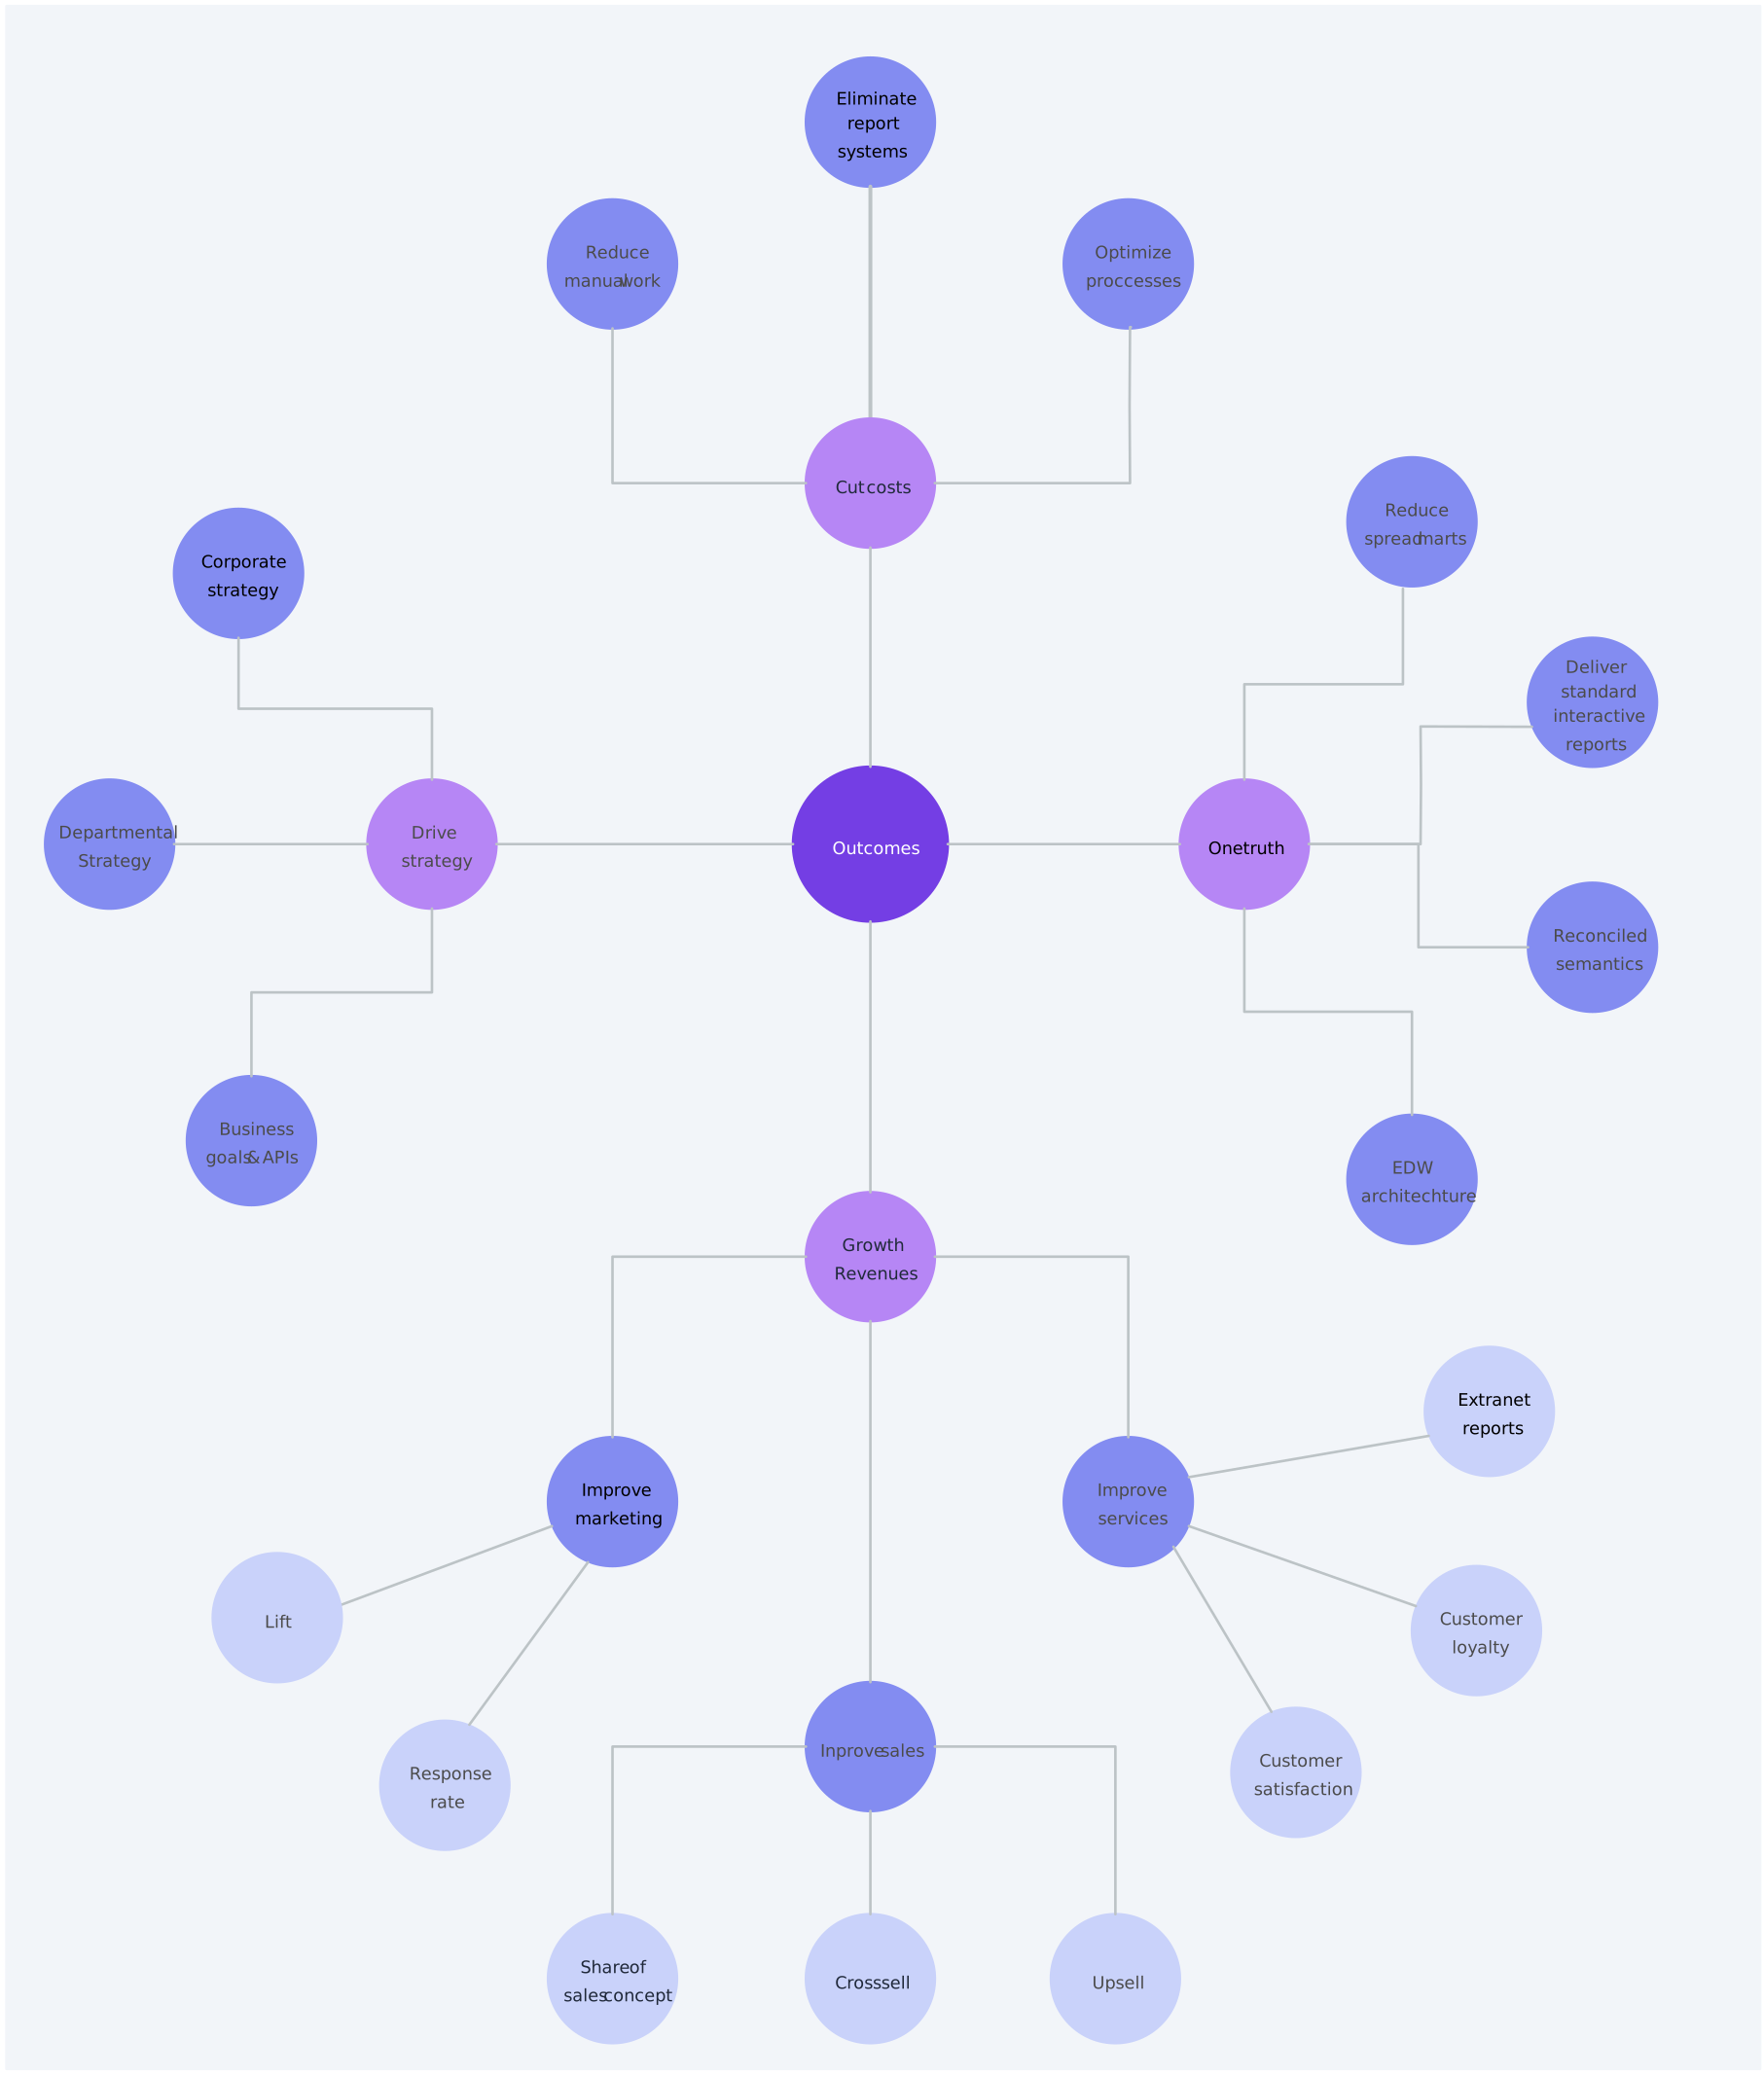
For business teams, concept maps can organize projects, clarify dependencies, and support strategic planning. They help teams connect goals, processes, and stakeholders so discussions stay aligned.
Concept Maps for Software Development
In software development, concept maps help teams plan architecture, model system functionality, and show interactions between components. They can improve communication before detailed technical design begins.
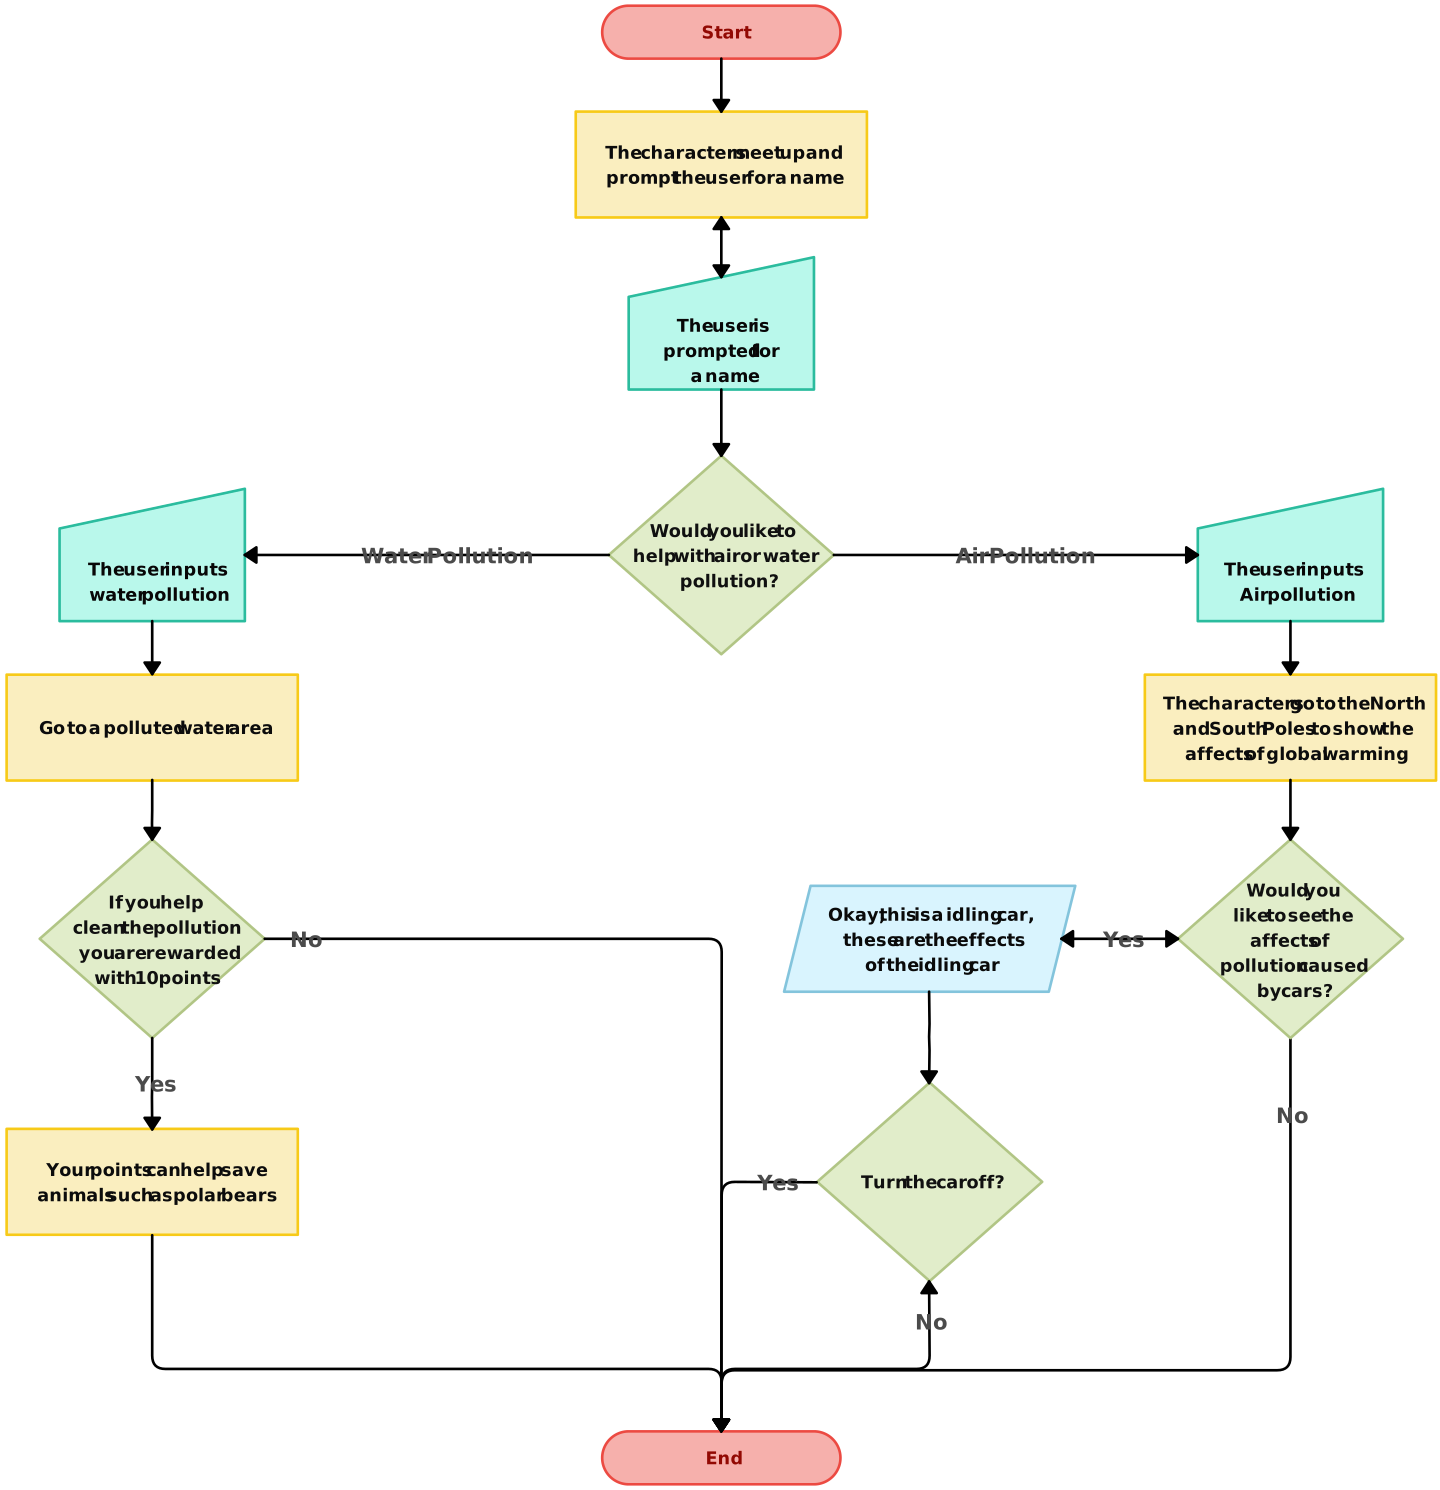
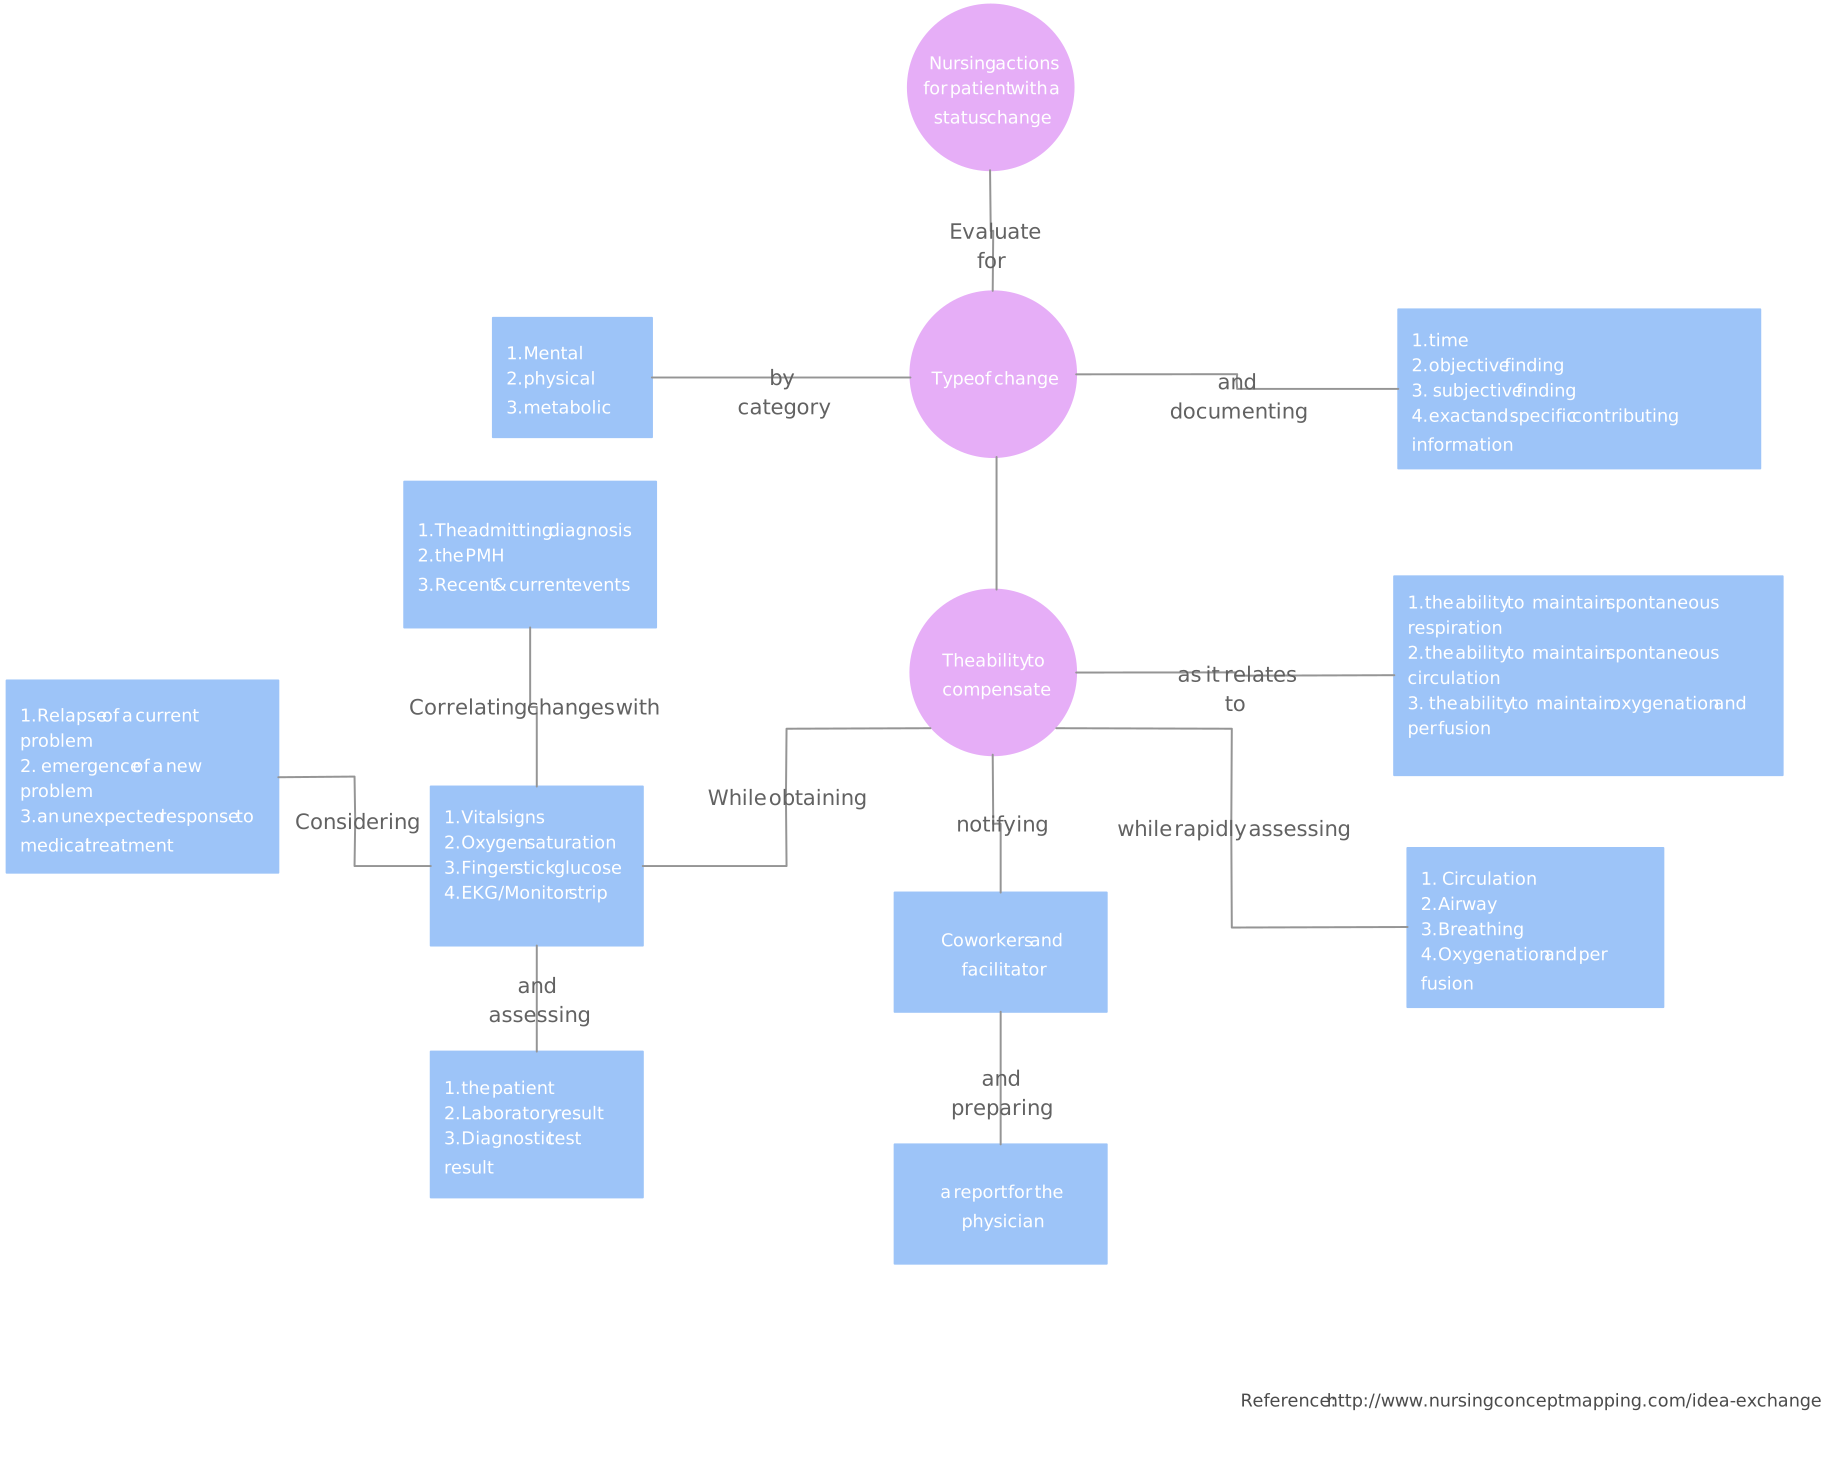
Concept Maps for Healthcare
Healthcare professionals use concept maps to simplify patient education, support care planning, and train staff. By visualizing conditions, treatment factors, and relationships, concept maps can improve understanding and coordination.
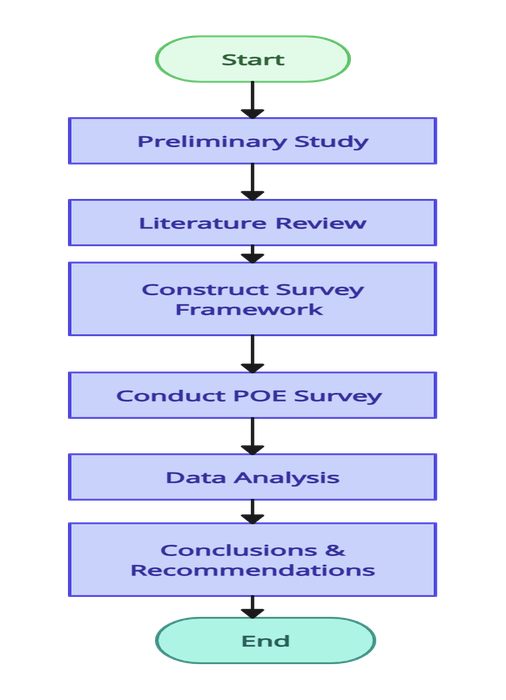
Concept Maps for Research
Researchers use concept maps to structure questions, clarify variables, and visualize relationships between ideas. This can lead to clearer hypotheses, better analysis, and more organized interpretation.
Helpful Resources
Explore how concept mapping supports a dynamic and visual note-taking method that can improve understanding and retention.
Learn how concept maps in science education can help organize and structure knowledge more effectively.
Discover what a career concept map is and explore templates that can help you plan your next steps.
Learn how to create a concept map with ease using Creately.
Key Benefits of Concept Mapping
Here are some of the biggest benefits of using concept maps:
- Visual representation: Concept maps turn dense information into easier-to-understand visual structures.
- Clearer relationships: They make connections and dependencies between ideas easier to see.
- Better comparison: They help users compare concepts, alternatives, and approaches more directly.
- Stronger communication: They support clearer explanation, discussion, and learning across teams and classrooms.
FAQs on Types of Concept Maps
What are the 4 main types of concept maps?
How do I choose the right type of concept map?
Choose the map based on your goal:
- Use spider maps for brainstorming ideas.
- Use flowcharts when outlining steps or decisions.
- Use hierarchy maps to show ranked or categorized structures.
- Use system maps to analyze interactions in a complex environment.
How can I create concept maps easily?
Can I combine different types of concept maps?
Which type of concept map is best for studying?
Resources:
Eppler, M.J. (2006). A Comparison between Concept Maps, Mind Maps, Conceptual Diagrams, and Visual Metaphors as Complementary Tools for Knowledge Construction and Sharing. Information Visualization, 5(3), pp.202-210. doi:https://doi.org/10.1057/palgrave.ivs.9500131.
Schroeder, N.L., Nesbit, J.C., Anguiano, C.J. and Adesope, O.O. (2017). Studying and Constructing Concept Maps: a Meta-Analysis. Educational Psychology Review, 30(2), pp.431-455. doi:https://doi.org/10.1007/s10648-017-9403-9.