Systems mapping is a visual way to understand how parts of a complex system connect, influence each other, and change over time. It is useful when a challenge involves multiple stakeholders, moving parts, or feedback loops that are hard to understand in a linear document.
In this guide, you’ll learn what systems mapping is, when to use it, common methods, the benefits it can create, and a step-by-step process for building a system map.
When to Use Systems Mapping
Systems mapping is especially useful when:
- many stakeholders, teams, or outside factors influence the same outcome
- a process has hidden dependencies, bottlenecks, or unintended consequences
- you need to align a group around a shared view of a complex challenge
- the problem involves feedback loops, changing conditions, or long-term effects
What is Systems Mapping
Systems mapping is a way to visualize the relationships, components, feedback loops, and patterns inside a complex system. Instead of treating a problem as a simple sequence of steps, it helps you see how different actors, processes, resources, and pressures influence one another.
That makes systems mapping useful in business, public services, education, healthcare, sustainability work, and community planning. When a challenge has many interconnected causes or stakeholders, a systems map can make the structure easier to discuss and improve.
Some of the most common benefits of systems mapping include:
- Sustainability Planning: Systems mapping helps teams visualize long-term interdependencies, identify leverage points, and define intervention strategies.
- Enhanced Collaboration: A shared map gives stakeholders a common view of the system, improving discussion, alignment, and decision-making.
- Ecosystem and Service Management: Visualizing relationships across people, resources, and processes helps teams manage complexity more effectively.


Systems mapping is especially helpful when you need to identify hidden dependencies and leverage points before making changes. Methods such as actor mapping and causal loop diagrams can reveal where a small intervention may create broader impact.
Tools like Creately’s Process Mapping Software can support this work with collaborative editing, data integration, and visual templates that make complex relationships easier to document and share.
Systems Mapping for Sustainability Planning
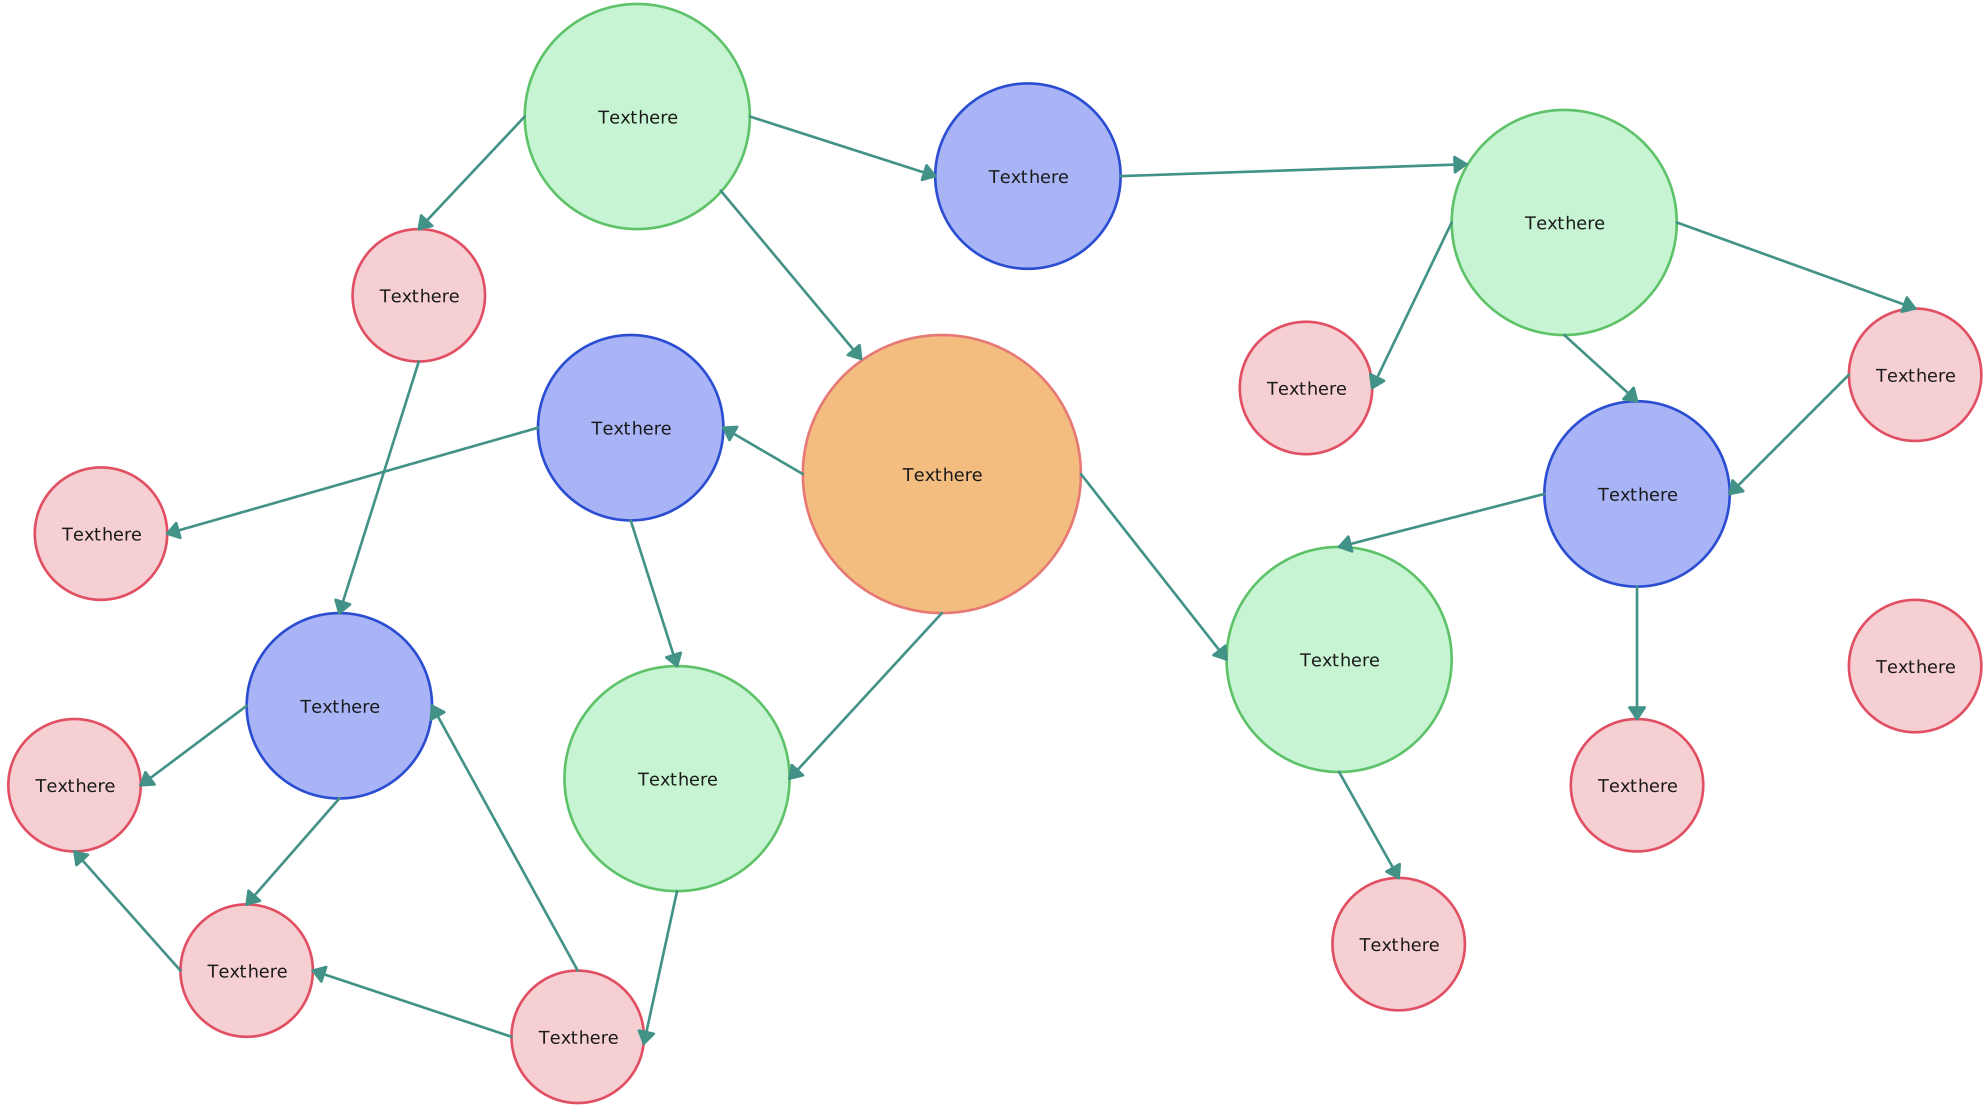
Systems mapping is valuable in sustainability planning because environmental, social, and economic factors are tightly connected. A systems map helps planners see how multiple influences shape an outcome instead of looking at each issue in isolation.
In practice, this means teams can identify key drivers, spot leverage points, and understand how one decision may affect long-term sustainability goals. For example, a map can help show how deforestation contributes to carbon emissions, which then affects climate risk and ecosystem resilience.
Systems Mapping for Enhanced Collaboration
Systems mapping also improves collaboration among stakeholders. By creating a shared understanding of the system and its components, it supports clearer communication and stronger alignment across teams, communities, or departments.
Systems Mapping for Ecosystem Management
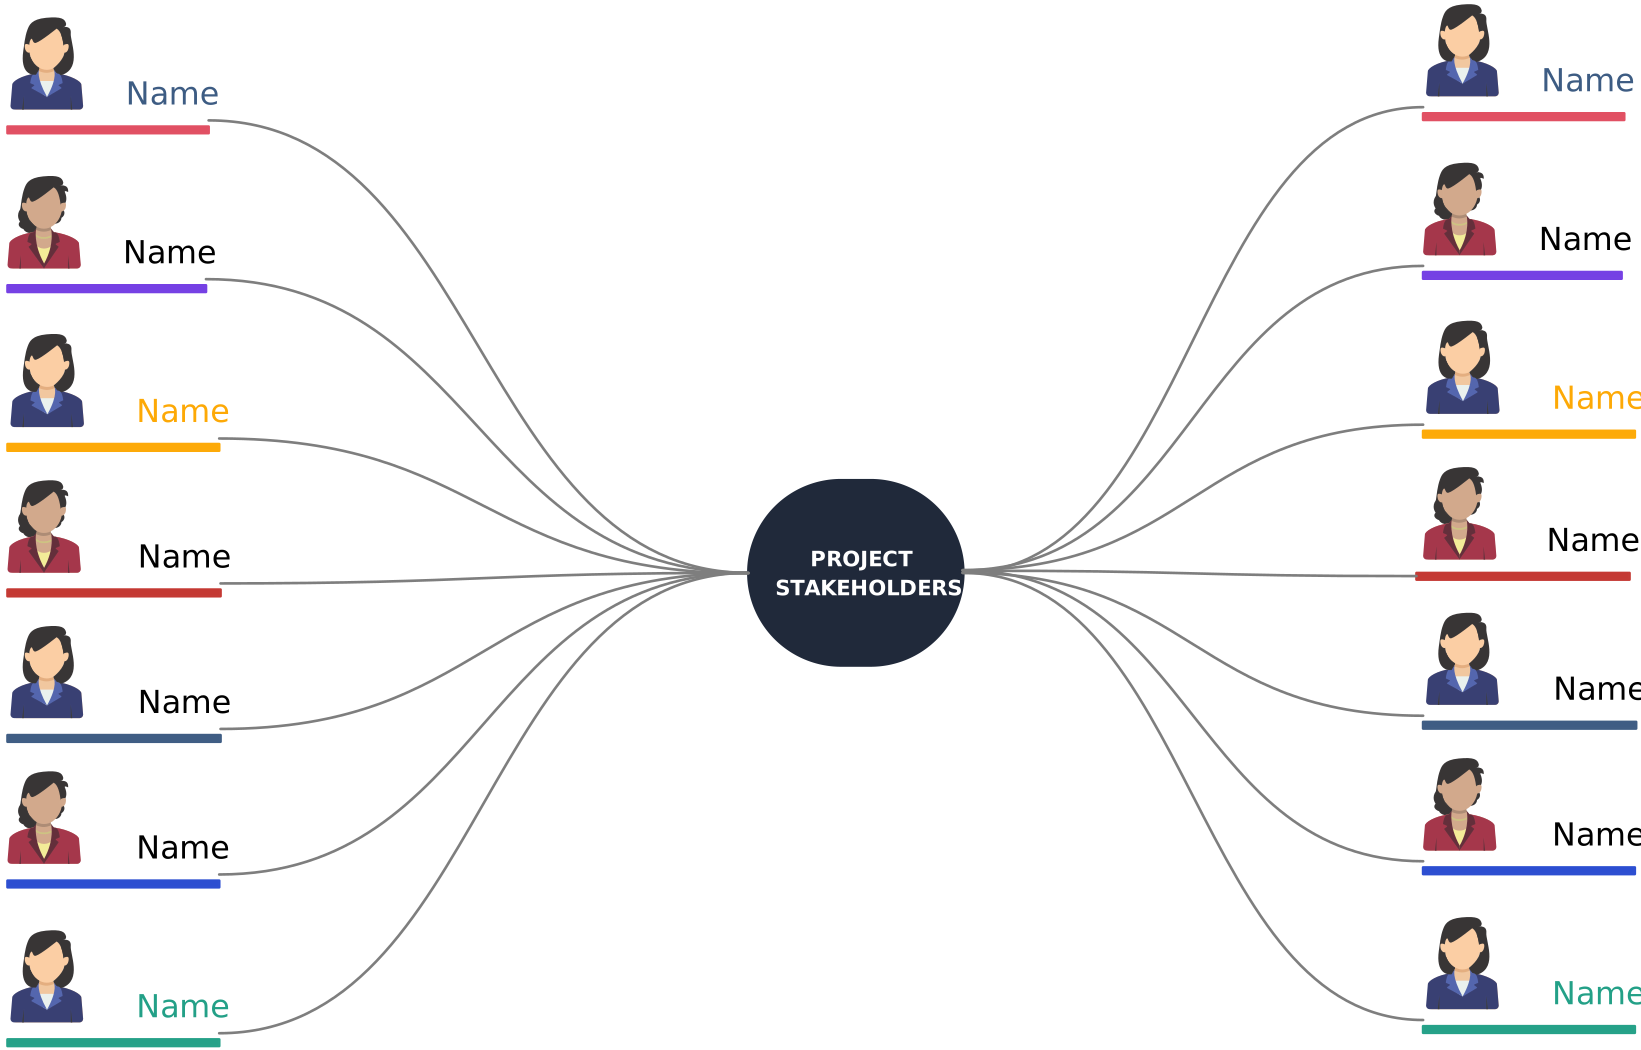
Systems mapping is an effective tool in ecosystem management because it helps visualize the interactions between natural systems and human activity. It provides a structured way to identify relationships, feedback loops, and potential intervention points that affect ecological balance.
Importance of Systems Mapping in Ecosystem Management
- Visualizing Complex Interactions: Ecosystems include many interconnected elements, from species and water cycles to land use and human influence. Systems mapping makes those interactions easier to understand.
- Identifying Leverage Points: Mapping factors such as deforestation, pollution, or climate change helps planners identify where a strategic intervention could create meaningful improvement.
- Understanding Feedback Loops: Many ecological systems reinforce or balance themselves over time. Systems mapping helps teams visualize those loops so responses are better informed.
Applications of Systems Mapping in Ecosystem Management
- Biodiversity Conservation: Mapping species, habitats, and pressures can help prioritize conservation work.
- Water Resource Management: Systems mapping can show how water moves, where it is used, and how land-use changes affect availability and quality.
- Climate Change Adaptation: It helps visualize how temperature shifts, precipitation changes, and extreme weather affect resources, migration, and resilience.
- Sustainable Land Use: It helps decision-makers understand how agriculture, urbanization, and forestry affect ecosystems so tradeoffs are easier to evaluate.
Techniques in Systems Mapping for Ecosystem Management
- Causal Loop Diagrams (CLDs): These show how variables influence one another over time. For example, they can show how deforestation affects water quality, erosion, or habitat loss.

- Stock and Flow Diagrams: These track resources such as water, energy, or nutrients and the flows that increase or reduce them over time.
- Spatial Mapping Tools: GIS and related tools can be combined with systems mapping to show how location-based factors such as land use, density, or pollution affect ecological health.
Popular Tools for Systems Mapping
- Creately: Creately is a visual collaboration platform for creating system maps, diagrams, and workflows with real-time collaboration.
- Kumu: Kumu is specialized for mapping complex relationships and networks in social, organizational, and ecosystem contexts.
- InsightMaker: InsightMaker is a free web-based tool for building and simulating system dynamics models.
- Vensim: Vensim is simulation software used to develop and analyze dynamic system models.
- Miro: Miro is a collaborative online whiteboard that supports visual thinking, mapping, and group facilitation.
- Loopy: Loopy is a lightweight web-based tool for creating interactive feedback loops and quick systems models.
Each tool is suited to different needs, from simple visual mapping to detailed simulation and cross-functional collaboration.
Common Methods of Systems Mapping
Systems mapping methods help teams analyze complexity from different angles. Common methods include:
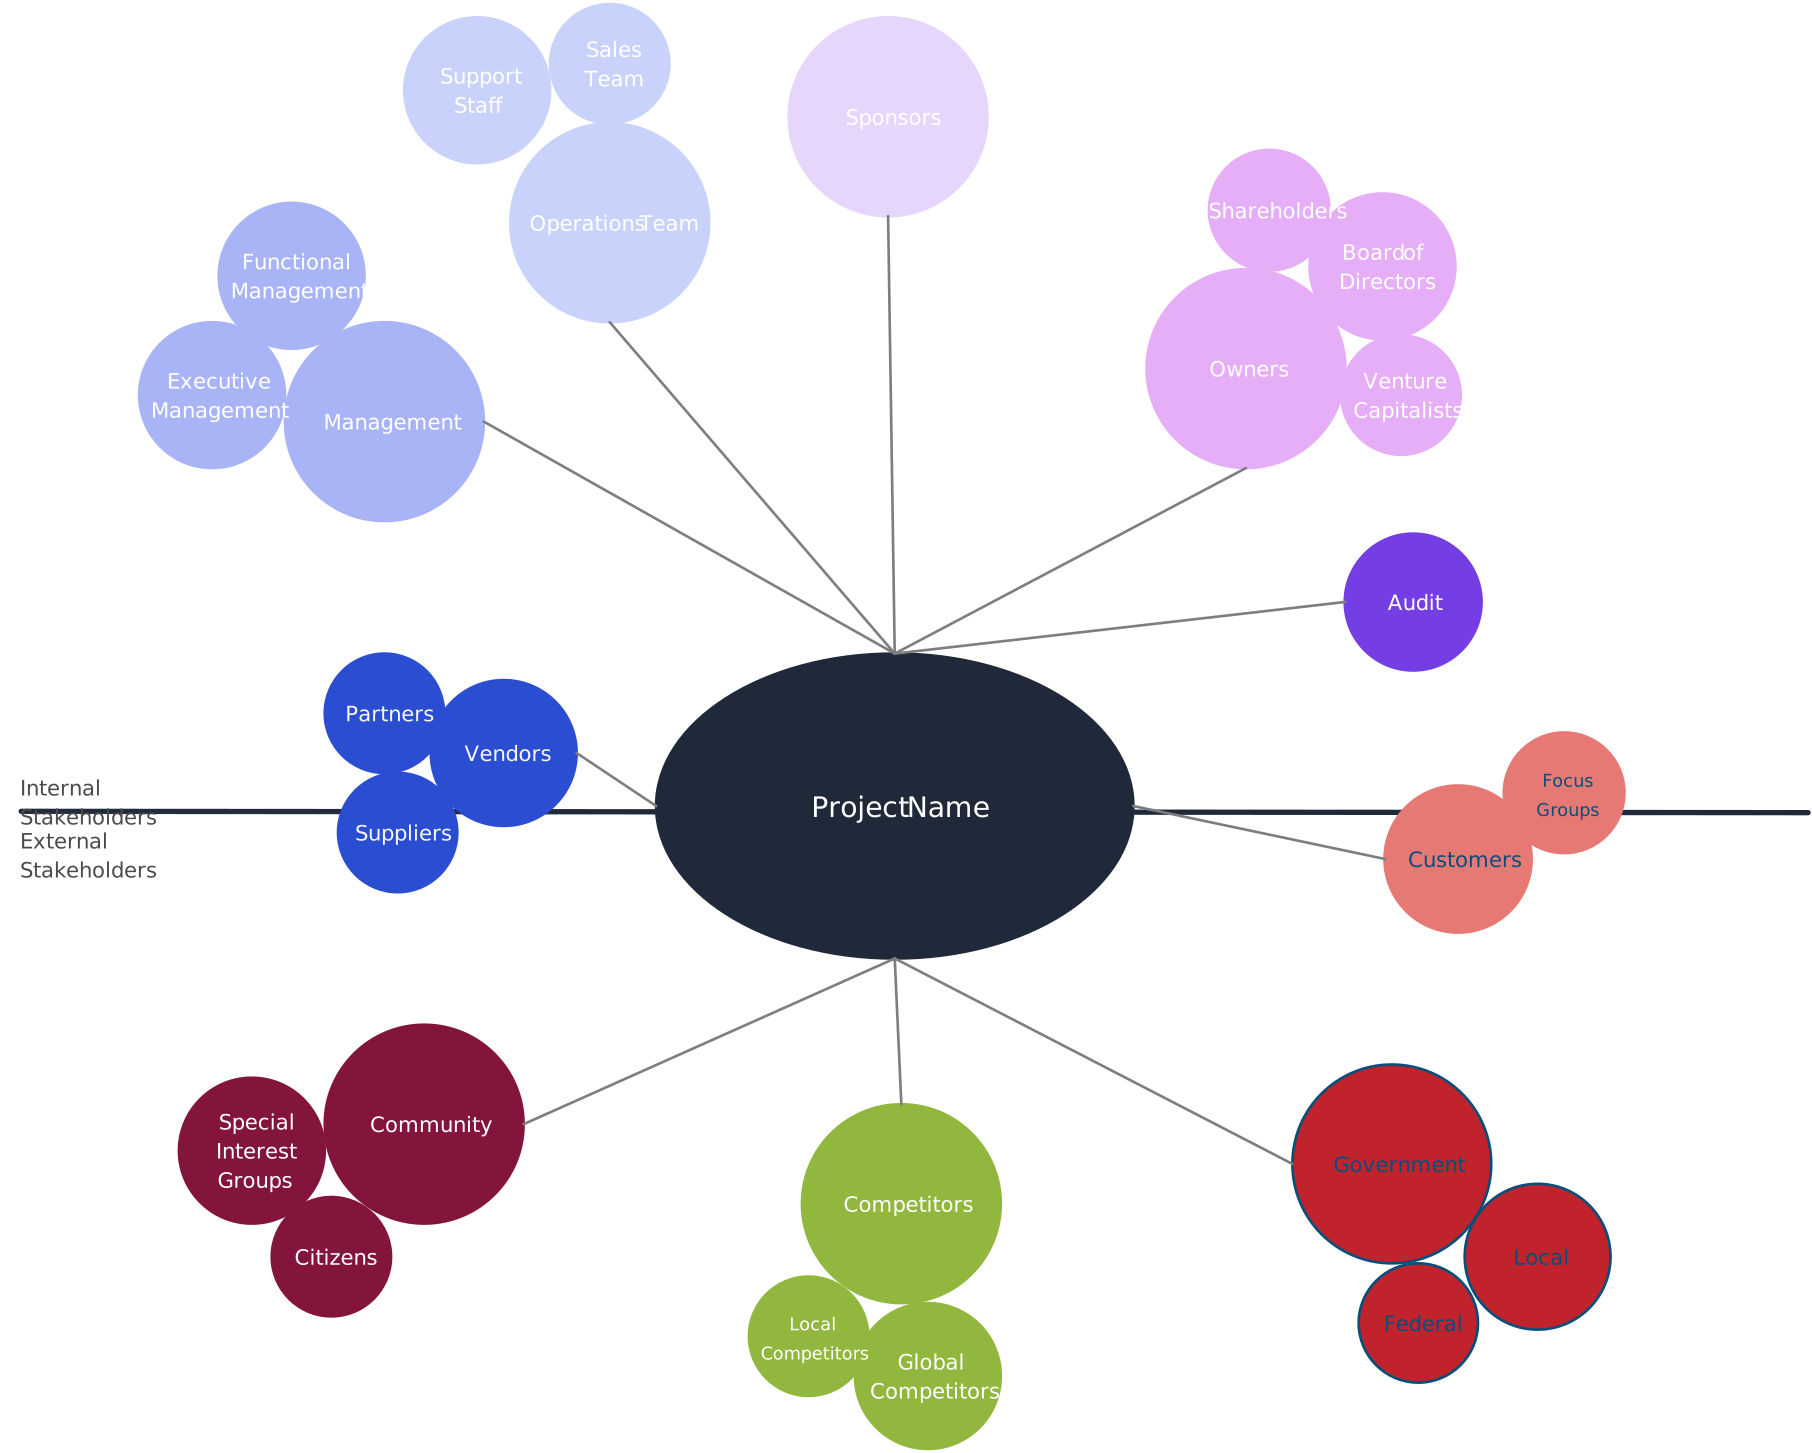
- Actor Mapping: Focuses on stakeholders and their relationships. It helps clarify who is involved, who has influence, and how different actors affect one another.
- Appreciative Inquiry: Highlights what is already working well in a system and builds on those strengths instead of focusing only on problems.
- Causal Loop Diagrams (CLD): Show reinforcing and balancing loops so teams can understand how variables affect one another over time.

- Issue Mapping: Visually organizes key issues, their causes, and their effects. It is useful in strategic planning and policy work.
- Social Network Analysis (SNA): Maps relationships between people, teams, or organizations to reveal clusters, central actors, and influence pathways.
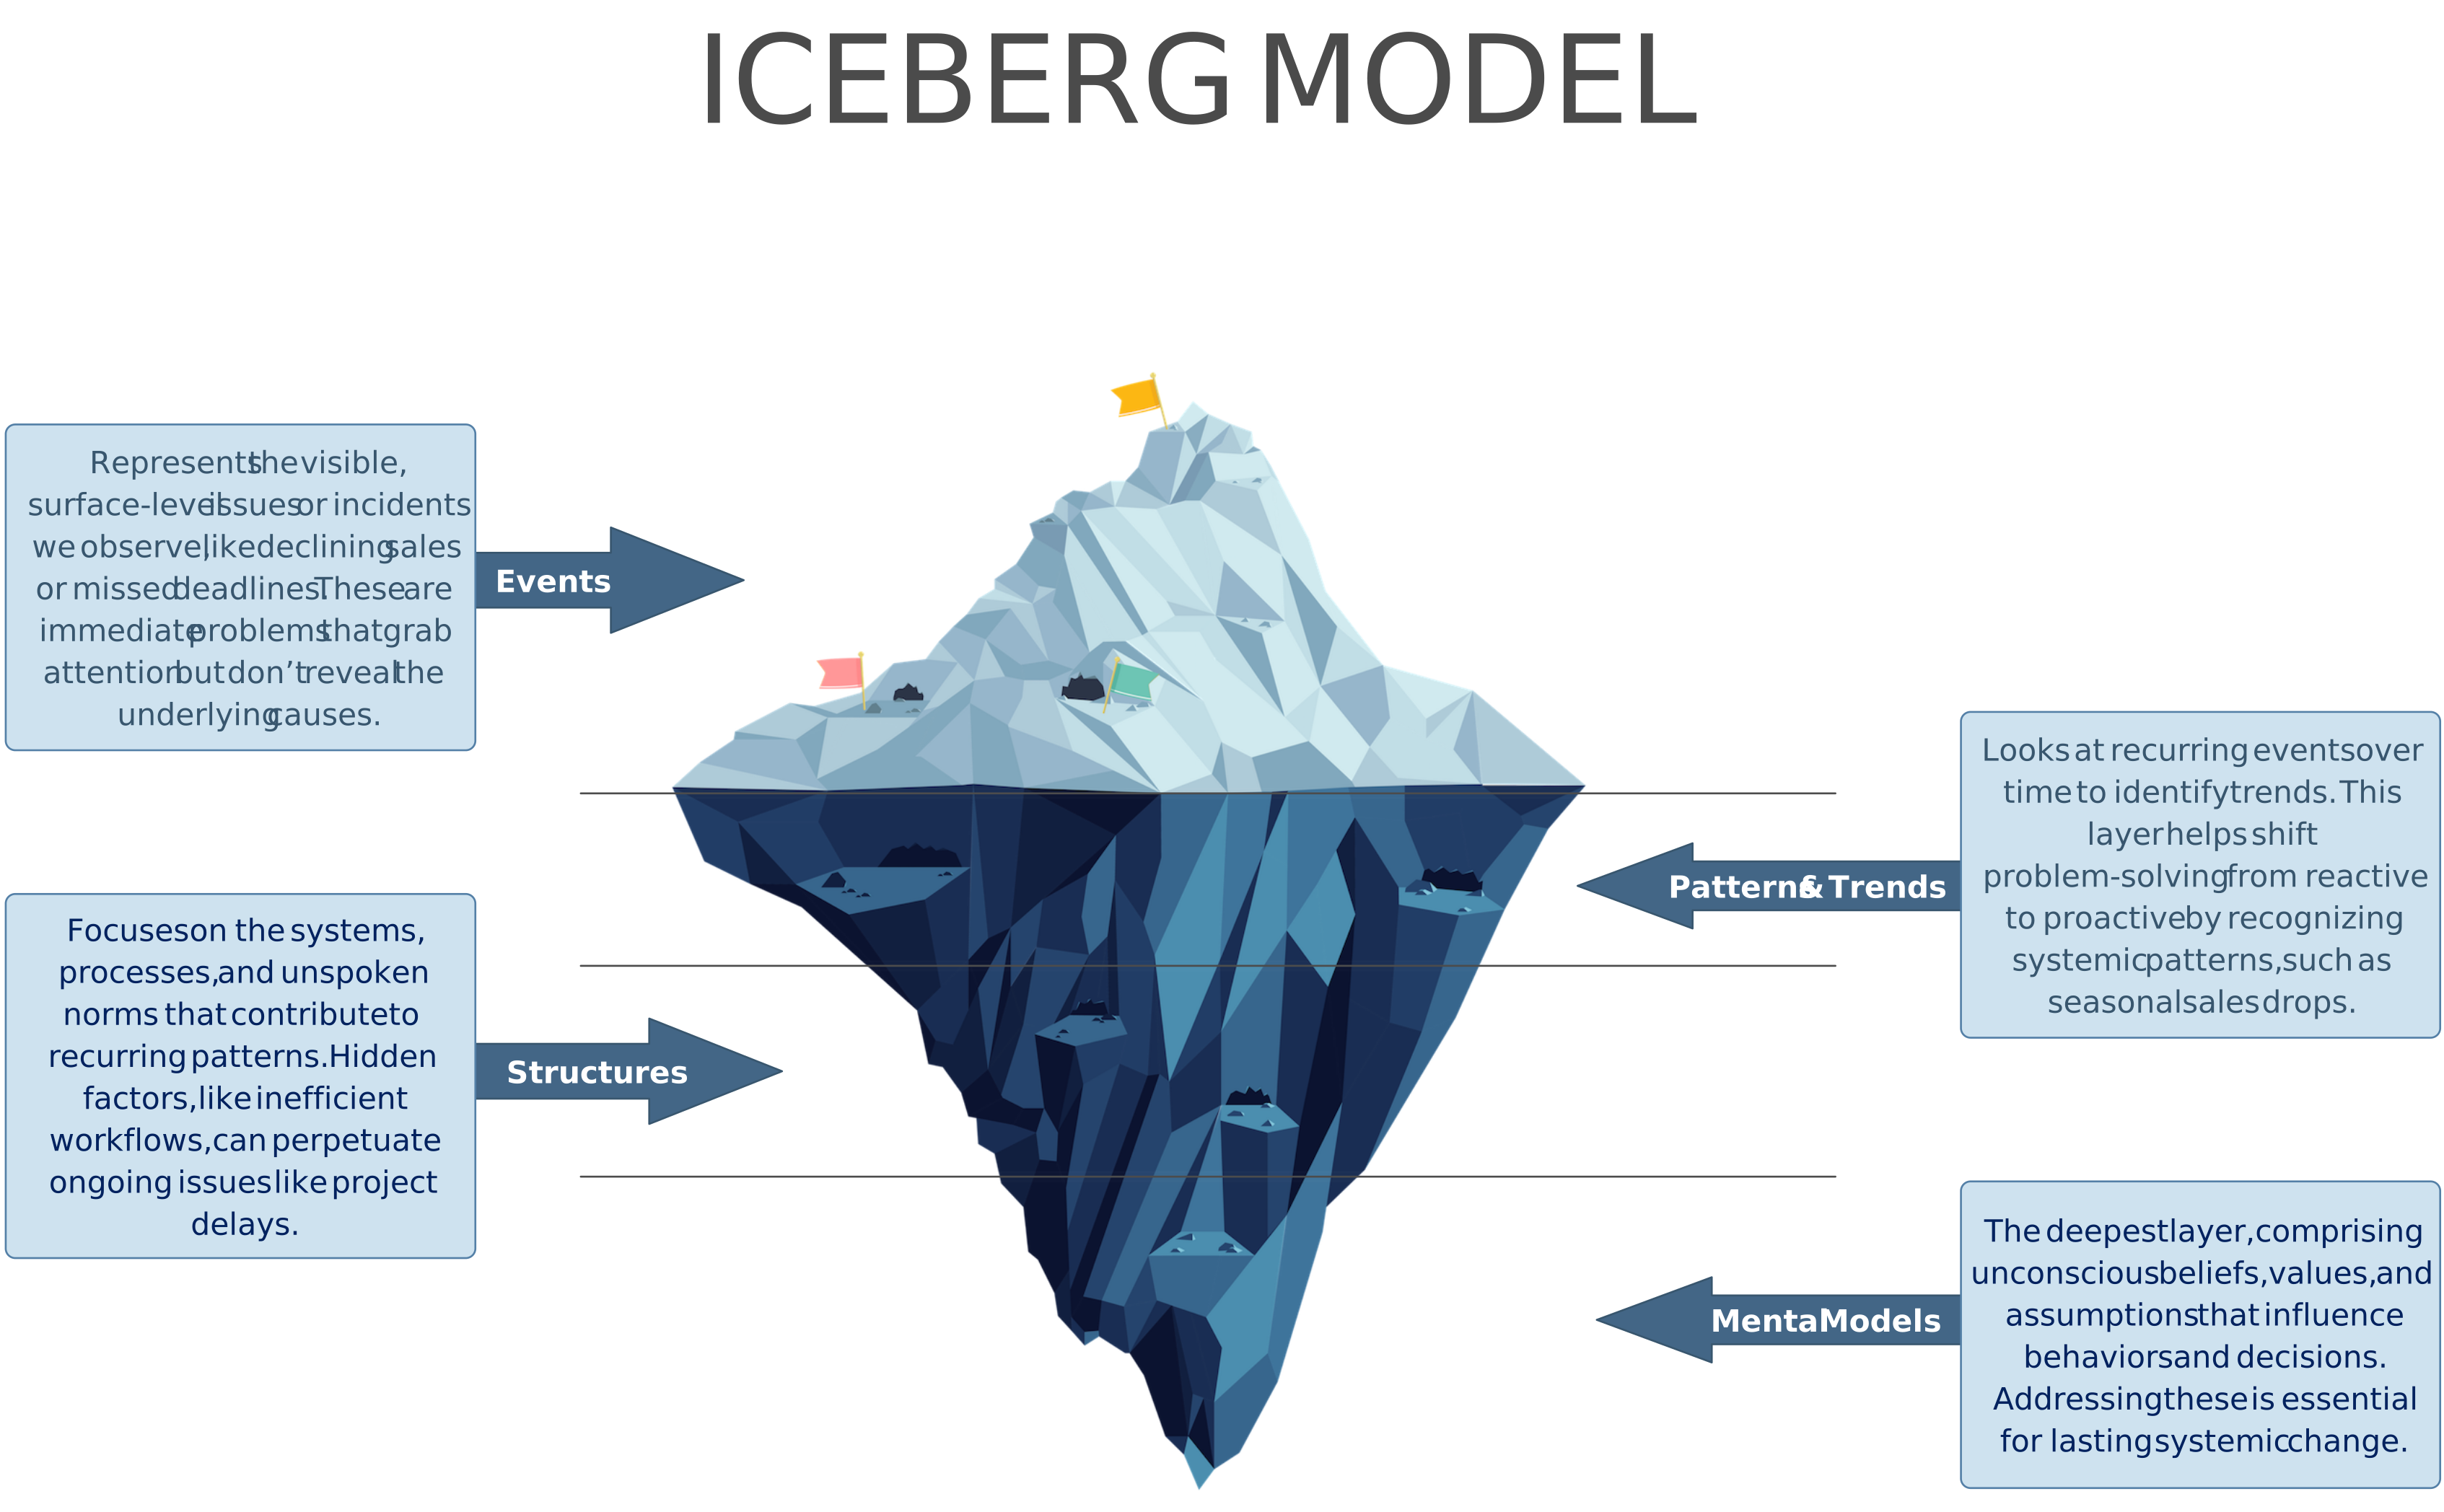
- Iceberg Model: The Iceberg Model helps teams look beneath visible events to uncover patterns, structures, and mental models.
- Behavior Over Time Graphs (BOTs): Show how variables change over time, which helps teams see trends and shifting conditions.
- Connected Circles: Highlights how variables are connected, often surfacing hidden relationships that deserve deeper analysis.
Using multiple methods together can give teams a richer understanding of the system and make it easier to move from insight to action.
How to Implement Systems Mapping
Creating a systems map involves several steps that help visualize and understand complex relationships and dynamics within a system.
1. Define the System’s Purpose and Scope
- Purpose: Clearly define why you are creating the map. Are you trying to improve a process, align stakeholders, analyze risk, or understand an ecosystem?
- Scope: Set the boundaries of the system. Decide what to include, such as actors, resources, or feedback loops, and what to leave out for now.
2. Identify Key Elements
- Actors and Components: List the major components of the system, which may include stakeholders, resources, and processes.
- Variables: Identify the variables that influence system behavior, such as demand, pollution, staffing, access, or resource consumption.
3. Map Relationships and Connections
- Link Components: Show how components affect one another. For example, a policy change may affect service delivery, which then affects outcomes.
- Types of Relationships: Note whether connections are direct or indirect, and whether they are reinforcing or balancing.
4. Identify Feedback Loops
- Reinforcing Loops: Look for relationships where one change amplifies another.
- Balancing Loops: Identify relationships that help regulate the system and counter change.
5. Visualize the System
- Use a tool like Creately, Kumu, Vensim, or Miro to build the map.
- Keep the map readable with labeled components and arrows that show direction and type of influence where relevant.
6. Test and Refine the Map
- Share the map with stakeholders or teammates for feedback.
- Update it by adding missing elements, adjusting assumptions, or refining the level of detail.
7. Analyze the System
- Identify Leverage Points: Look for places where a small change could create an outsized effect.
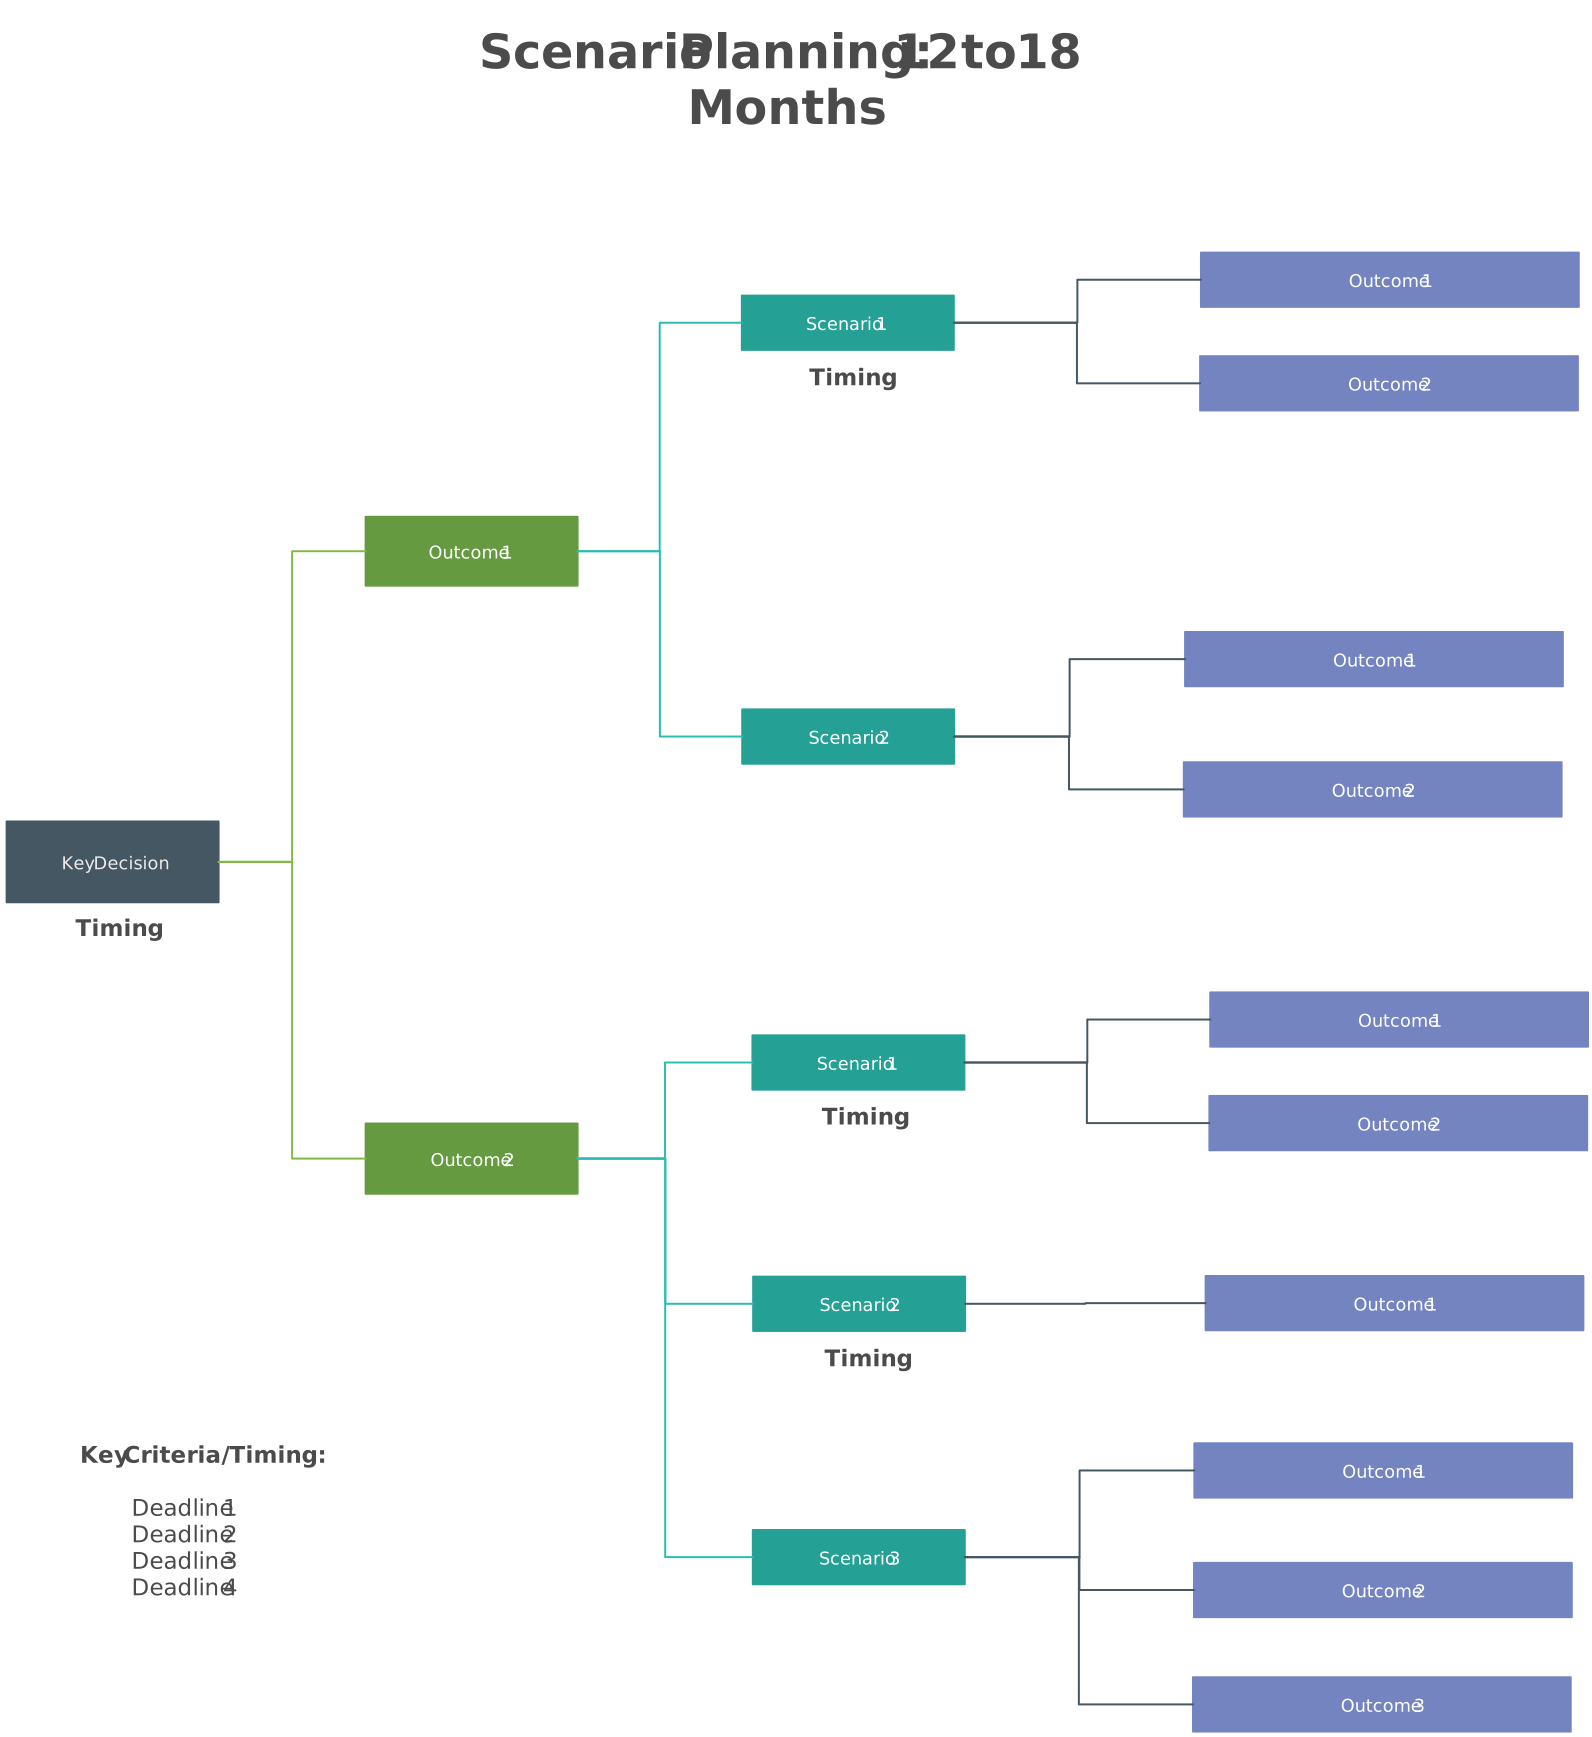
- Scenario Analysis: Explore how changes in one area may affect the system as a whole.
By following these steps, you can build a systems map that makes complexity easier to understand and more actionable.
Benefits of Systems Mapping
Systems mapping helps organizations and teams move beyond isolated issues and understand how the system behaves as a whole. That can lead to better decisions, clearer collaboration, and more durable improvements.
- Enhanced Understanding: Provides a visual view of interdependencies and complexity.
- Improved Problem Identification: Helps pinpoint root causes, bottlenecks, and pressure points.
- Informed Decision-Making: Supports better planning with clearer context and scenario thinking.
- Increased Collaboration: Builds shared understanding across departments, teams, or stakeholder groups.
- Streamlined Processes: Helps reveal opportunities to remove waste and improve flow.
- Facilitated Change Management: Makes proposed changes easier to explain and discuss.
- Continuous Improvement Culture: Encourages regular review and iterative refinement.
- Alignment with Strategic Goals: Helps ensure daily processes connect to broader objectives.
Common Challenges of Systems Mapping and How to Overcome Them
Like any strategic method, systems mapping comes with challenges. These are some of the most common ones and how to address them:
- Lack of Clarity in Objectives: Define specific goals before starting and align stakeholders early.
- Complexity of the System: Begin with a high-level map and add detail gradually.
- Resistance to Change: Involve affected teams and explain how the map will help decision-making.
- Insufficient Data: Combine qualitative input with available quantitative data and update the map as you learn more.
- Diverse Perspectives and Language: Establish shared definitions so participants interpret the map consistently.
- Overemphasis on Technical Details: Keep the work tied to the outcome you are trying to improve.
- Time Constraints: Break the work into phases and use collaborative workshops efficiently.
- Integration with Existing Processes: Create a follow-up action plan so insights lead to real decisions.
- Lack of Continuous Review: Revisit the system map regularly as the system changes.
- Limited Awareness of Tools and Techniques: Provide examples, templates, and simple starting methods before moving into advanced modeling.
Creately and Systems Mapping
Creately is a visual collaboration platform that supports systems mapping with features built for shared diagramming and structured analysis.
- Visual Collaboration: Teams can work together in real time on the same system map.
- Diverse Diagram Types: Users can create causal loop diagrams, stakeholder maps, flowcharts, and more.
- Drag-and-Drop Editing: Diagram creation and updates are easier and faster.
- Integration Capabilities: Creately integrates with common workplace tools to support connected workflows.
- Real-Time Data Integration: Maps can be updated with current information when needed.
- Export and Share Options: Teams can share maps as PDFs, images, and other formats.
- Customizable Templates: Templates help users get started quickly while adapting the output to their context.
Conclusion
Systems mapping is a practical way to understand complexity, align stakeholders, and make better decisions in situations where many parts influence the same outcome.
Organizations that use systems mapping can improve efficiency, strengthen collaboration, and uncover leverage points that are difficult to see in linear plans or reports. Whether the context is business operations, sustainability, service design, or ecosystem management, a good system map helps teams move from confusion to clearer action.