UML diagrams are visual tools that help software developers and designers understand and communicate how a system works. They provide a clear picture of both the structure of a system and how it behaves, making complex ideas easier to grasp. In this guide, we’ll explore the two main types of UML diagrams—structural and behavioral—compare their purposes, and show how they complement each other to give a complete view of any software system.
What Are Structural Diagrams in UML
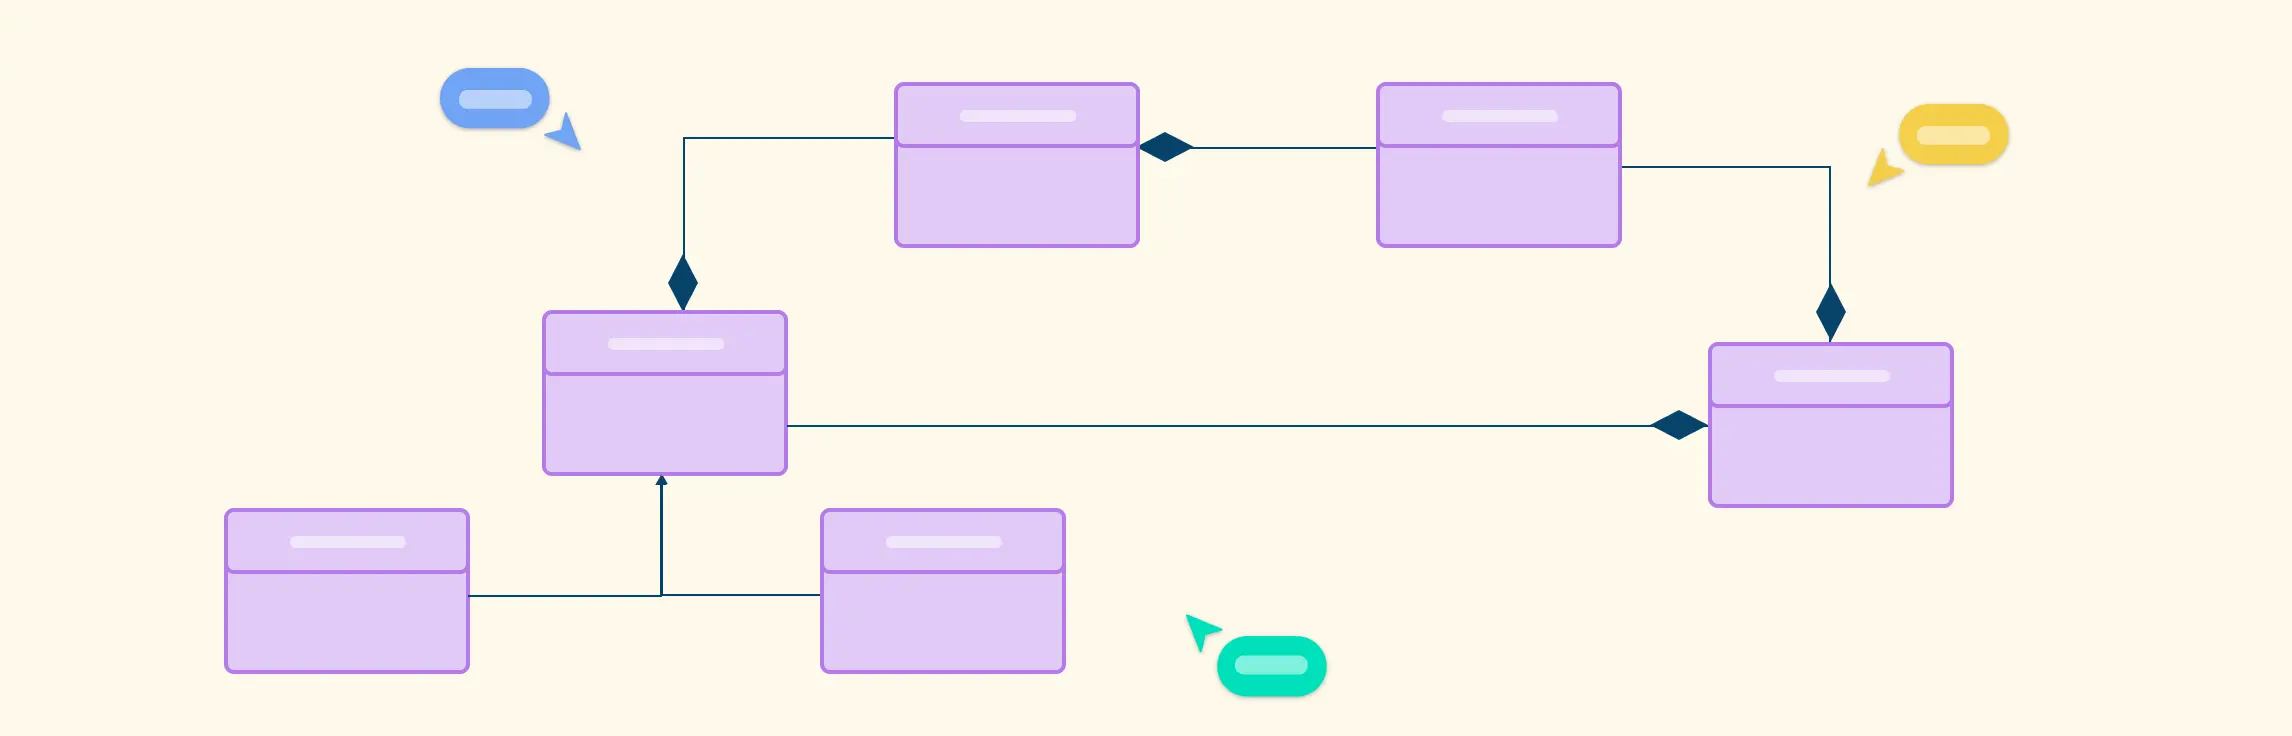
Structural diagrams in UML are visual representations that show the static aspects of a system—also known as static modeling. They capture the stable parts of a system, such as classes, objects, components, and their relationships, without focusing on how they change or behave over time. Think of them as the blueprint or skeleton of your software: they reveal the system’s architecture and organization, helping teams plan, design, and communicate its structure effectively.
When to use structural diagrams
When designing or documenting the architecture of a system.
To visualize relationships between different components.
To communicate system structure to developers, architects, and stakeholders.
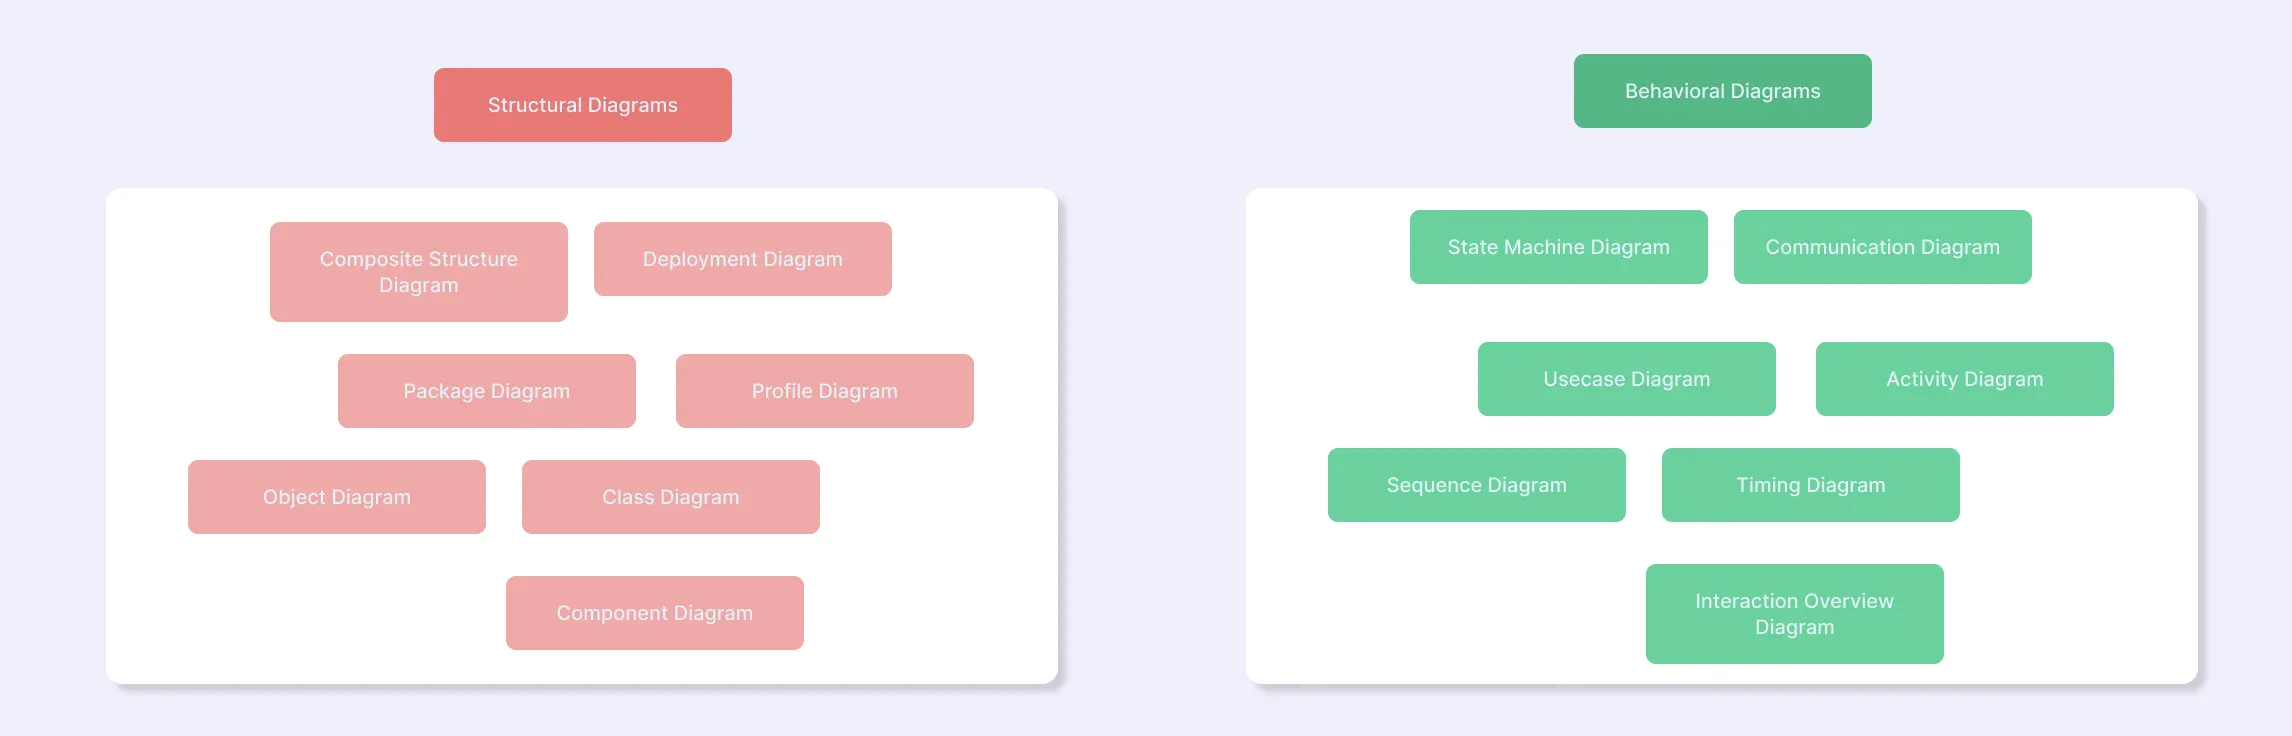
Types of structural diagrams
| Diagram Type | Definition | When to Use |
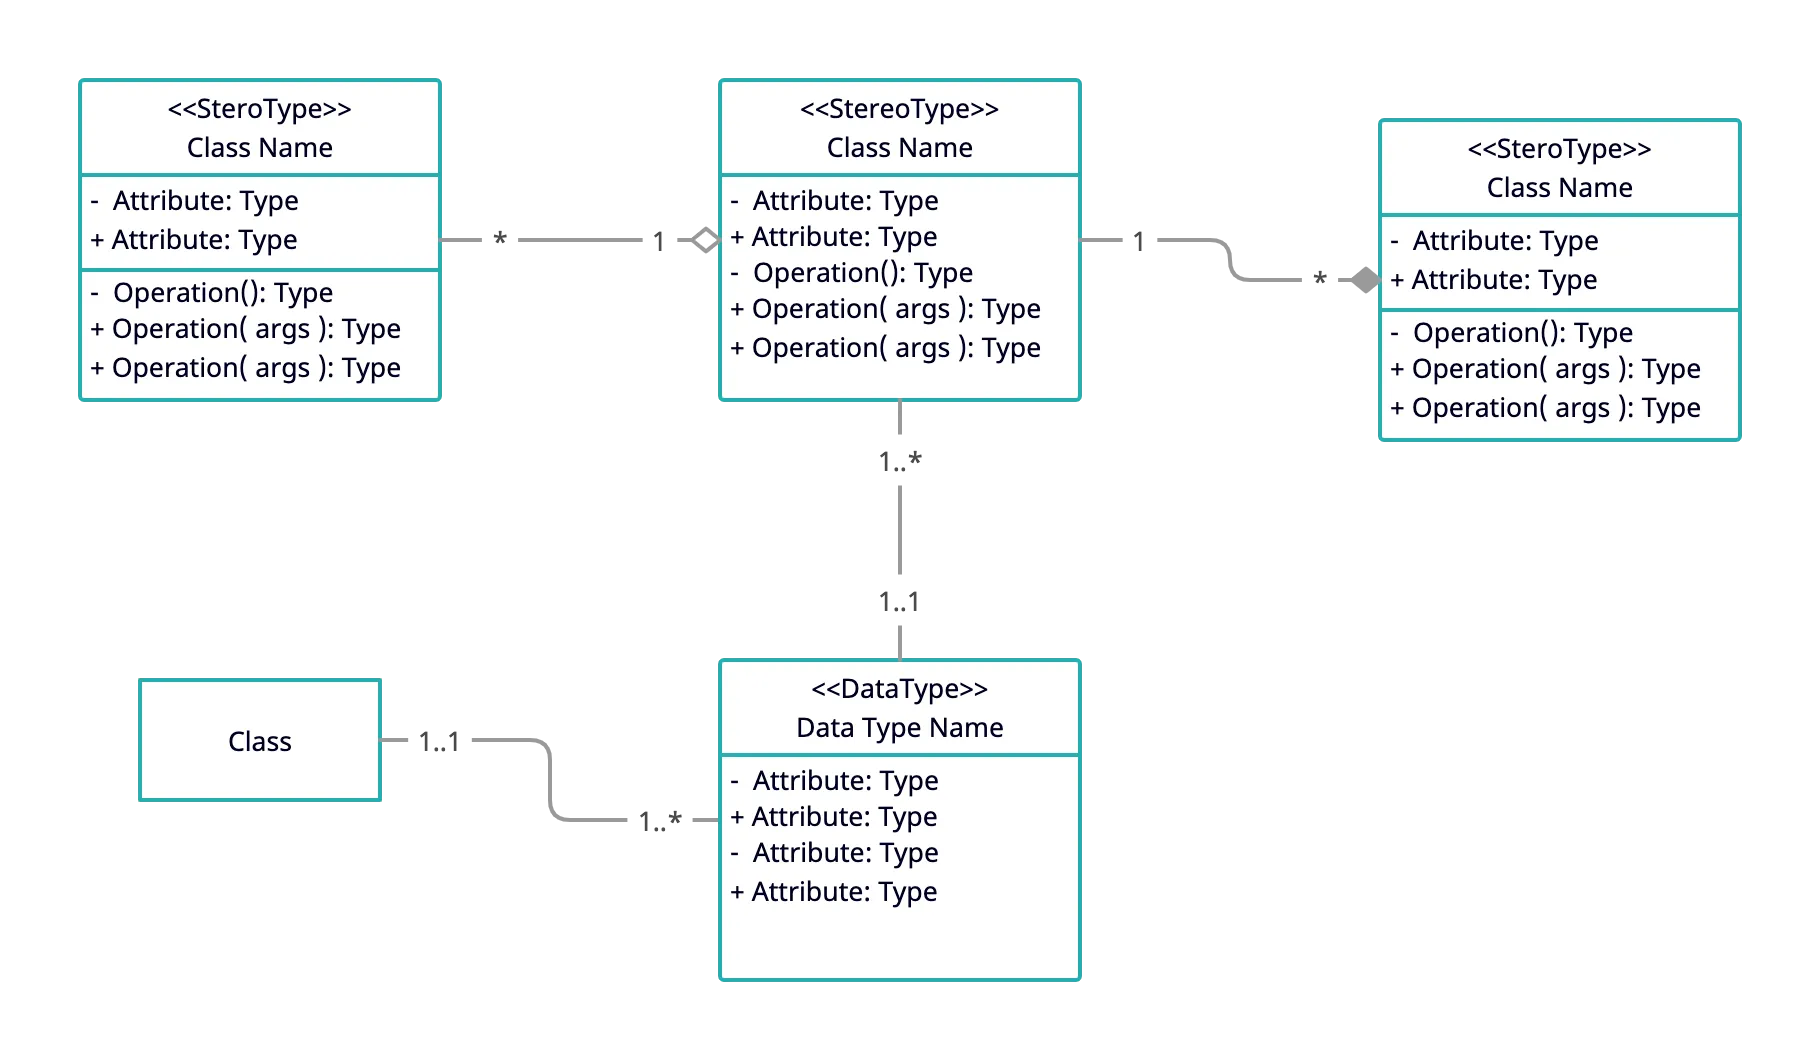
| Class Diagram | Shows classes, their attributes and methods, and the relationships between them. | Use when designing object-oriented systems to model the system’s data and class structure. |
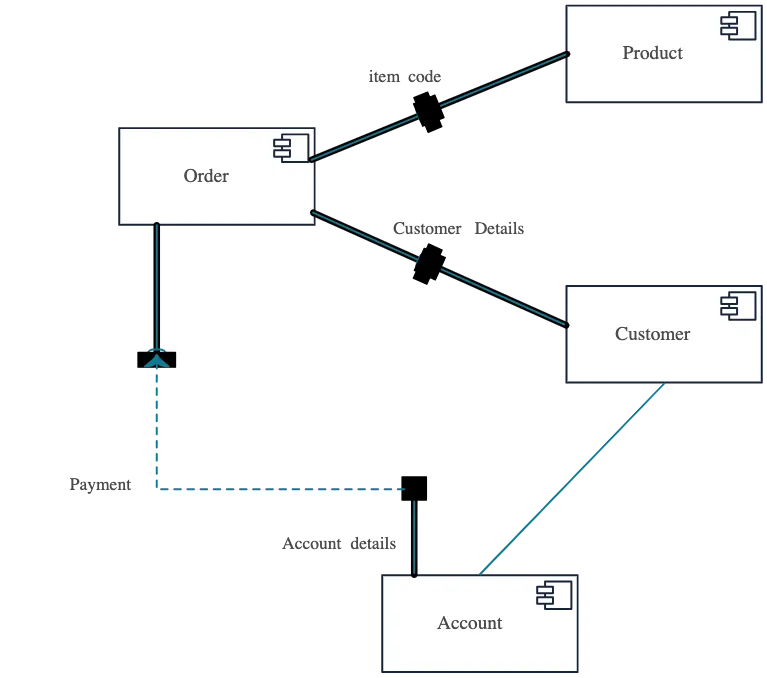
| Component Diagram | Depicts software components and their dependencies. | Use to illustrate modular design and how different components interact in a system. |
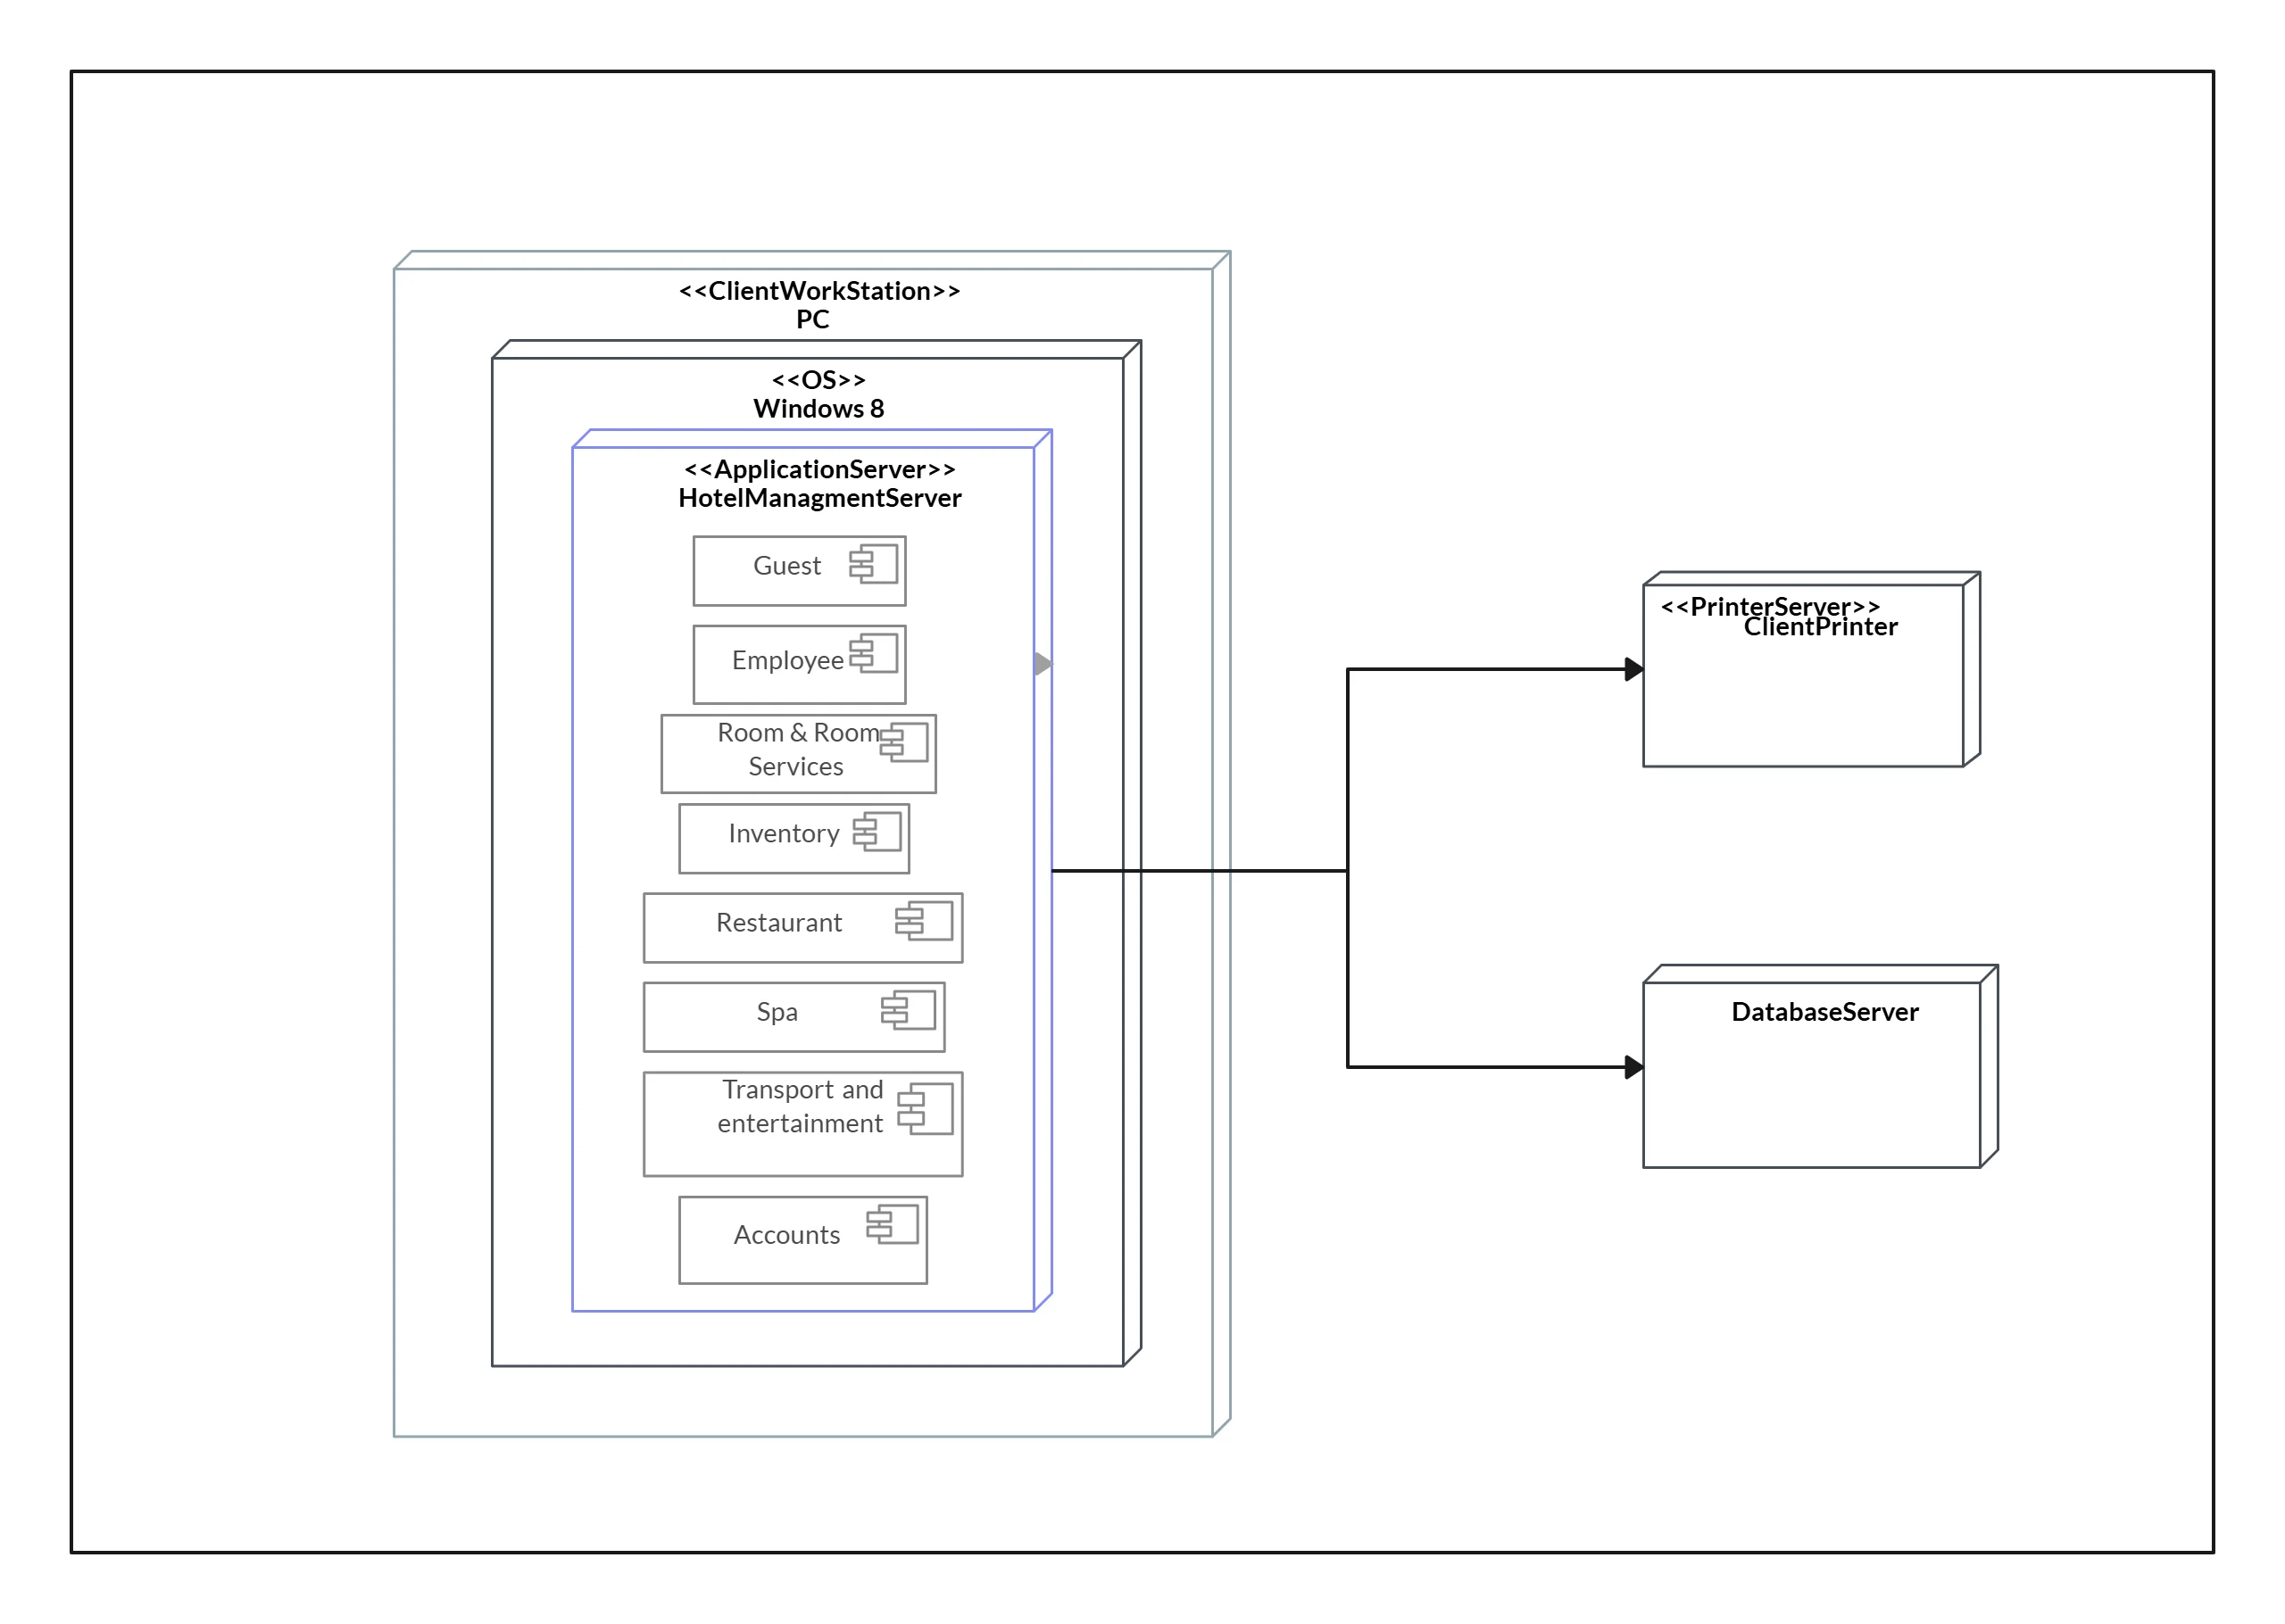
| Deployment Diagram | Represents the hardware nodes and the software deployed on them. | Use for system deployment planning and to show physical architecture. |
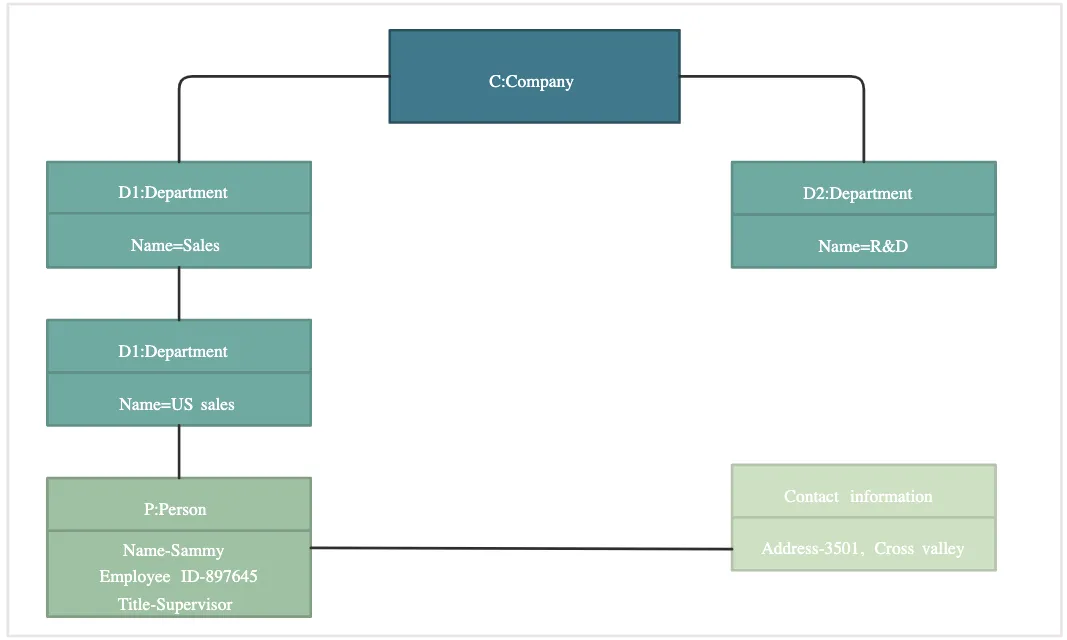
| Object Diagram | Displays instances of classes and their relationships at a specific moment in time. | Use to visualize examples of objects during runtime and their connections. |
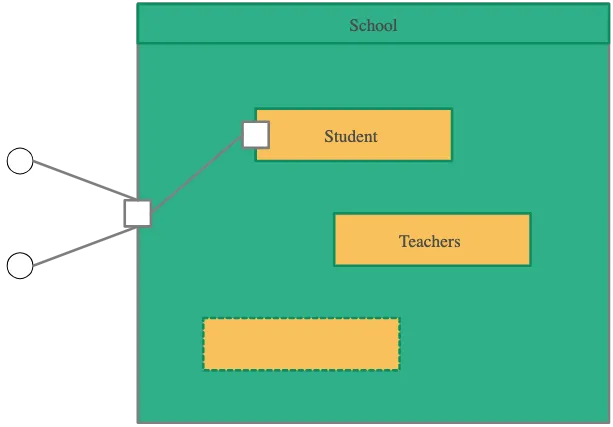
| Composite Structure Diagram | Shows the internal structure of a class and the interactions between its parts. | Use when you need to understand or document complex class internals. |
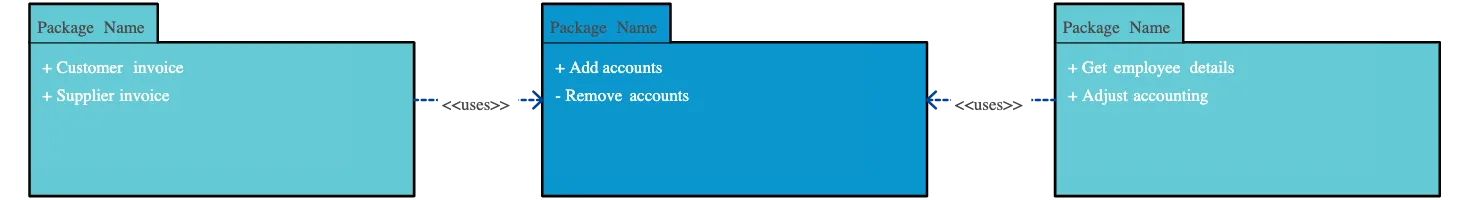
| Package Diagram | Organizes classes into packages and shows their dependencies. | Use to manage and structure large systems into smaller, logical sections. |
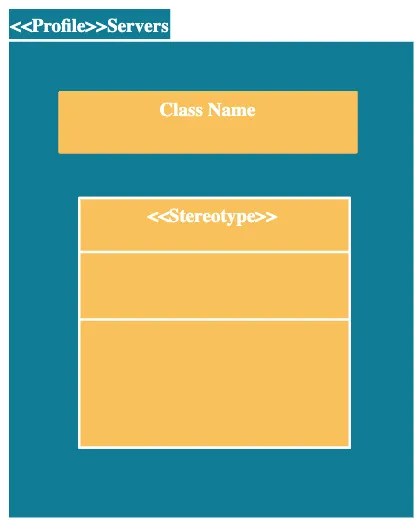
| Profile Diagram | Allows customization of UML for a specific domain or purpose. | Use when creating domain-specific extensions or adapting UML to a project’s needs. |
What Are Behavioral Diagrams in UML
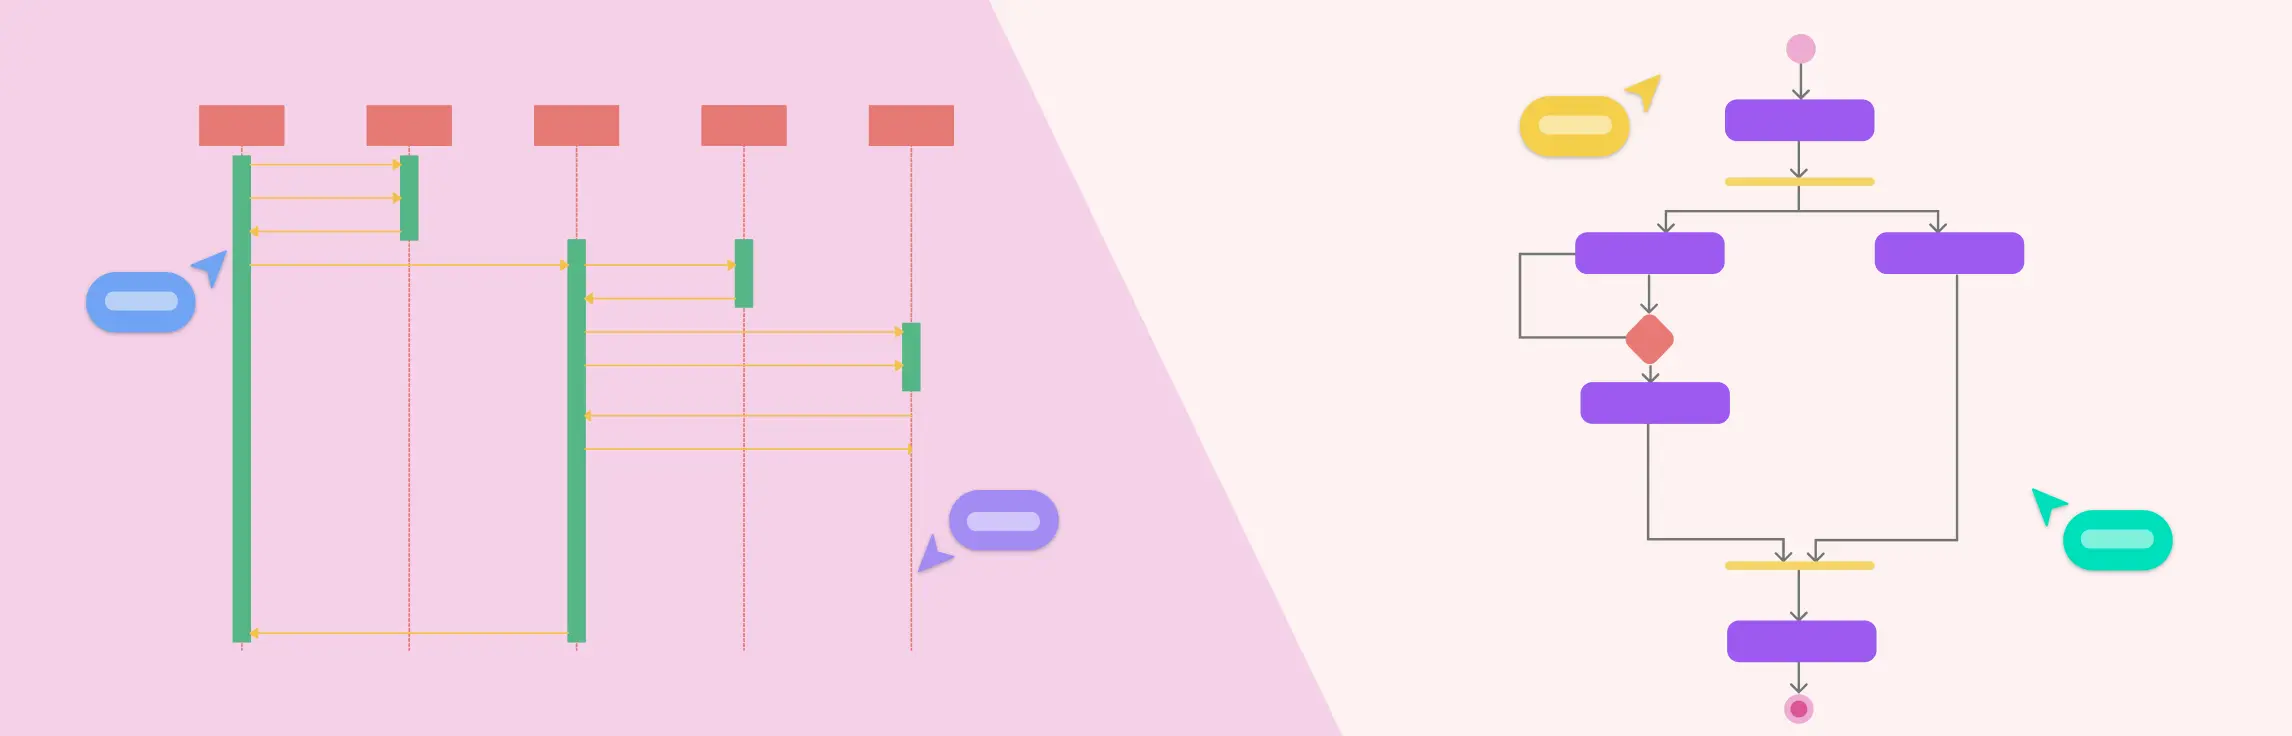
UML Behavioral diagrams represent the dynamic aspects of a system—often referred to as dynamic modeling. They focus on how the system behaves and interacts over time, showing workflows, processes, and responses to events. While structural diagrams define what the system is, behavioral diagrams bring it to life, illustrating how components collaborate to perform tasks and respond to changes.
When to use behavioral diagrams
To understand and communicate system behavior.
To model interactions between users, objects, and components.
To analyze workflows, sequences, and states during system execution.
To identify potential issues in processes or interactions before implementation.
Types of behavioral diagrams
| Diagram Type | Definition | When to Use |
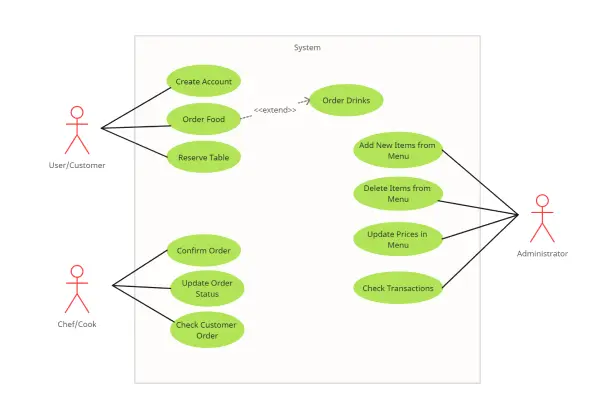
| Use Case Diagram | Shows the system’s functionalities from the user’s perspective, including actors and their interactions with the system. | Use to capture high-level requirements and understand what the system should do. |
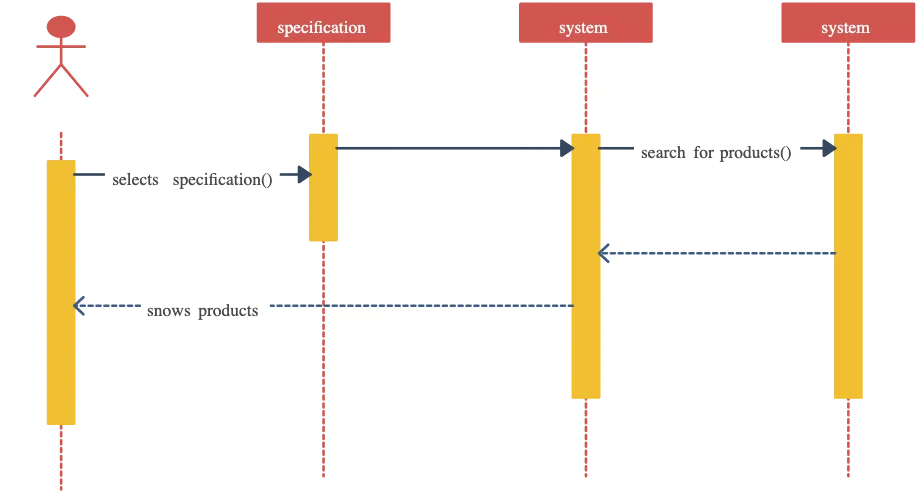
| Sequence Diagram | Illustrates how objects interact over time through ordered sequences of messages. | Use to model specific workflows, processes, or feature interactions. |
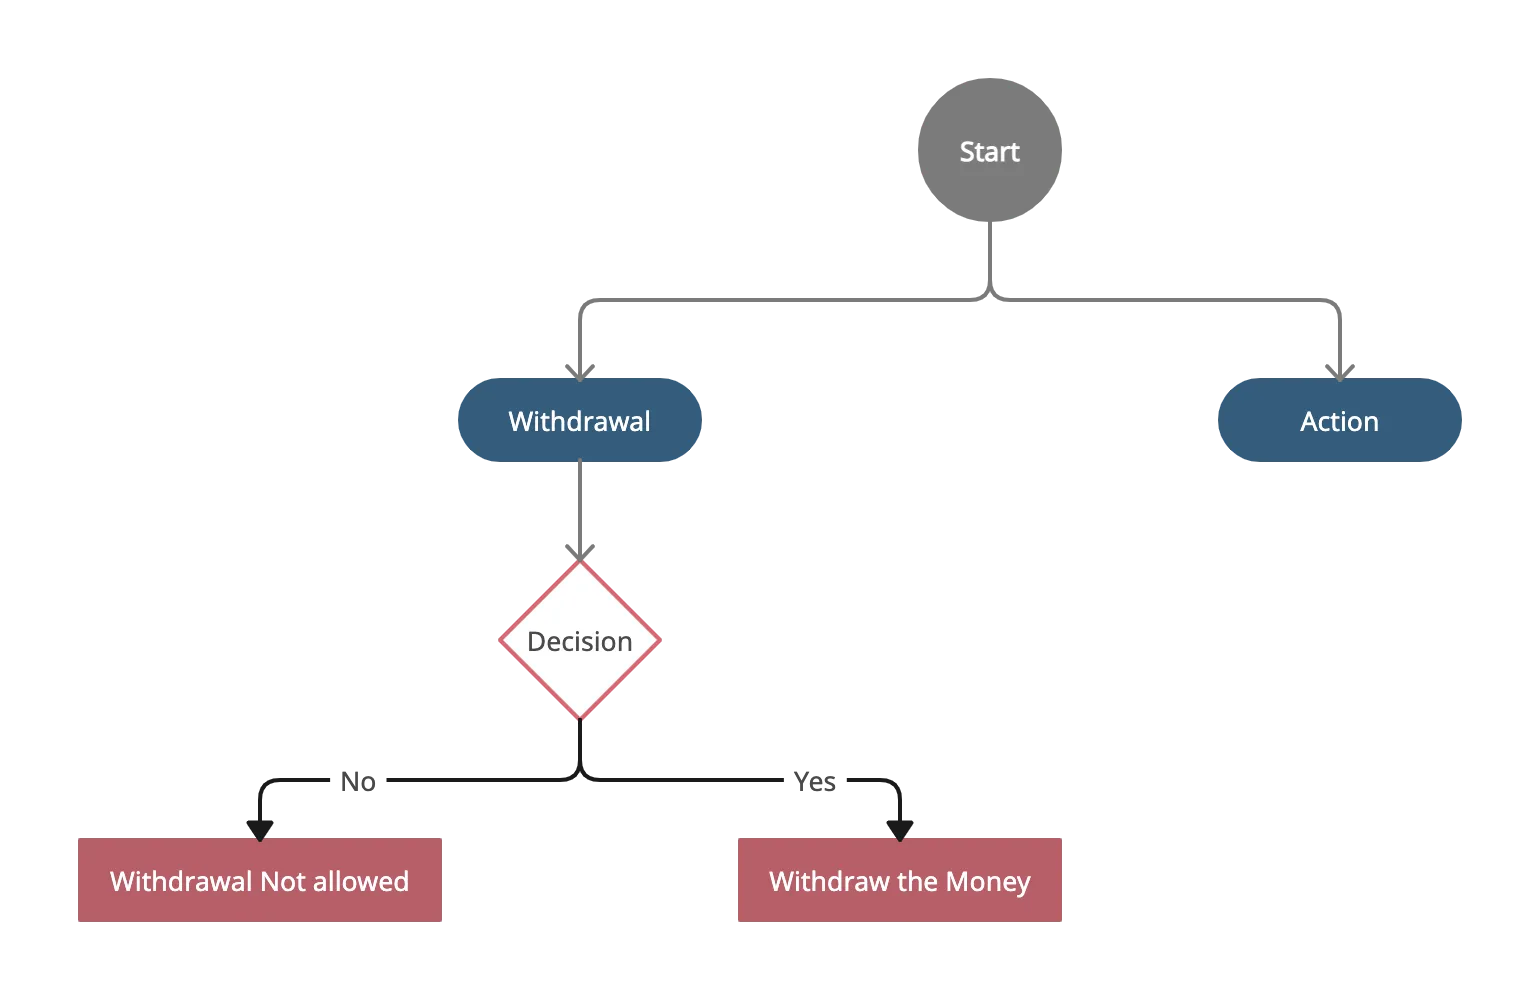
| Activity Diagram | Depicts the flow of activities, decision points, and parallel processes in a system or workflow. | Use to visualize workflows, business processes, or algorithm logic. |
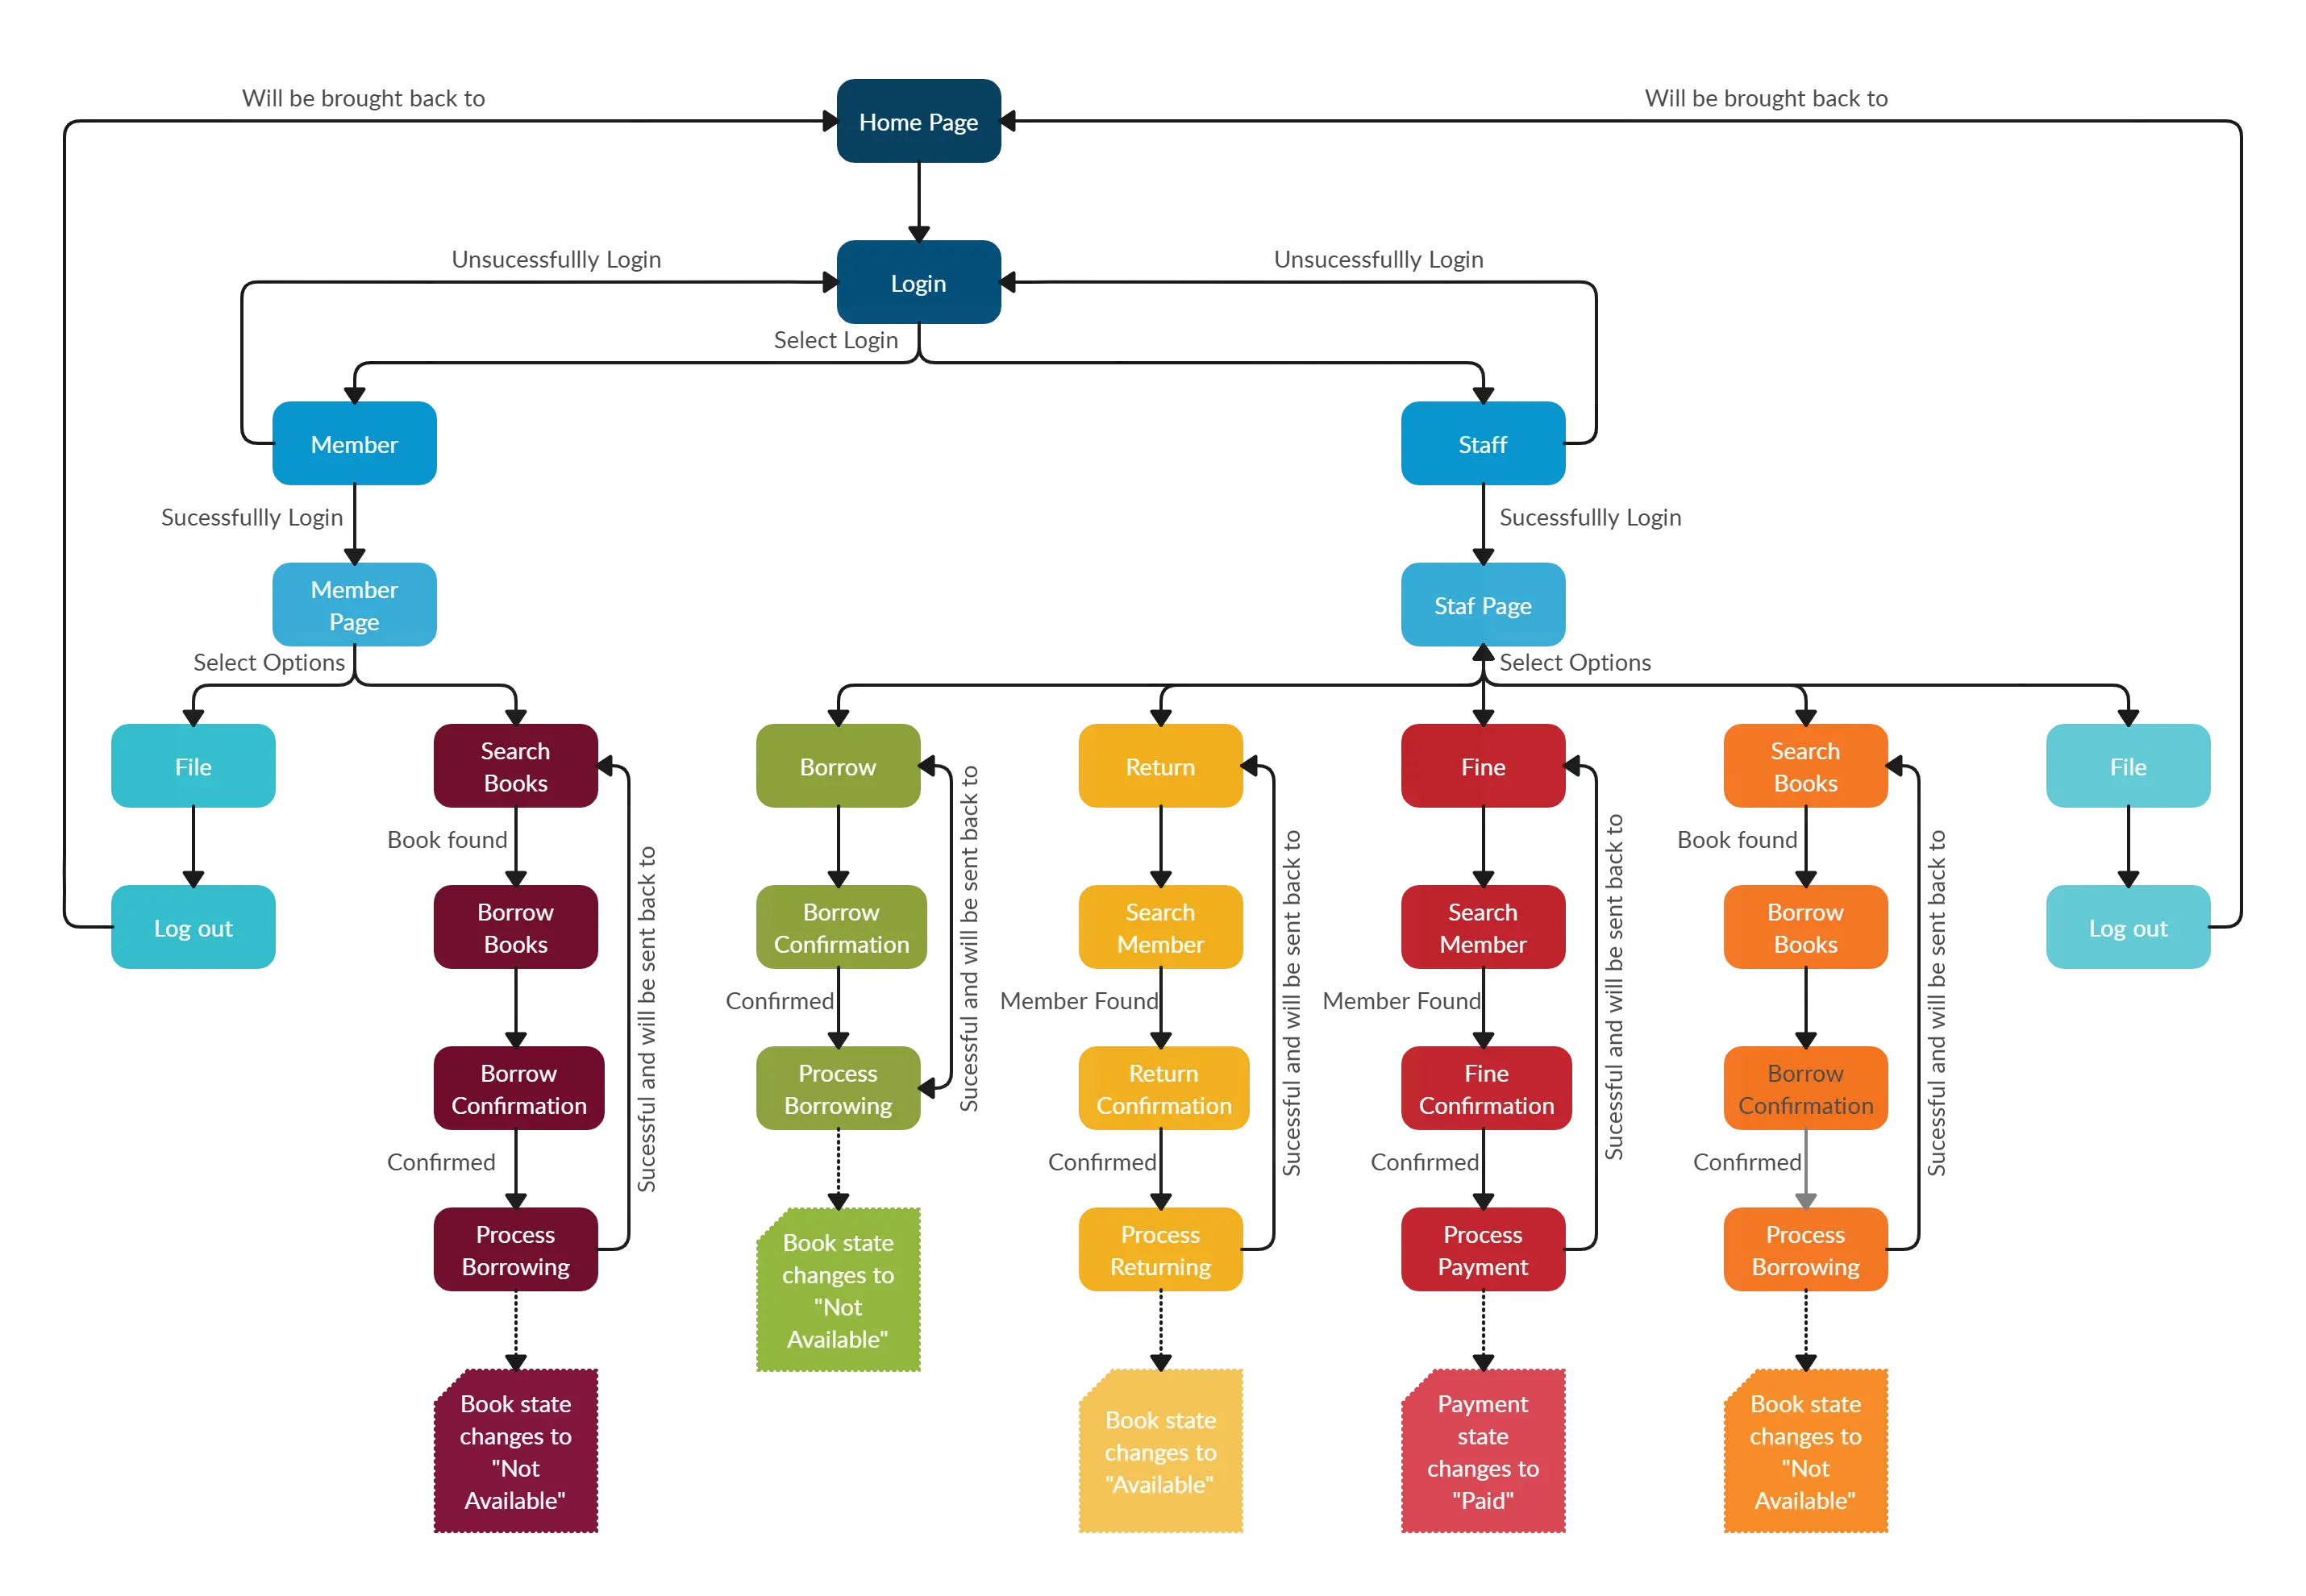
| State Machine Diagram | Shows states of an object and transitions triggered by events. | Use to model object lifecycle, behavior changes, or reactive systems. |
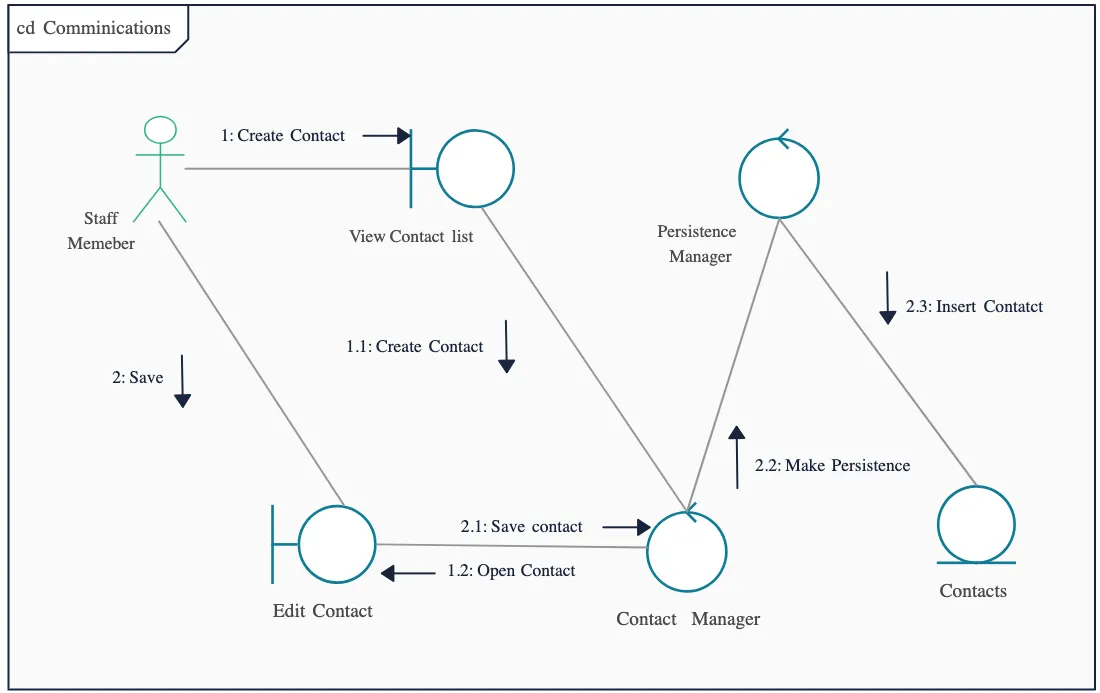
| Communication Diagram | Focuses on object interactions and the messages exchanged, emphasizing relationships rather than sequence. | Use when understanding communication between objects or components is crucial. |
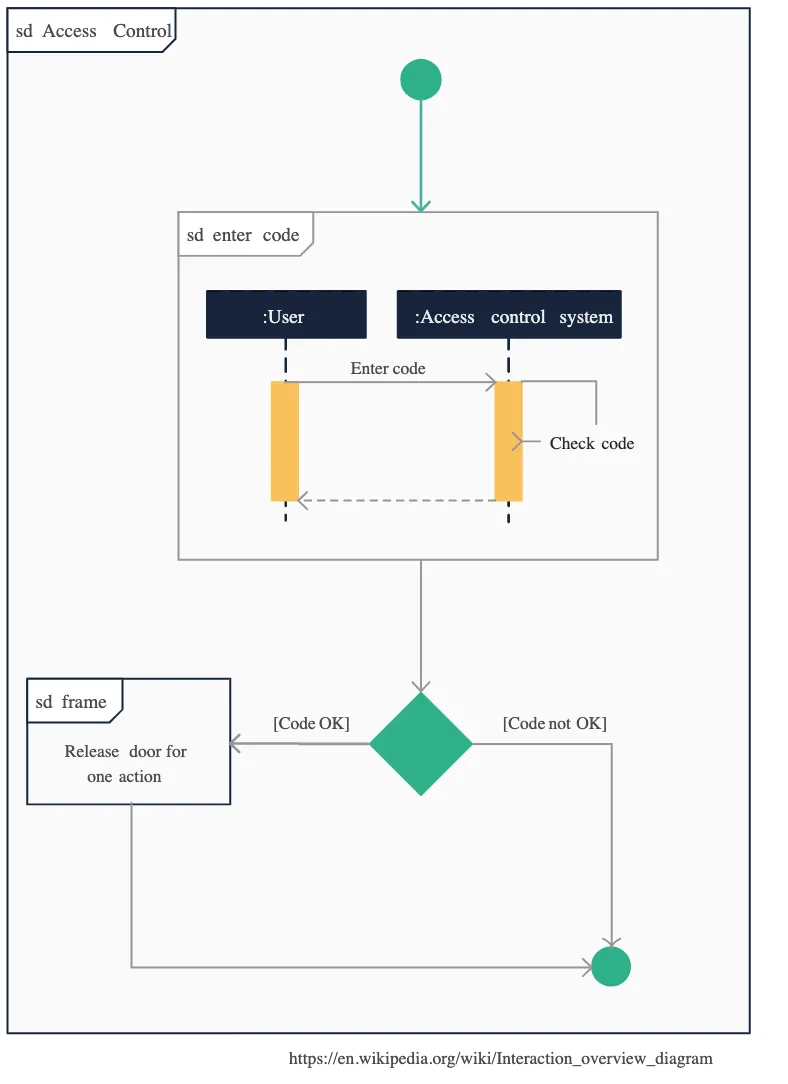
| Interaction Overview Diagram | Combines elements of activity and sequence diagrams to show control flow between interactions. | Use to provide a high-level overview of complex interactions in a system. |
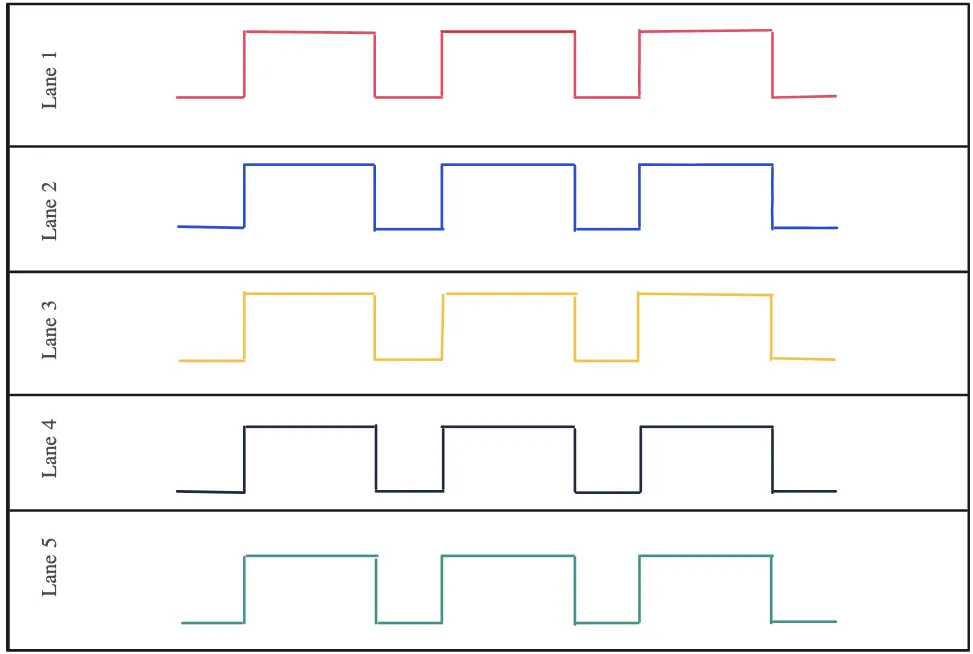
| Timing Diagram | Represents object behavior over time, showing state changes and message exchanges along a timeline. | Use for real-time systems or scenarios where timing and synchronization are important. |
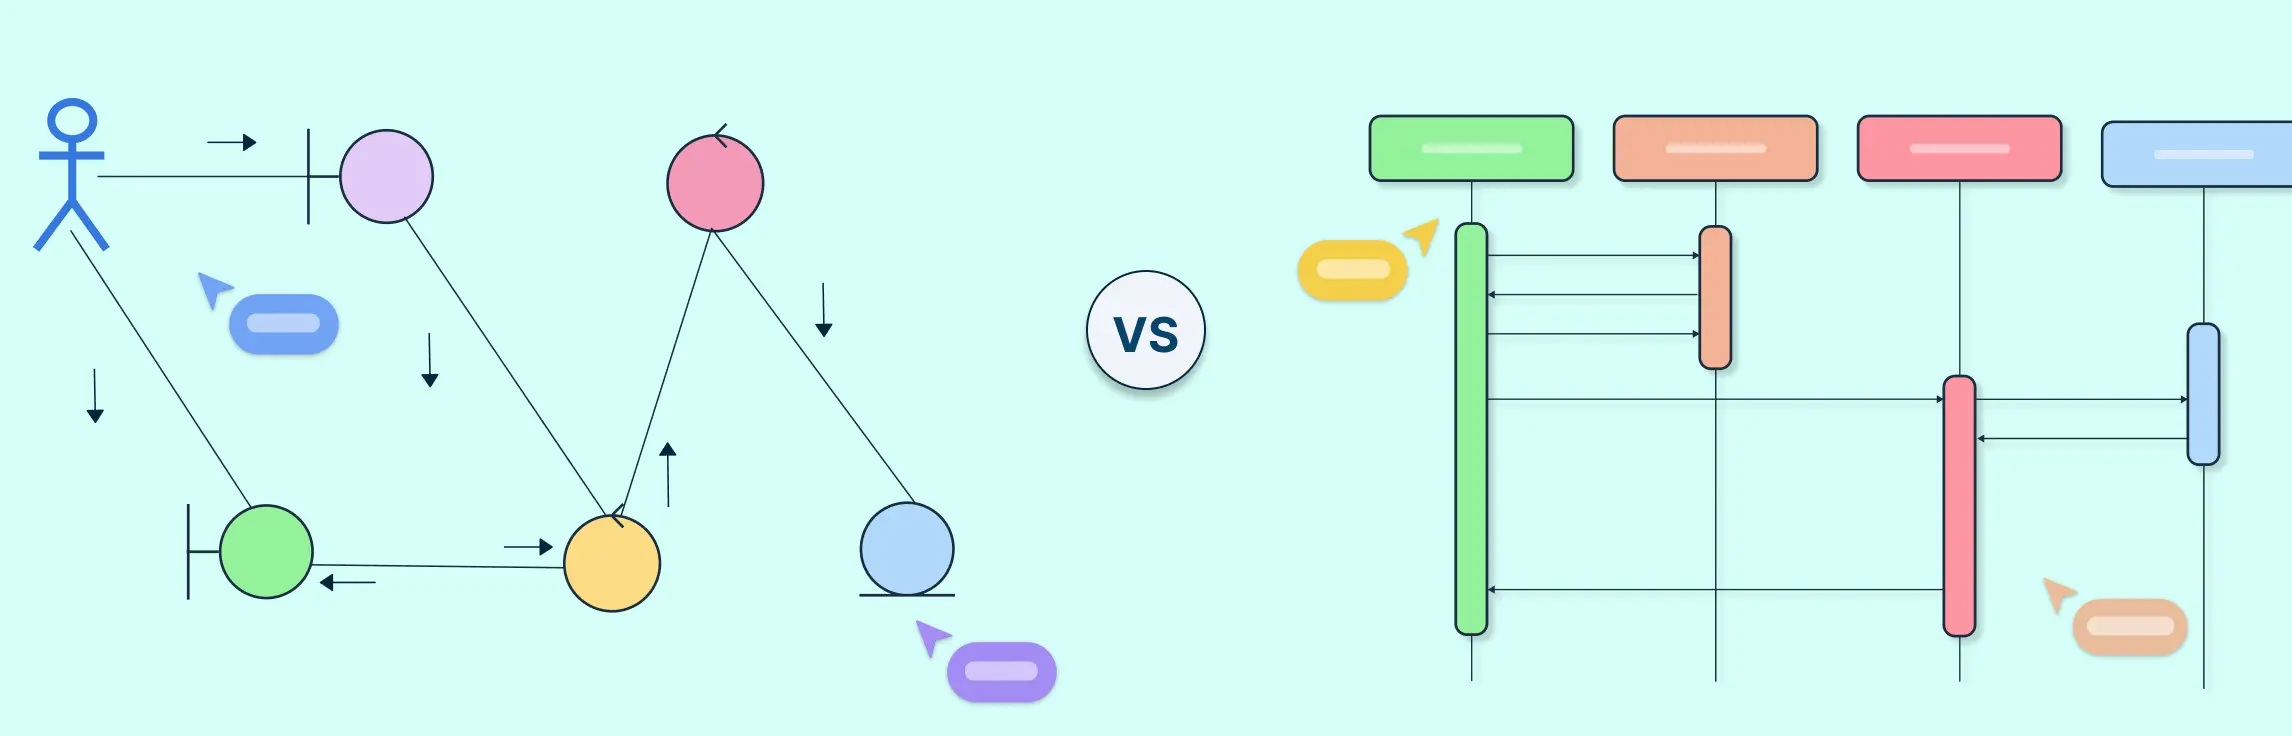
Structural vs Behavioral Diagrams: Key Differences
Structural diagrams show what a system is, while behavioral diagrams show how it works. Both together give a complete picture of a system, making it easier to design, communicate, and analyze effectively.
| Aspect | Structural Diagrams | Behavioral Diagrams |
| Focus | Static system elements and their relationships | Dynamic system behavior and interactions over time |
| Purpose | Illustrate the architecture and organization of the system | Capture workflows, processes, and object interactions |
| Perspective | System-centric | Interaction- or process-centric |
| Typical Use | Planning, documenting, and communicating system structure | Analyzing processes, user interactions, and runtime behavior |
| Output | Blueprint of system components | Flow of actions, sequences, and state changes |
| Examples | Class, Component, Deployment, Package diagrams | Use Case, Sequence, Activity, State Machine diagrams |
Integrating Structural and Behavioral Diagrams
Structural and behavioral diagrams each provide a different perspective of a system, but their real power comes when they are used together. By integrating both types, you get a complete understanding of how a system is built and how it operates.
How they complement each other
Structural diagrams define the components, classes, and architecture—the system’s foundation.
Behavioral diagrams show how those components interact, respond, and perform tasks over time.
Together, they allow you to connect the “what” with the “how”, making it easier to design, analyze, and communicate complex systems.
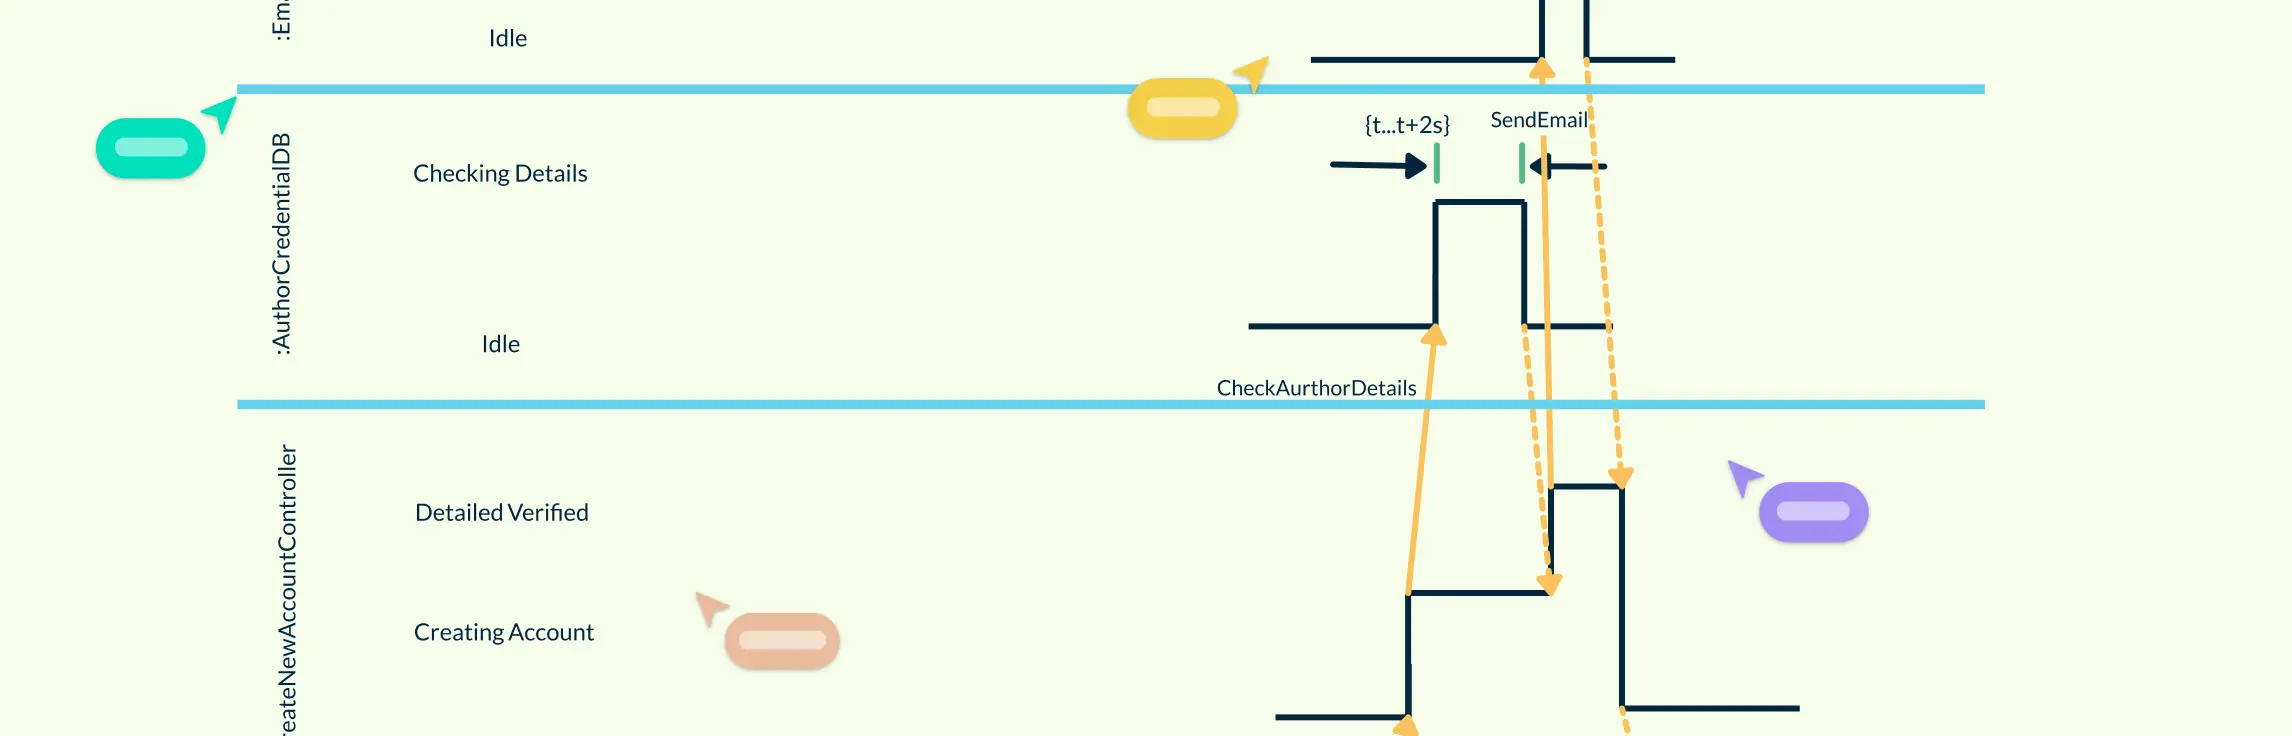
Practical example
You might use a class diagram to model the structure of a banking system and a sequence diagram to show how a transaction flows between different classes. This combination ensures that the design is both well-organized and functional.
ATM Class Diagram


ATM Sequence Diagram

Tips for integrating them effectively
Start with structure: Begin by mapping out the system’s components using structural diagrams.
Layer in behavior: Use behavioral diagrams to show how the components interact to perform tasks.
Keep them aligned: Ensure that the elements in behavioral diagrams correspond to components in structural diagrams.
Use visual tools: Tools like UML diagram software can help maintain consistency and make integration easier.
Free UML Templates
Now that you know the differences between structural and behavioral diagrams, here are UML diagram type templates to get you started.
FAQs About UML Structural and Behavioral Diagrams
Can structural and behavioral diagrams be used together?
Which UML diagram should I start with?
Are there similarities between structural and behavioral diagrams?
What is the best tool to create structural and behavioral diagrams?
Are UML diagrams only for software development?
What are common mistakes to avoid when creating UML diagrams?