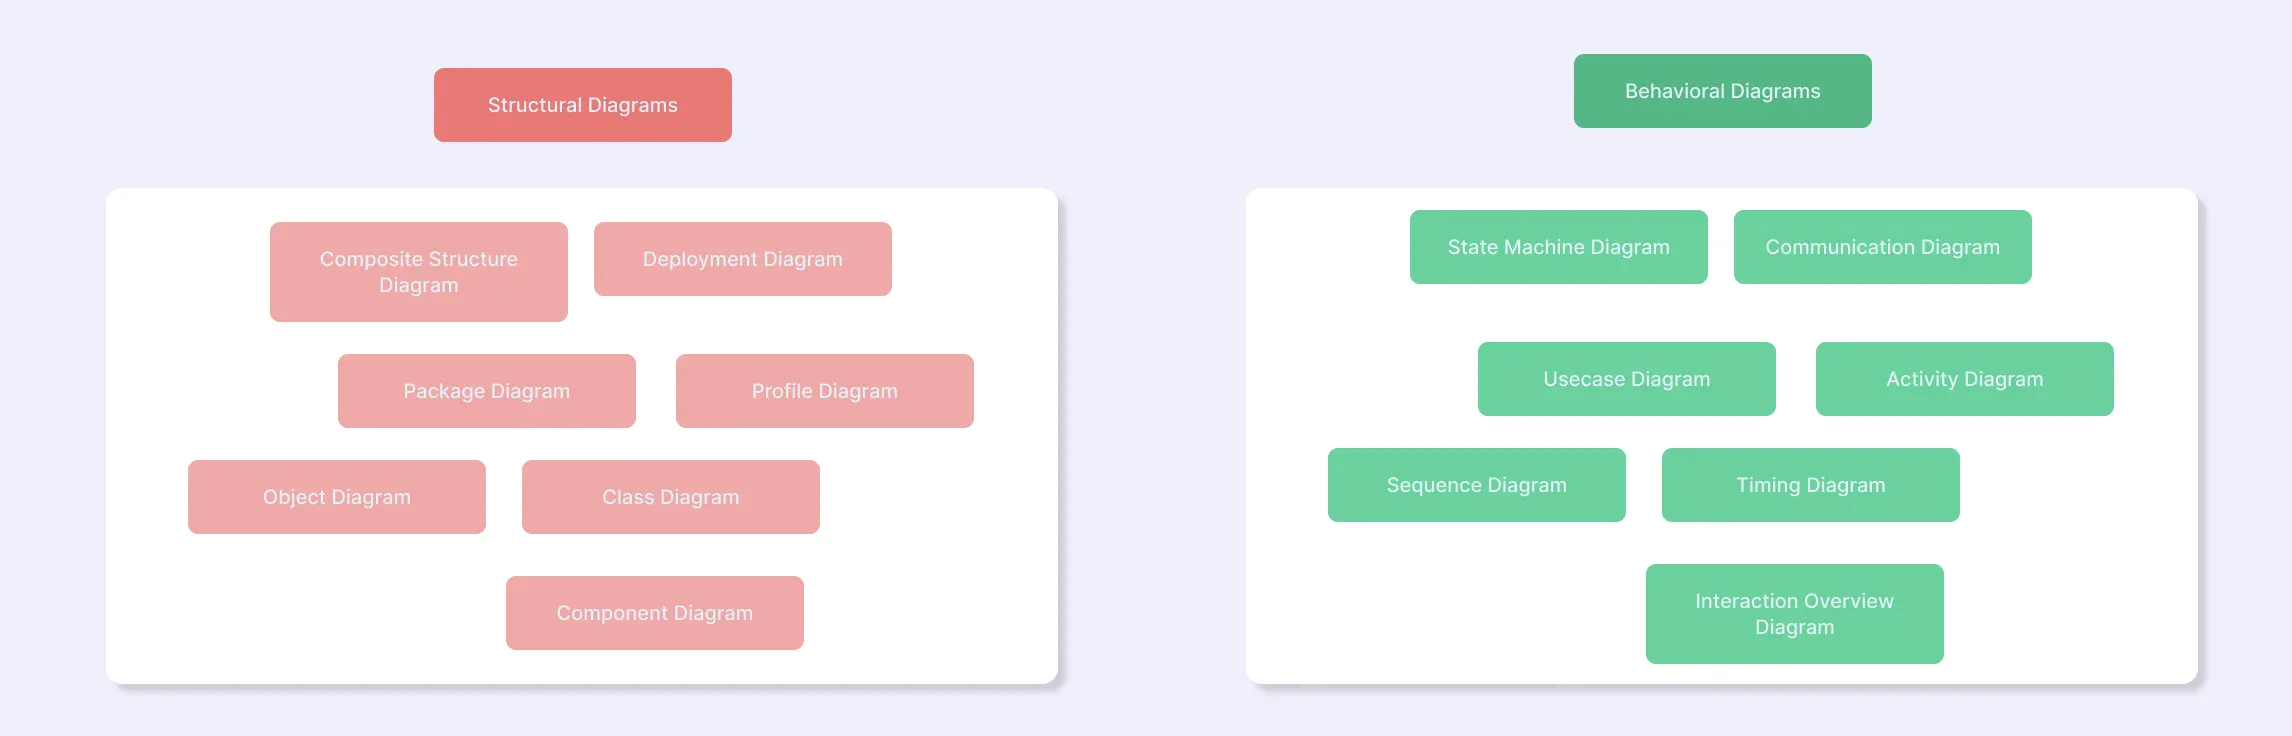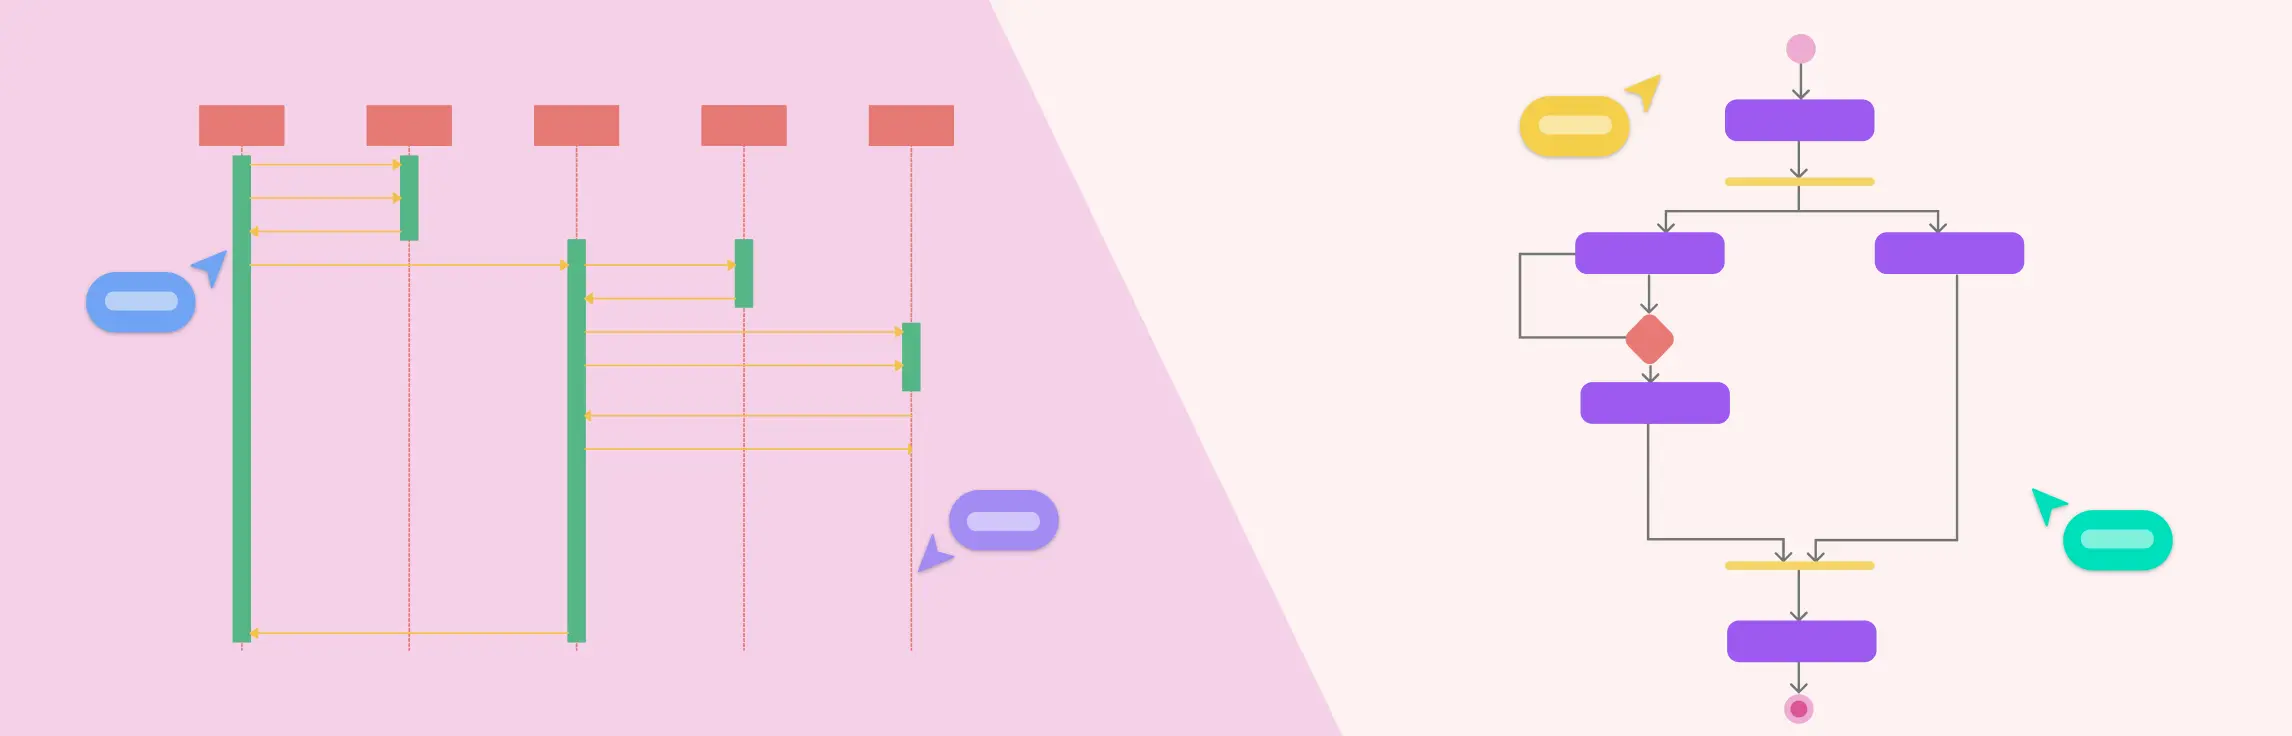
Visualizing how a system behaves is key to effective software design, and UML (Unified Modeling Language) makes this easy. Among its behavioral diagrams, the Sequence Diagram and Activity Diagram stand out for showing interactions and workflows. This guide explores Sequence vs Activity Diagram, highlighting their differences, components, and when to use each for clear, actionable system modeling.
What Is a Sequence Diagram
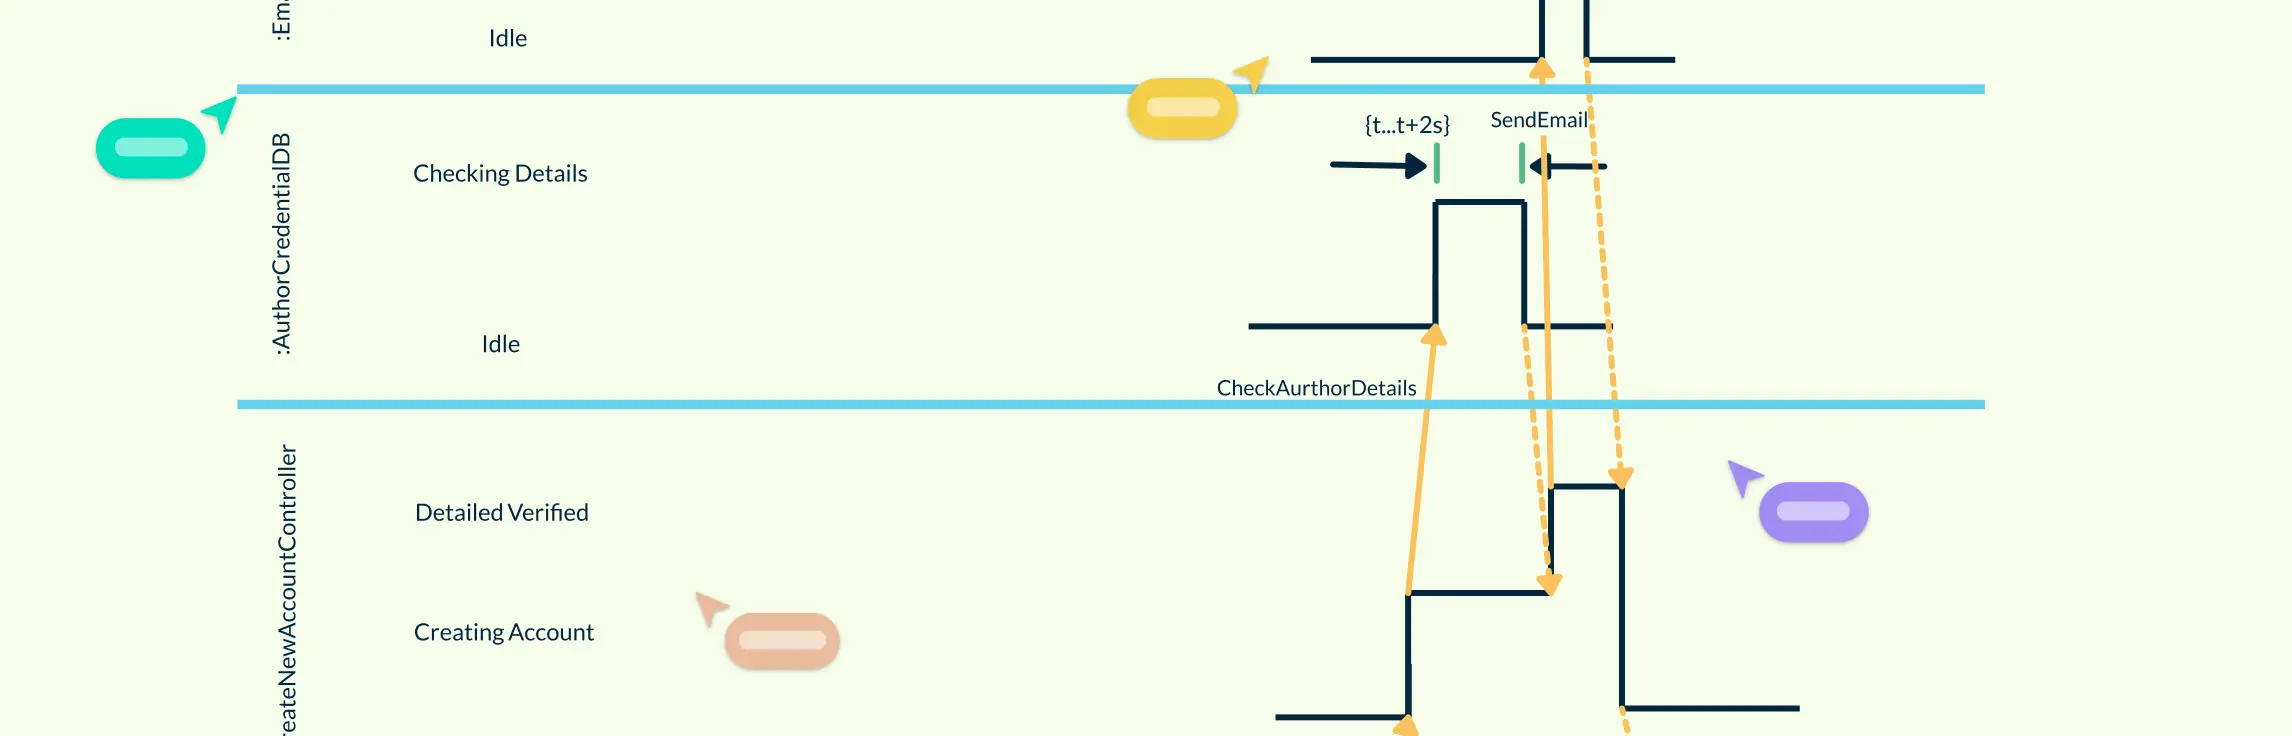
A Sequence Diagram is a type of UML behavioral diagram that illustrates how objects interact in a system over time. It focuses on the chronological order of messages exchanged between components, making it ideal for understanding specific scenarios and workflows.
Key components
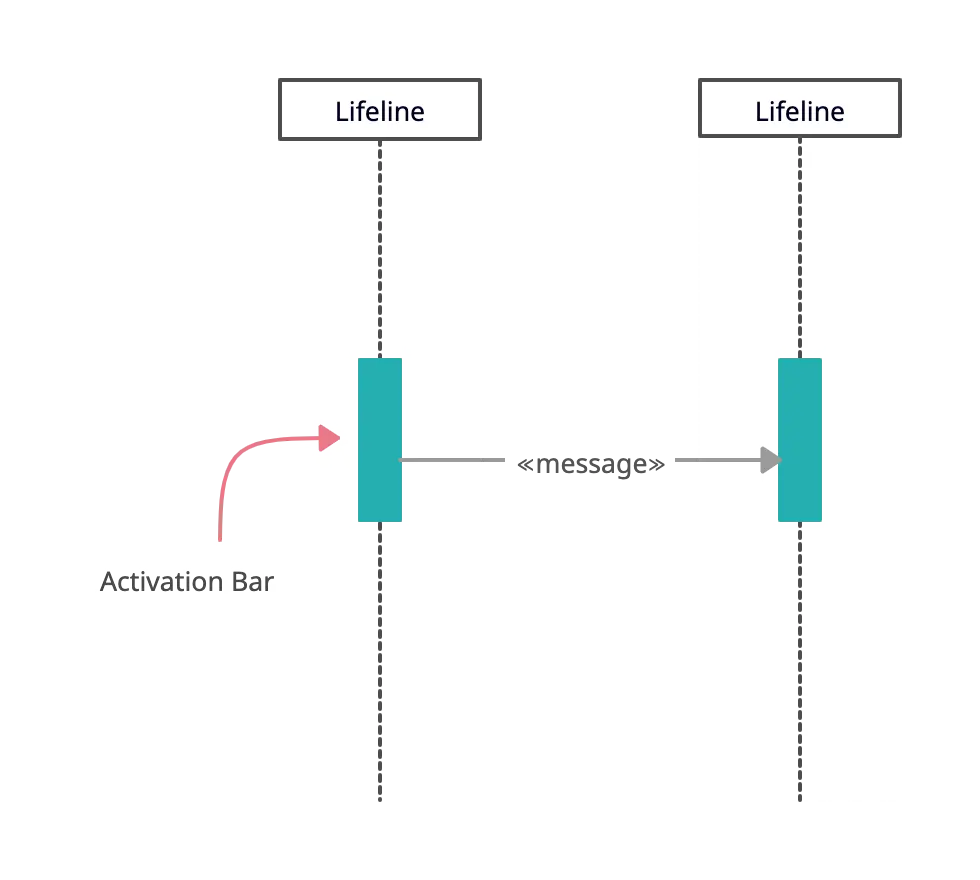
Lifelines: Represent individual objects or participants in the interaction.
Messages: Show the communication between lifelines, including requests, responses, and signals.
Activations: Indicate the period when an object is performing an action or operation.


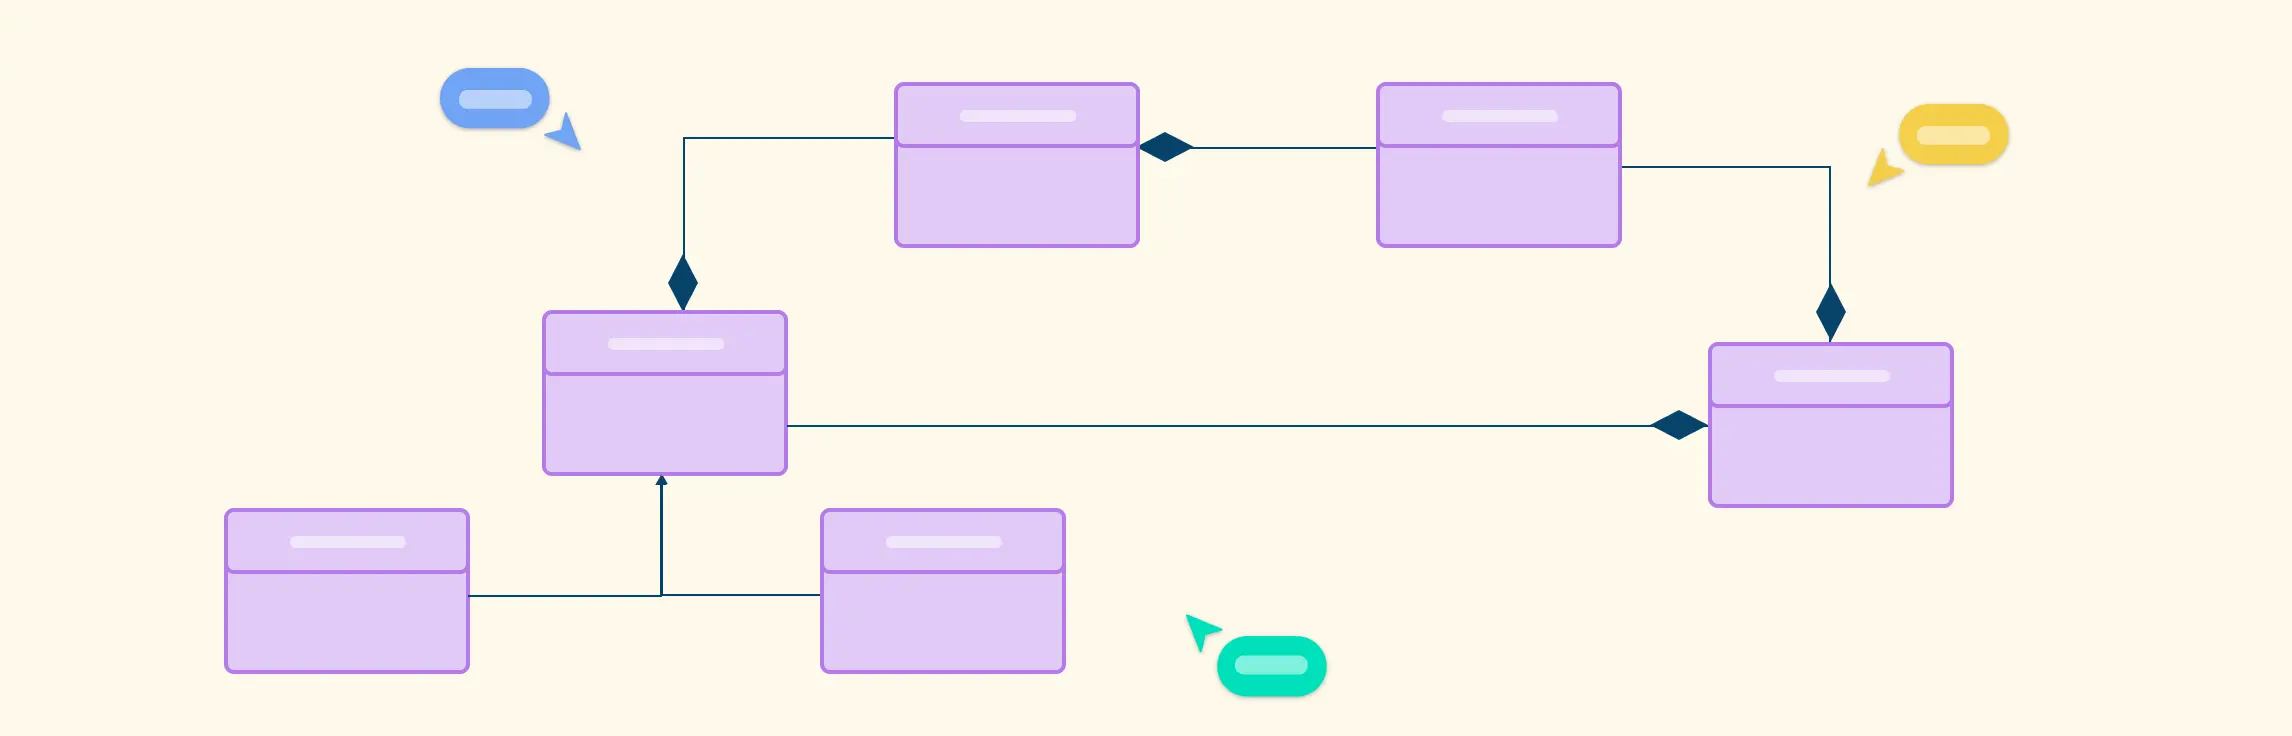
What Is an Activity Diagram
An Activity Diagram is a UML behavioral diagram that visualizes the flow of activities or tasks in a system or process. Unlike a Sequence Diagram, it focuses on what happens rather than the exact order of interactions between objects, making it great for mapping workflows and decision points.
Key components
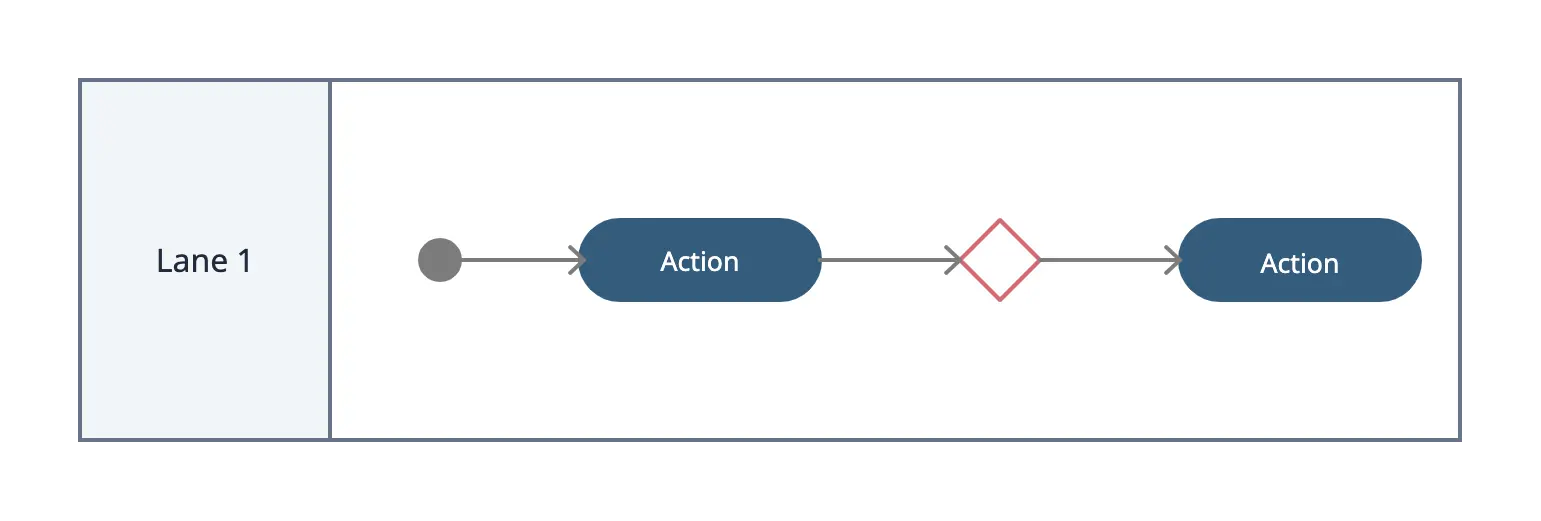
Actions/Activities: Represent individual steps or tasks in the process.
Control flows: Show the direction of the workflow between actions.
Decision nodes: Indicate branching points where choices are made.
Start and end nodes: Define where the process begins and ends.
Swimlanes (optional): Organize activities by the responsible actor or department.

Explore more activity diagram templates in Creately.
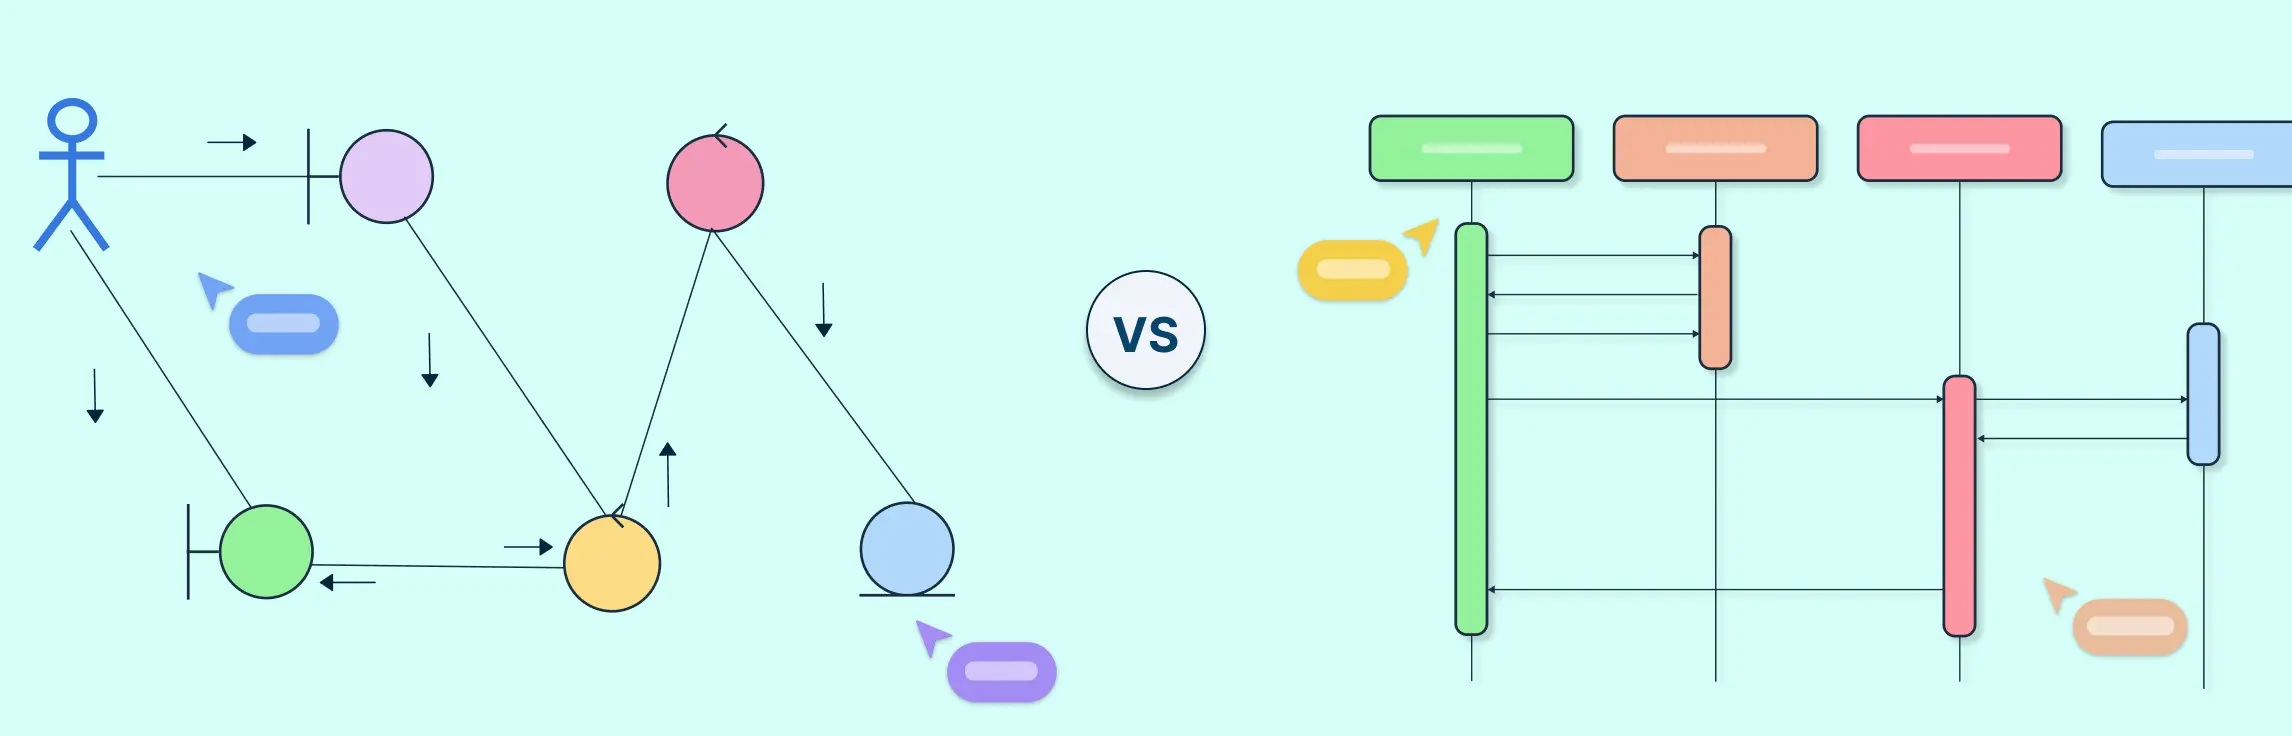
Difference Between Activity Diagram and Sequence Diagram
Understanding the differences between a sequence diagram and an activity diagram is key to choosing the right tool for modeling system behavior. Here’s a detailed comparison:
| Aspect | Sequence Diagram | Activity Diagram |
| Purpose | Shows interactions between objects over time, ideal for tracing exact message flow. | Focuses on workflow and process logic, emphasizing task progression rather than object interactions. |
| Focus | Centers on object interactions, highlighting who communicates and when. | Emphasizes activity flow, showing how one action leads to another in a process. |
| Notation | Uses lifelines, messages, activations to depict object communication. | Uses actions, control flows, decision nodes, swimlanes to illustrate workflow and responsibilities. |
| Granularity | Provides detailed, step-by-step interactions, good for precise behavior analysis. | Offers a high-level overview of processes, suitable for visualizing workflows without implementation details. |
| Time Representation | Depicts events in chronological order, showing exact message sequence. | Represents time logically, focusing on the sequence of actions rather than precise timing. |
| Decision Making | Limited support for branching, usually with simple alternatives or loops. | Handles decisions explicitly using decision and merge nodes for clear workflow paths. |
| Concurrency | Minimal support for parallel processes, can be complex to visualize. | Supports concurrent activities clearly, including forks and joins. |
| Readability/Clarity | Can become cluttered in complex systems with many interactions. | Typically easier to read, providing a simplified overview for stakeholders. |
When to Use Each Diagram
Choosing the right diagram depends on what aspect of your system you want to visualize. Both activity diagrams and sequence diagrams serve different purposes and are most effective in specific scenarios:
Sequence diagrams are best suited when you need to:
Understand object interactions in a specific scenario: Sequence Diagrams clearly show which objects communicate, the order of interactions, and how data or messages flow between them. This is particularly useful for modeling user-system interactions or API calls.
Trace message flow between components or systems: When debugging or designing complex workflows that involve multiple objects, creating a Sequence Diagram helps track the sequence of messages and ensures all interactions are accounted for.
Model detailed method calls or event sequences: For developers and technical teams, Sequence Diagrams provide a granular view of the exact order of operations, including synchronous and asynchronous calls. This level of detail helps ensure the correct implementation of the system.

Activity diagrams are ideal when you want to:
Map high-level workflows or business processes: Activity Diagrams give a clear visual of how a process flows from start to finish, making them suitable for documenting business logic, operational procedures, or user journeys.
Visualize decision points, branching, and concurrency: Creating an activity diagram allows you to explicitly model choices, parallel processes, and loops, providing a complete picture of how activities progress under different conditions.
Communicate process logic to stakeholders: Since Activity Diagrams focus on tasks rather than technical object interactions, they are easier for non-technical stakeholders, such as managers or clients, to understand and review.

Combining Sequence and Activity Diagrams
While sequence and activity diagrams each serve distinct purposes, using them together can provide a comprehensive view of a system. Leveraging both diagrams helps teams understand not only how a system behaves at a high level but also how individual components interact in detail.
Benefits of using both
Complete perspective: Activity diagrams capture the overall workflow, while sequence diagrams show detailed interactions between objects. Using both ensures no aspect of system behavior is overlooked.
Improved clarity: Combining diagrams helps both technical and non-technical stakeholders grasp complex processes, from overarching workflows to step-by-step interactions.
Better design and validation: Modeling processes at multiple levels makes it easier to identify gaps, redundancies, or potential issues in both logic and implementation.
Enhanced communication: Teams can reference the same system using two complementary views, reducing misunderstandings between developers, business analysts, and stakeholders.

How they complement each other
Macro vs. micro view: Activity diagrams provide a macro view, showing the sequence of tasks and decision points. Sequence diagrams provide a micro view, detailing the exact flow of messages and interactions between objects.
Workflow alignment: Activity diagrams help define the overall process flow, which can then be broken down into scenarios modeled by sequence diagrams.
Process validation: By comparing the workflow in an activity diagram with the object-level interactions in a sequence diagram, teams can ensure that both the process logic and implementation details are aligned.

FAQs About Activity Diagram and Sequence Diagram
Are there any similarities between activity and sequence diagrams?
How do Activity and Sequence Diagrams support documentation?
How do Sequence and Activity Diagrams improve system design?
What tools can I use to create these diagrams?
Do Activity and Sequence Diagrams appear in the same development phase?