Easily visualize your processes and workflows with smart automation.
Create visual organizational structures with images and detailed profiles.
Visualize concepts and their relationships on an infinite visual canvas.
Map family history and understand the relationships with detailed genograms.
Visualize relationships between entities using Crows Foot or Chen notation.
Visualize your network infrastructure. Support AWS, CISCO, Azure and more.
Visualize and expand your ideas using our powerful mind mapping tool.
Easily create family trees with our professionally designed templates.
Infinite canvas to add diagrams, images, sticky notes and more.
Run collaborative meetings, workshops or brainstorming sessions.
Collaborative diagramming for educators and students at discounted rates.
Log In
Sign Up Free
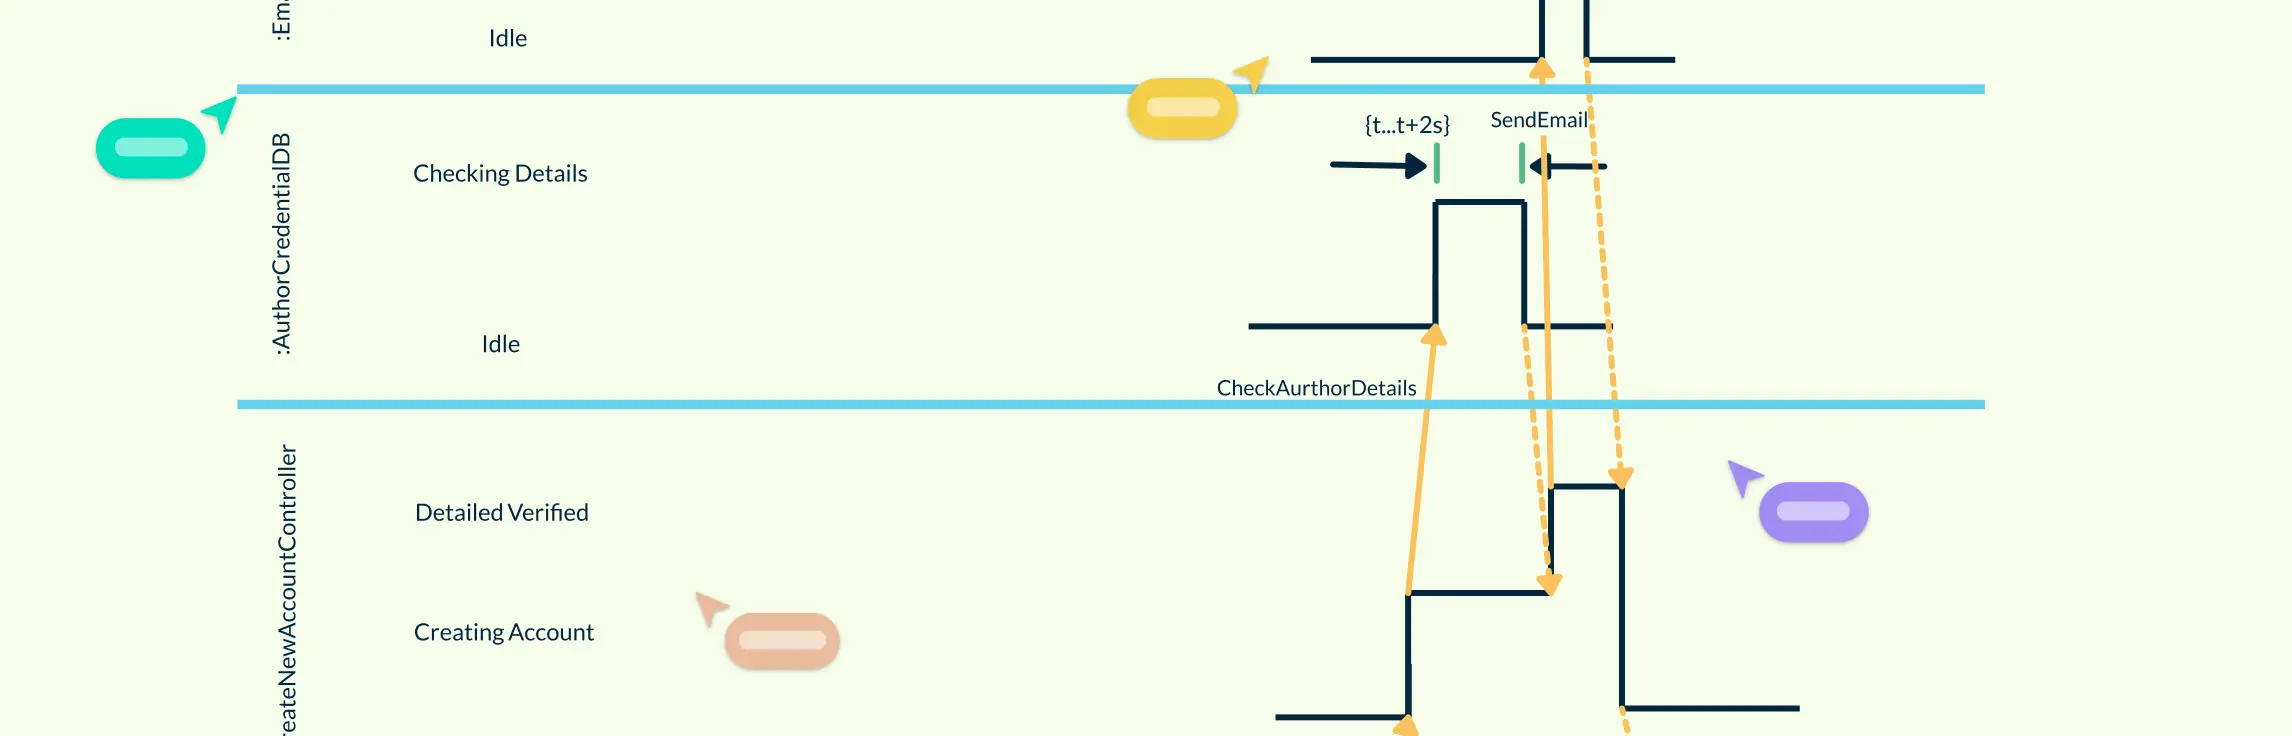
Ever wondered how complex systems keep everything running smoothly, on time, and in sync? Timing is everything, and understanding it can make the difference between a system that works and one that fails. In this guide, you’ll learn the key components, types, and step-by-step process for creating timing diagrams, along with best practices to make your diagrams clear, accurate, and easy to understand.
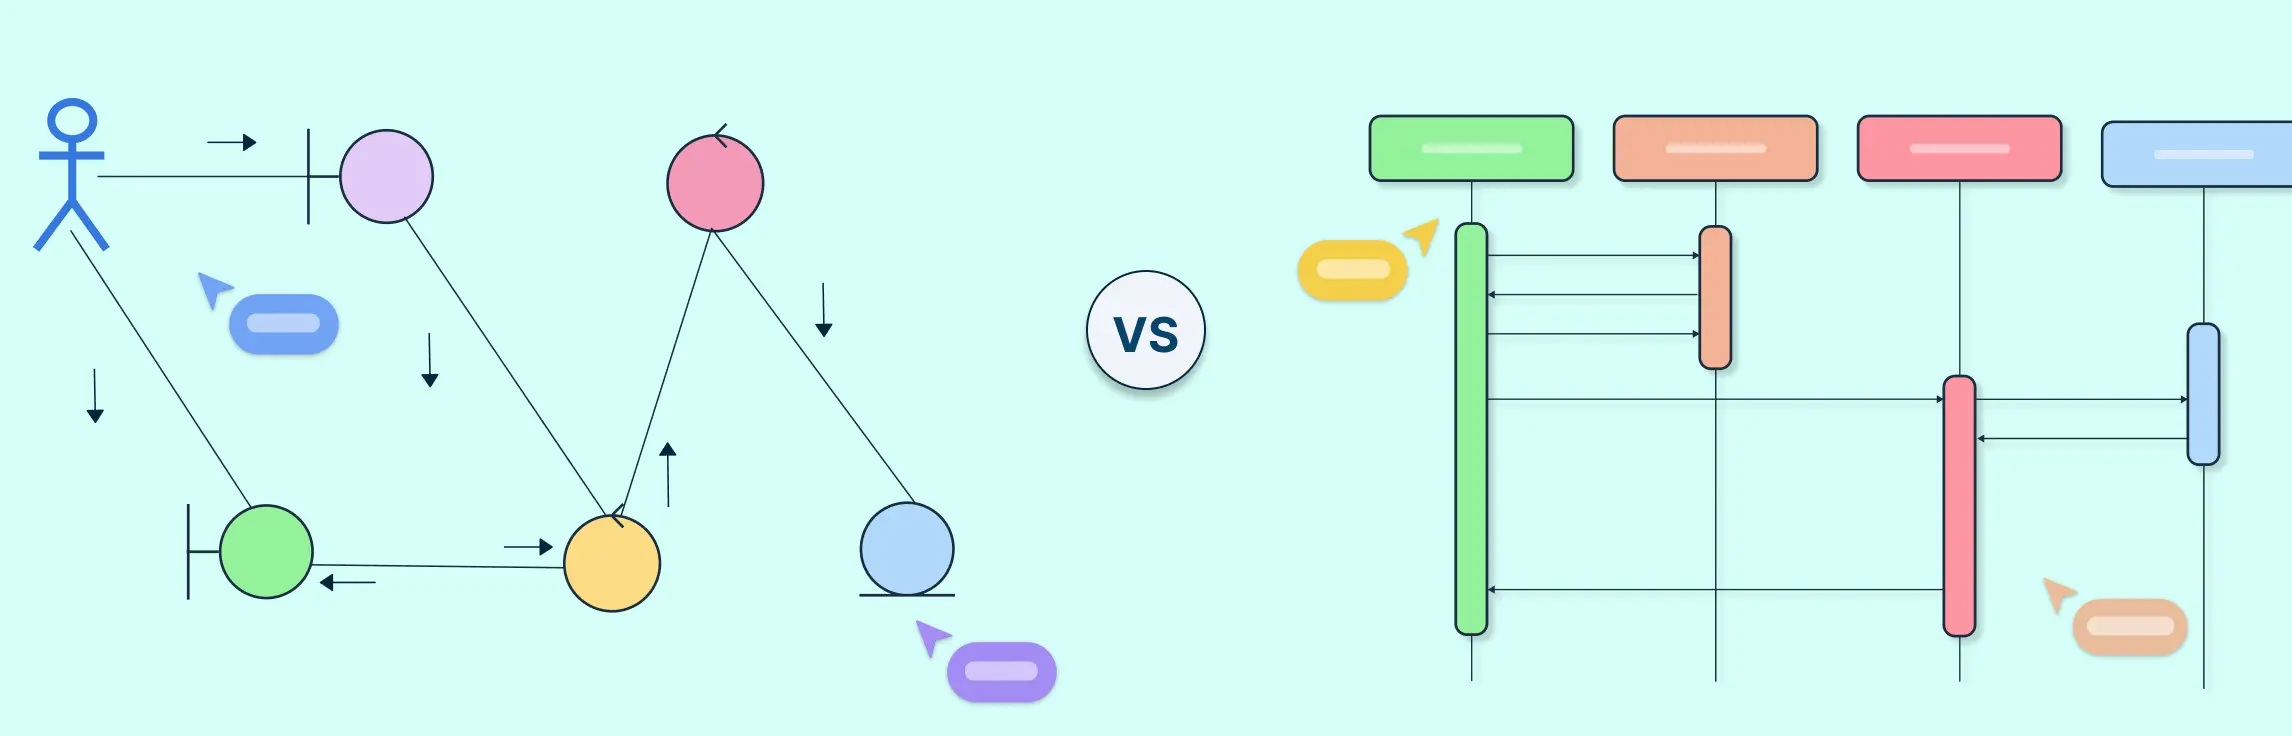
In UML, sequence and communication diagrams both show how objects interact within a system, but they do so from different perspectives. A sequence diagram focuses on the order of messages over time, while a communication diagram emphasizes the relationships and message flow between objects. This guide explains their key differences, when to use each, and how they work together to model system behavior effectively.
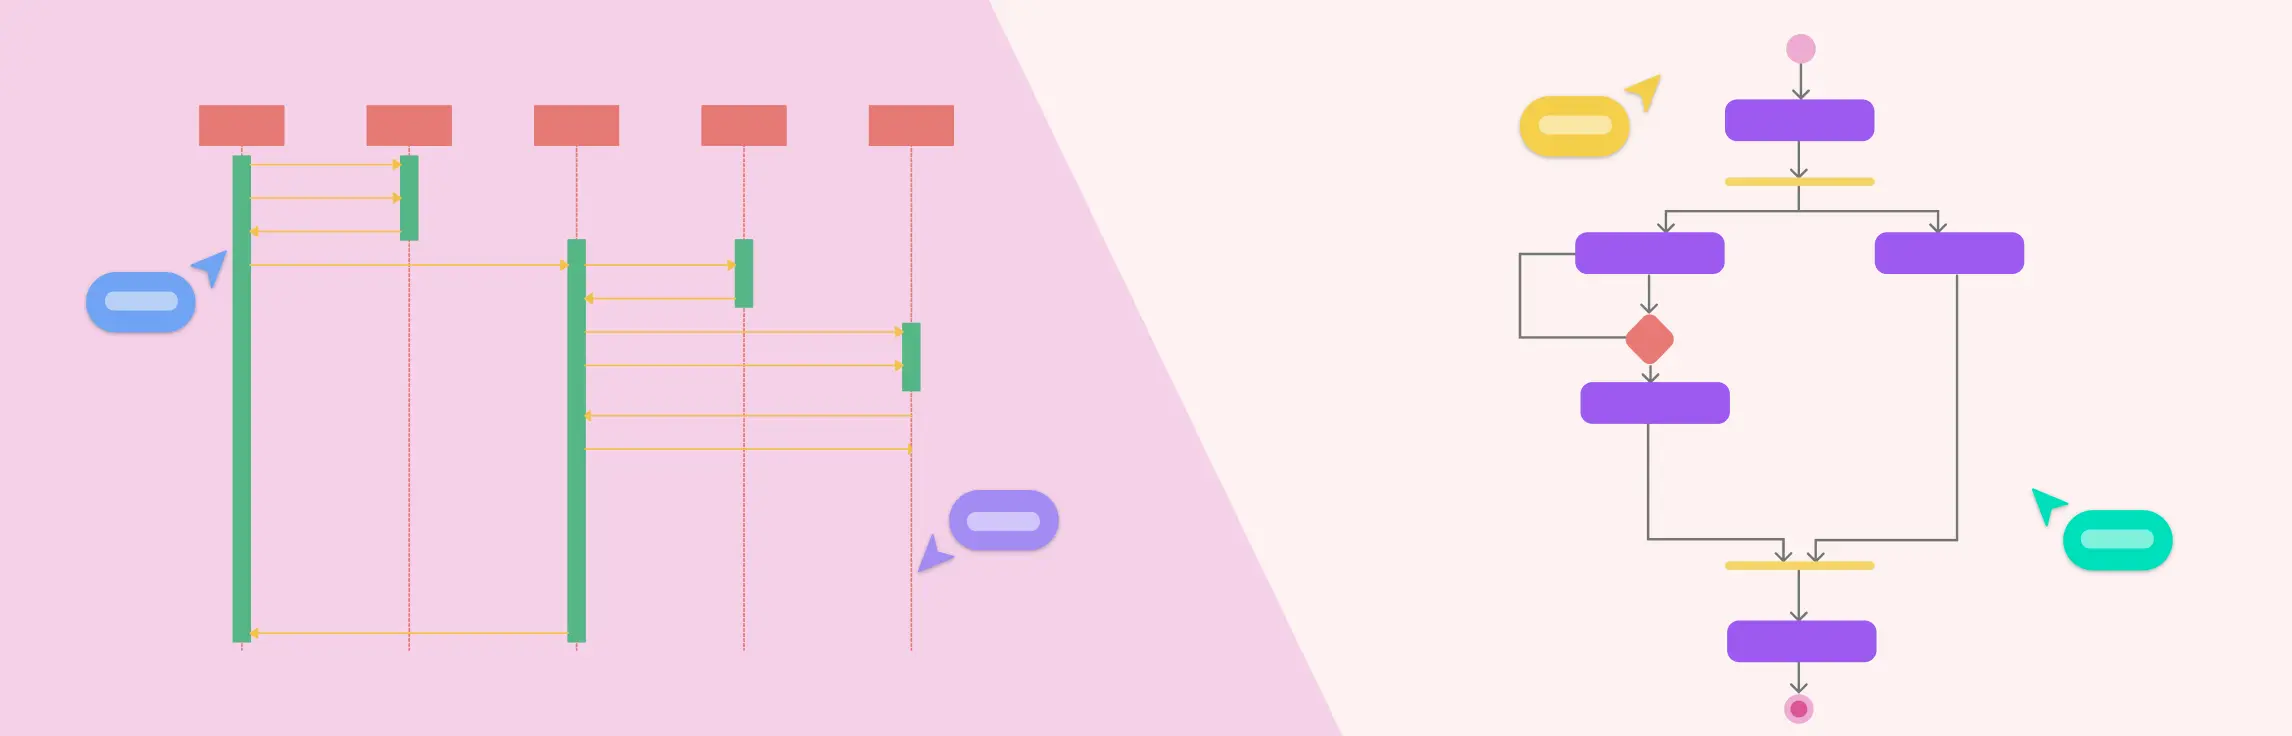
Visualizing how a system behaves is key to effective software design, and UML (Unified Modeling Language) makes this easy. Among its behavioral diagrams, the Sequence Diagram and Activity Diagram stand out for showing interactions and workflows. This guide explores Sequence vs Activity Diagram, highlighting their differences, components, and when to use each for clear, actionable system modeling.
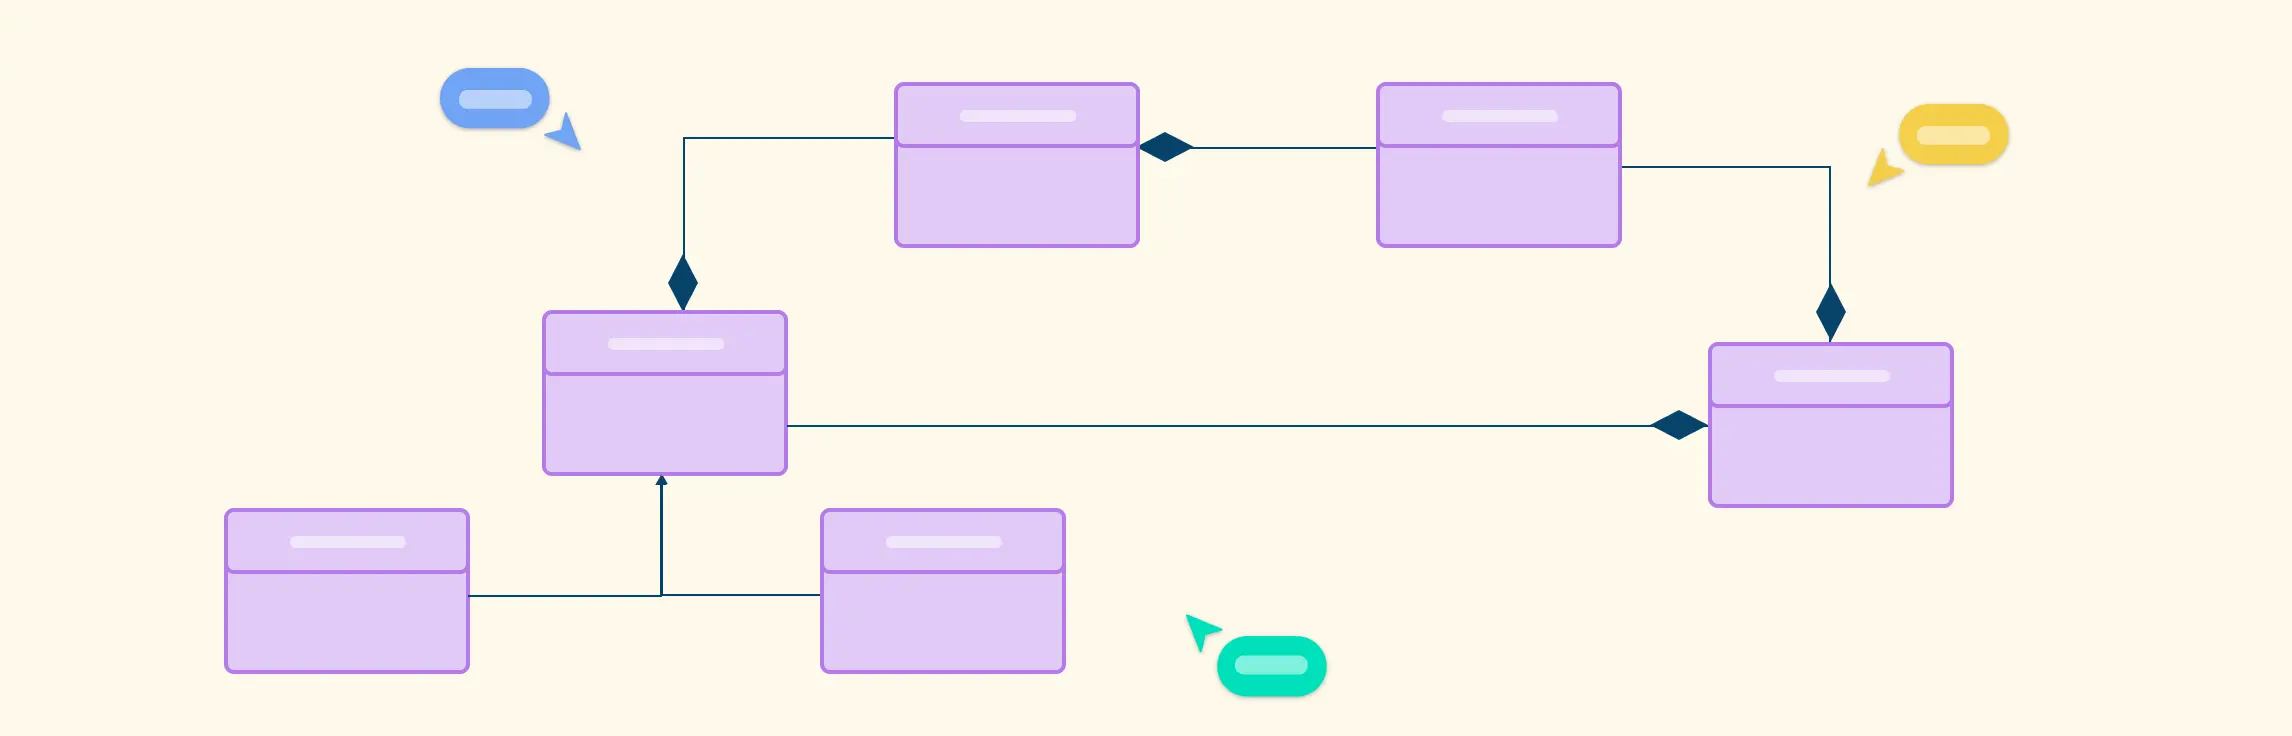
Composite structure diagrams are a UML tool used to model a system’s internal structure, showing how its parts, ports, and connectors interact at runtime. Unlike class diagrams, they focus on the internal composition and collaboration of components.
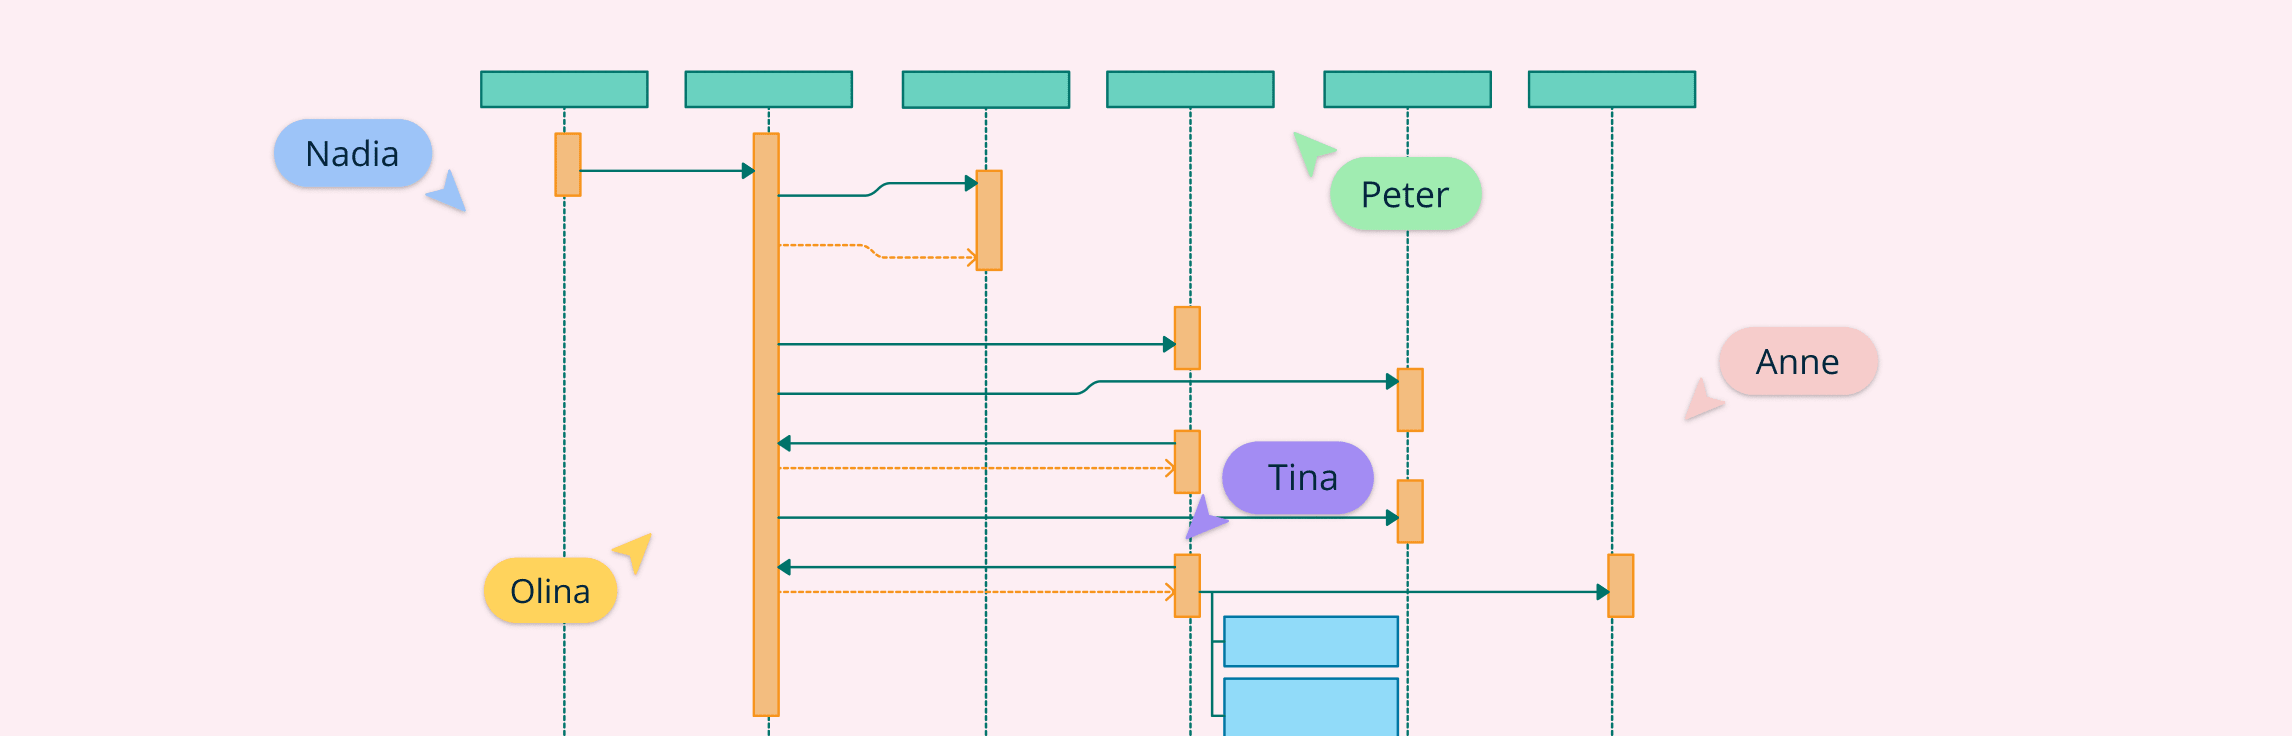
If you have trouble understanding what is a sequence diagram, this guide will provide everything you need to know, including the definition, notations, how to draw a sequence diagram, best practices, examples, and common mistakes you should avoid when drawing one.
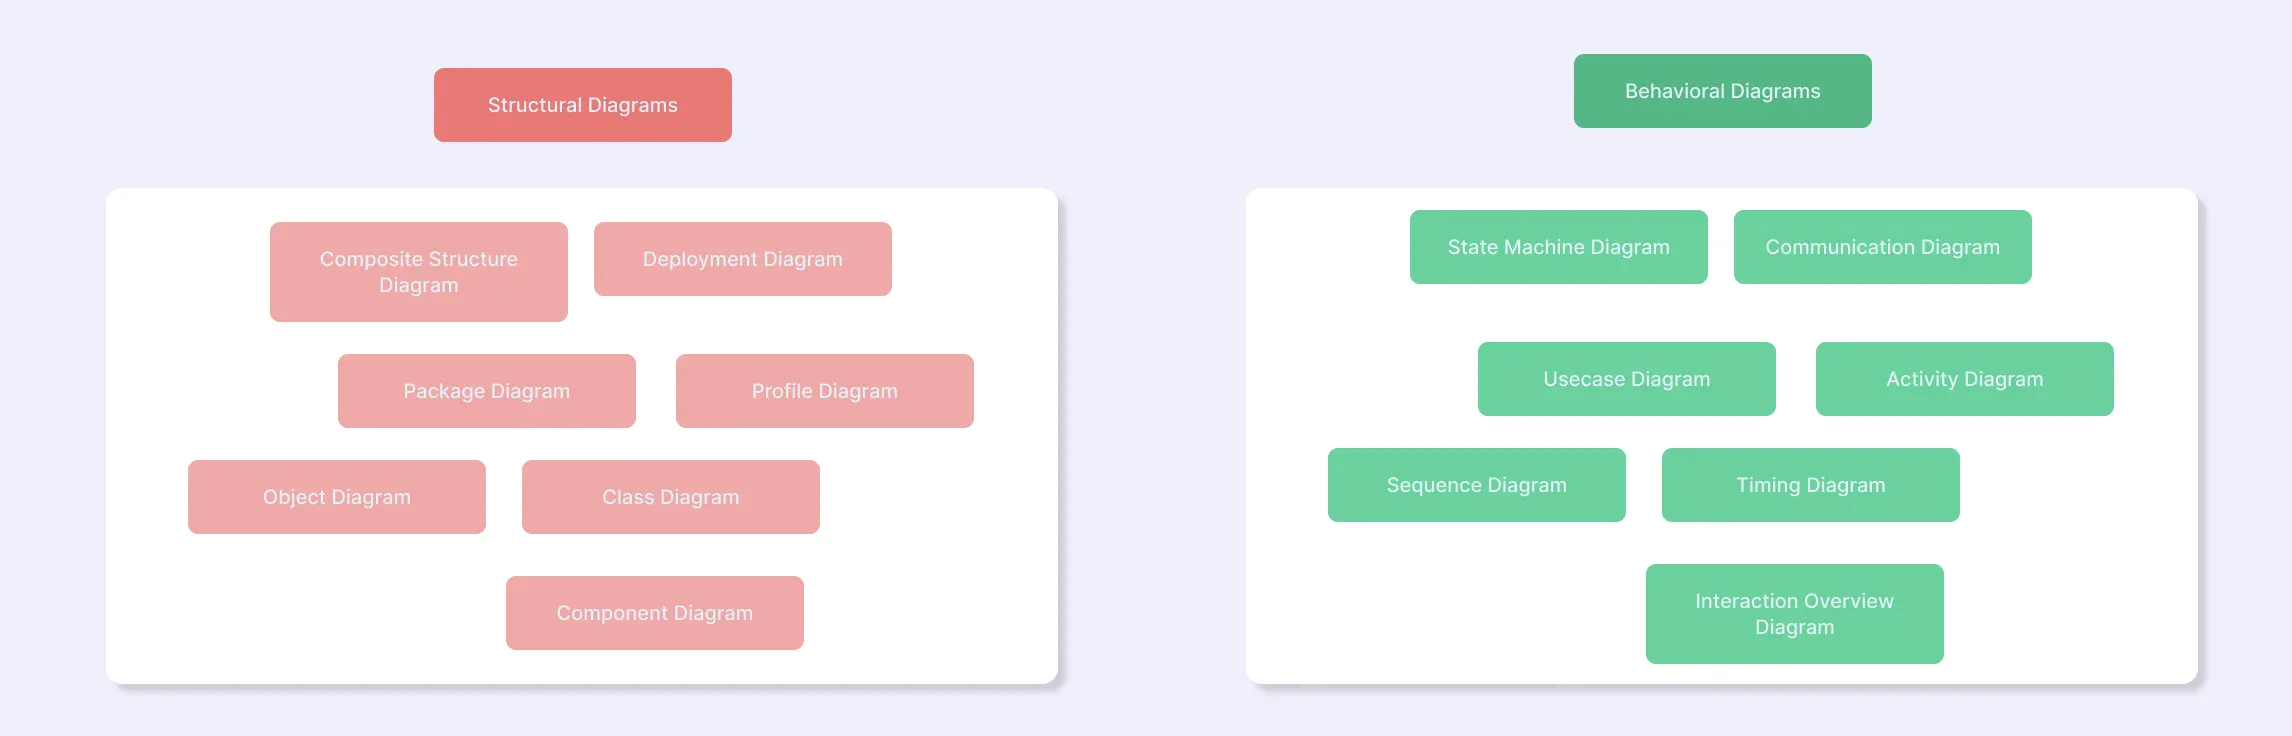
UML diagrams are visual tools that help software developers and designers understand and communicate how a system works. They provide a clear picture of both the structure of a system and how it behaves, making complex ideas easier to grasp. In this guide, we’ll explore the two main types of UML diagrams—structural and behavioral—compare their purposes, and show how they complement each other to give a complete view of any software system.
Step 1. Define the Specifications There are a few specifications you need to define before you go ahead and develop your app.