Mergers and acquisitions rarely fail because the deal logic is wrong—they fail during integration. Unclear reporting lines, overlapping roles, ambiguous authority, and misaligned structures make it difficult for leaders to execute even the strongest strategies. An org chart, when used correctly, becomes one of the most effective tools for managing this complexity.
This guide provides a comprehensive overview of how org charts are used in mergers and acquisitions. It explains what makes M&A org charts different from standard org charts, the types used at each stage of the deal, who relies on them for decisions, common mistakes to avoid, and how integration teams use org charts to plan structure, manage transition, and design the future organization.
What Is an Org Chart for Mergers and Acquisitions?
An org chart for mergers and acquisitions is a planning artifact used to analyze, design, and communicate organizational structure including the evolving M&A department structure before, during, and after a deal. Unlike standard org charts, which document a stable reporting structure, M&A org charts are designed to evolve as assumptions change and integration decisions are made. These org charts are used to compare legacy organizations, model transitional reporting, assess structural risk, and design the future operating model. Rather than documenting what already exists, they help leaders decide what should exist at each stage of the merger or acquisition.
Types of Org Charts Used in Mergers and Acquisitions
There is no single “M&A org chart.” Different types of mergers and acquisitions org charts are used depending on where the organization is in the deal and what decisions need to be made.
Legacy Org Charts
These represent Company A and Company B separately and are used to understand existing structures, leadership layers, and role scope.
Transitional Org Charts
These organizational charts introduce dual or dotted‑line reporting to reflect interim authority during integration.
Target Operating Model Org Charts
They define the future‑state organization once integration decisions are clearer.
Scenario Or What‑if Org Charts
These allow teams to test alternative structures and trade‑offs without committing to change.
Understanding these types helps teams choose the right org chart for the decision they are trying to make.
When Organizational Charts Are Used Across the M&A Lifecycle
Org charts are used differently at each stage of a merger or acquisition.
- Pre‑close, they support analysis, comparison, and risk identification by visualizing both organizations independently.
- On Day‑1, they clarify authority, reporting lines, and interim governance to reduce uncertainty.
- By Day‑100 and beyond, they support optimization, consolidation, and stabilization of the target operating model.
Viewing organizational charts through a lifecycle lens helps teams understand that structure is not decided once, but refined as integration progresses.
Who Uses Org Charts During Mergers and Acquisitions—and Why
Organizational charts are used by multiple stakeholders during a merger or acquisition, each with different decision needs.
- M&A integration teams use org charts to plan structure, manage transition, and sequence decisions.
- Corporate development and strategy teams use them to assess integration complexity and execution risk.
- HR business partners rely on org charts to support workforce planning, role clarity, and communication.
- Executives and boards use simplified org views to understand governance, leadership load, and future‑state design.
This broad usage makes organizational charts a shared reference point across the integration process.
How to Create an M&A Org Chart
Creating a mergers and acquisitions org chart begins with assembling the right structural inputs, not by drawing reporting lines. Unlike standard org charts, which document an existing organization, M&A org charts are created to support comparison, planning, and future‑state design. At creation time, the goal is to model structure accurately while keeping it flexible enough to evolve as integration decisions are made.
Step 1: Gather and Normalize Organizational Data
Start by collecting structural data from both organizations, including:
- Departments and business units
- Roles and positions
- Existing reporting relationships
- Management layers and spans of control
This information should be normalized so both organizations can be viewed and compared using consistent terminology and structure.
Step 2: Create Separate Legacy Org Charts
Next, create separate organizational charts for Company A and Company B. At this stage:
- Do not merge structures
- Do not make integration decisions
- Focus only on representing each organization accurately
These legacy org charts serve as the baseline for all future comparison and planning.
Step 3: Model Roles and Positions Independently from People
Before assigning individuals, structure the organizational chart around roles and positions. This allows teams to:
- Design the organization without bias
- Avoid premature people decisions
- Keep the chart stable as leadership changes occur during integration
Role‑based modeling is essential for redundancy analysis and future‑state design.
Step 4: Prepare the Organizational Chart for Change
A mergers and acquisitions org chart should be created with the expectation that it will change. Before moving into integration planning:
- Ensure roles can be moved or reassigned easily
- Allow for temporary reporting lines
- Support multiple versions or scenarios of the same structure
Once the initial mergers and acquisitions organizational chart is created, it becomes a living planning tool used throughout integration.
How Org Charts Are Used Before, During, and After a Merger
The steps below show how an organizational chart is actually used by integration teams, not as documentation at the end, but as a decision‑making tool throughout the process.
Compare Legacy Organizations Using Separate Org Charts
Before making any integration decisions, leaders need visibility into both organizations as they exist today. This comparison reduces assumption‑driven planning and creates a common reference point for integration discussions. This step is about establishing a factual baseline, not deciding what stays or goes.
Separate legacy organizational charts allow teams to:
- Compare leadership layers and hierarchy depth
- Identify duplicated functions and uneven spans of control
- Surface structural differences that will affect integration complexity
- Align leadership on what is truly different versus what only appears different
Once both organizations are visible and understood, the next challenge is making their roles comparable.
Map Roles Across Companies to Align Accountability
Job titles are unreliable during mergers. The same title can represent vastly different scope, authority, and responsibility across organizations. Role mapping ensures integration decisions are based on accountability, not assumptions. Without this step, downstream decisions about reporting and consolidation are likely to fail.
In this step, organizational charts are used to:
- Normalize role definitions across both companies
- Reveal mismatches hidden behind similar titles
- Clarify ownership and decision rights
- Create a shared language for integration planning
With roles aligned, teams can now address how authority flows during the transition.
Model Dual Reporting Structures During Integration
Dual reporting is common during M&A integration, especially when functional, regional, or product leadership structures overlap. Problems arise when these arrangements are informal or poorly communicated. This step focuses on managing transition, not designing the final organization.
Org charts are used here to:
- Make primary and secondary reporting lines explicit
- Clarify who owns decisions during the transition
- Prevent silent power struggles between leaders
- Communicate interim governance clearly to managers
Once reporting relationships are clear, structural overlap becomes easier to see.
Identify Redundant and Overlapping Roles with Position‑Based Org Charts
Redundancy planning is one of the most sensitive aspects of M&A integration. Rushing this step often leads to talent loss, instability, and poor outcomes. At this stage, organizational charts support planning, not execution. Decisions about people come later, informed by structural clarity.
Position‑based org charts help teams:
- Separate roles from individuals
- Identify true overlap across legacy organizations
- Highlight single points of failure masked by duplication
- Plan phased consolidation rather than immediate cuts
With overlaps understood, teams can move from analysis to design.
Design the Target Operating Model Using Overlay Org Charts
This is the pivot point from understanding the present to designing the future. The output of this step is a credible target operating model—not yet final, but concrete enough to evaluate.
Overlay organizational charts allow integration teams to:
- Combine legacy structures into a single target model
- Adjust leadership layers and spans of control
- Validate whether the future‑state organization is practical
- Identify overload or governance gaps before implementation
Before committing, teams need to test their assumptions.
Test Integration Options with Scenario Planning
No integration plan survives first contact with reality. Scenario planning allows teams to prepare for that uncertainty. At this stage, the org chart becomes a decision‑support tool, enabling evidence‑based choices rather than opinion‑driven debate.
Using org charts, integration leaders can:
- Model alternative integration paths
- Compare leadership load and structural risk
- Explore trade‑offs without disrupting the live organization
- Iterate as assumptions change
Common Mistakes When Using Organizational Charts in M&A
Common mistakes when using mergers and acquisitions org charts include:
- Treating org charts as communication artifacts instead of planning tools.
- Freezing structure too early, before integration realities emerge.
- Hiding transitional complexity such as dual reporting.
- Designing around people instead of roles, making the organization fragile as leaders move or exit.
Best Practices for Using Org Charts Throughout the Integration Lifecycle
To get full value from organizational charts during M&A:
- Start modeling before close: Early org chart modeling helps integration teams identify structural risks and prepare Day‑1 and Day‑100 plans before execution pressure begins.
- Keep structures role‑based, not person‑based: Designing around roles instead of individuals creates stability as people move, exit, or change responsibilities during integration.
- Make transitional complexity visible: Explicitly showing dual reporting and interim structures prevents confusion and clarifies decision ownership during the transition period.
- Update org charts as decisions evolve: Org charts should reflect current thinking, not just finalized outcomes, so they remain useful as a planning and alignment tool.
- Treat the org chart as a living planning artifact: Continuously evolving org charts preserve context, reduce rework, and support better decisions throughout the integration lifecycle.
Used this way, organizational charts reduce uncertainty, accelerate alignment, and support stronger post‑merger integration outcomes.
Why Use Creately Org Charts for Mergers and Acquisitions Planning
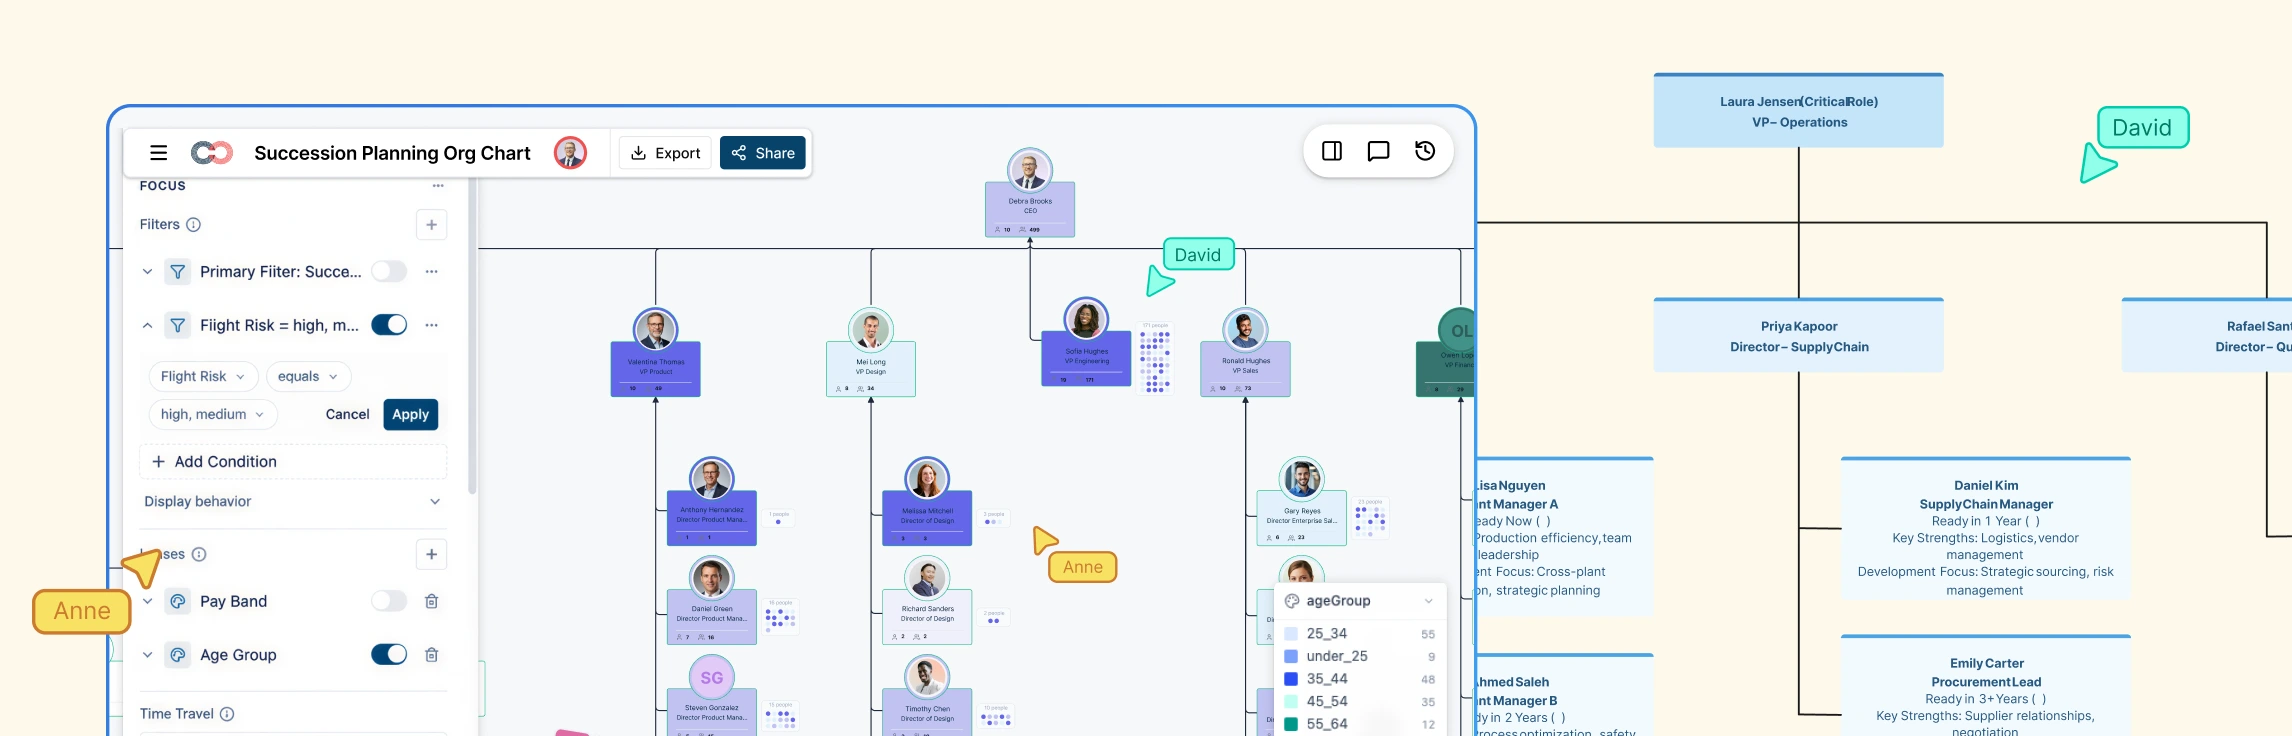
Once teams understand how org charts should be used during integration, the next question is whether their tools can actually support that workflow. Creately’s org chart software is designed to handle the realities of M&A integration—not just static reporting.
Built for Transitional and Matrix Organizations
Creately supports multiple relationship types, making it possible to model dual and matrix reporting clearly. This allows integration teams to document how authority works during transition instead of relying on informal explanations.
Position‑Based Modeling for Redundancy and Workforce Planning
Roles can exist independently of people, including vacant or unstaffed positions. This makes it possible to design the structure first and make workforce planning decisions later—reducing risk and rework.
Side‑by‑Side and Overlay Views for Integration Analysis
Creately allows teams to maintain separate legacy org charts and use scenario‑based or overlay views to compare structures and design future‑state organizations without redrawing diagrams.
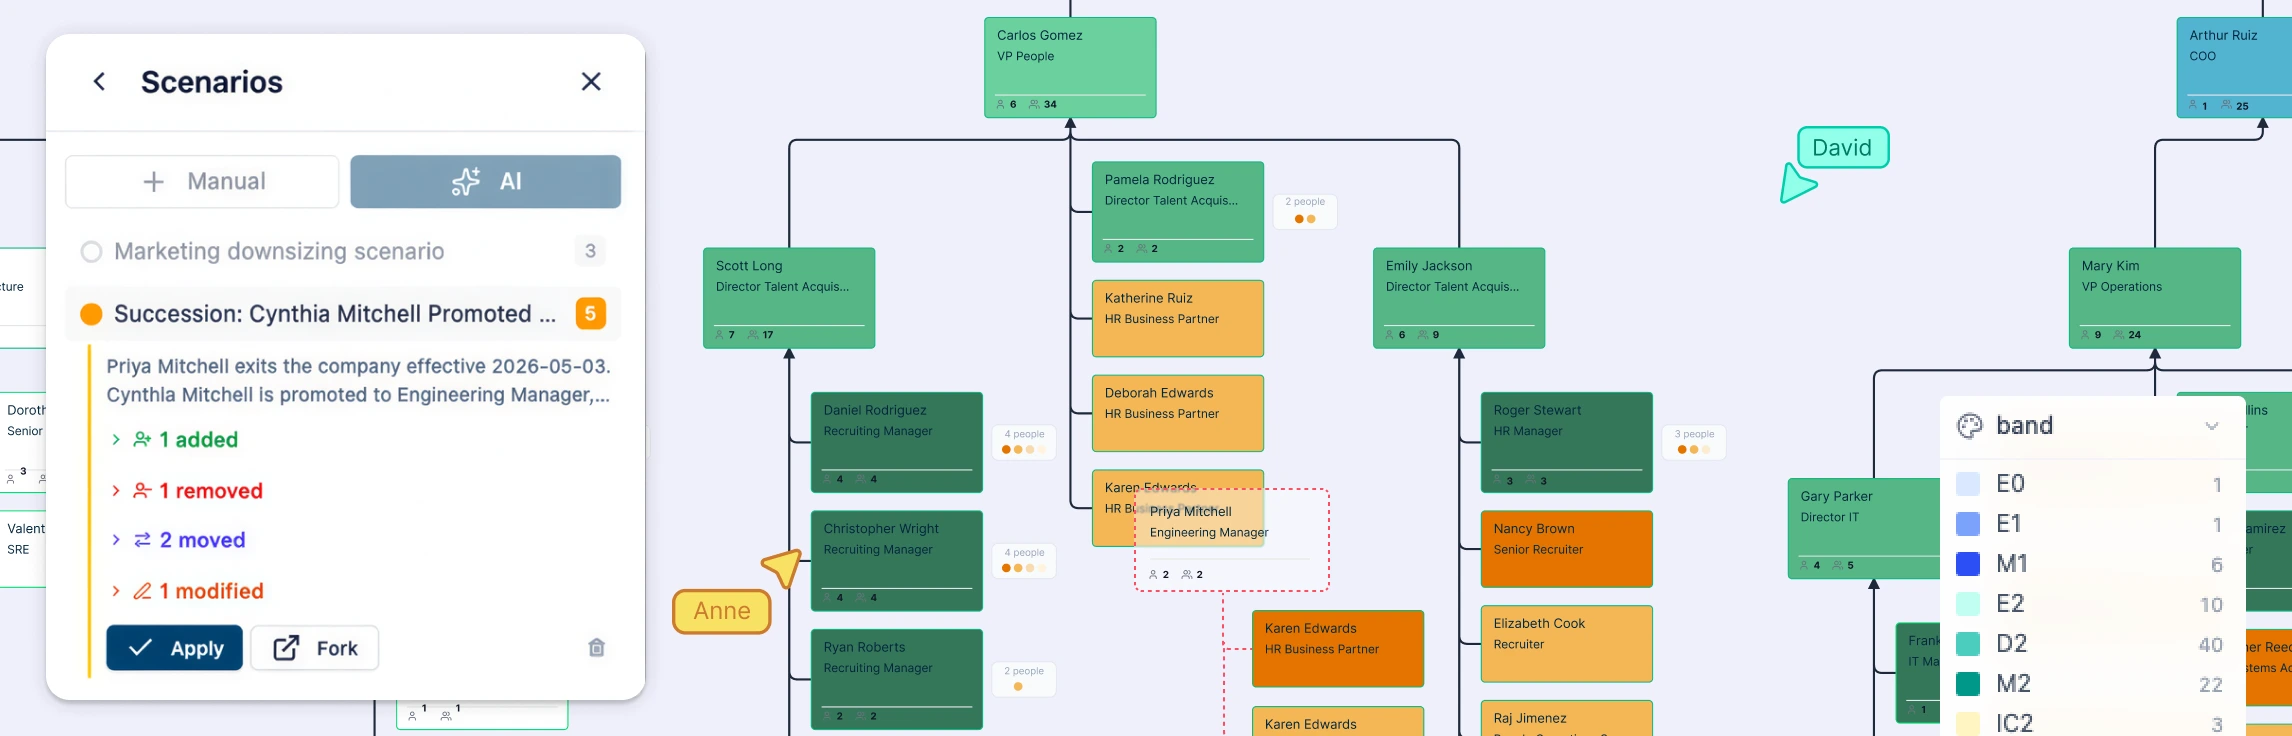
Scenario Planning Without Risk to the Live Organization
Named “what‑if” scenarios and undoable changes allow integration teams to test alternatives safely. Live structures remain untouched until decisions are finalized.
Scales From Integration Teams to the Boardroom
Org charts can be filtered, focused, and exported for different audiences, from detailed integration work to executive and board‑level communication, making them a shared reference point throughout the process.
Free M&A Org Chart Templates to Get Started


FAQs About Using Org Charts for Mergers and Acquisitions
Can org charts support temporary or dual reporting after a merger?
How should org charts be used to assess redundancy during M&A integration?
How are M&A org charts different from standard organizational charts?
Can org charts be used before the deal is finalized?
References
Horowitz, Richard E., et al. “How to Evaluate a Potential Merger or Acquisition.” Archives of Pathology & Laboratory Medicine, vol. 137, no. 12, Dec. 2013, pp. 1811–1815, https://doi.org/10.5858/arpa.2012-0698-sa.
Marks, Mitchell Lee, and Philip H Mirvis. “Managing Mergers, Acquisitions, and Alliances: Creating an Effective Transition Structure.” Organizational Dynamics, vol. 28, no. 3, 2000, pp. 35–47, https://doi.org/10.1016/s0090-2616(00)88448-x.