When it comes to planning projects, keeping everything on track can feel like juggling flaming torches—exciting, but a little terrifying. That’s where the right visual tools come in. Some projects need a high-level overview to show milestones at a glance, while others demand detailed tracking of tasks, deadlines, and dependencies. Picking the right approach can make the difference between smooth execution and constant fire-fighting. In this guide, we’ll break down the key differences between a Gantt chart and timeline, show when each shines, and help you choose the perfect tool to plan, track, and impress your team.
What Is a Gantt Chart?
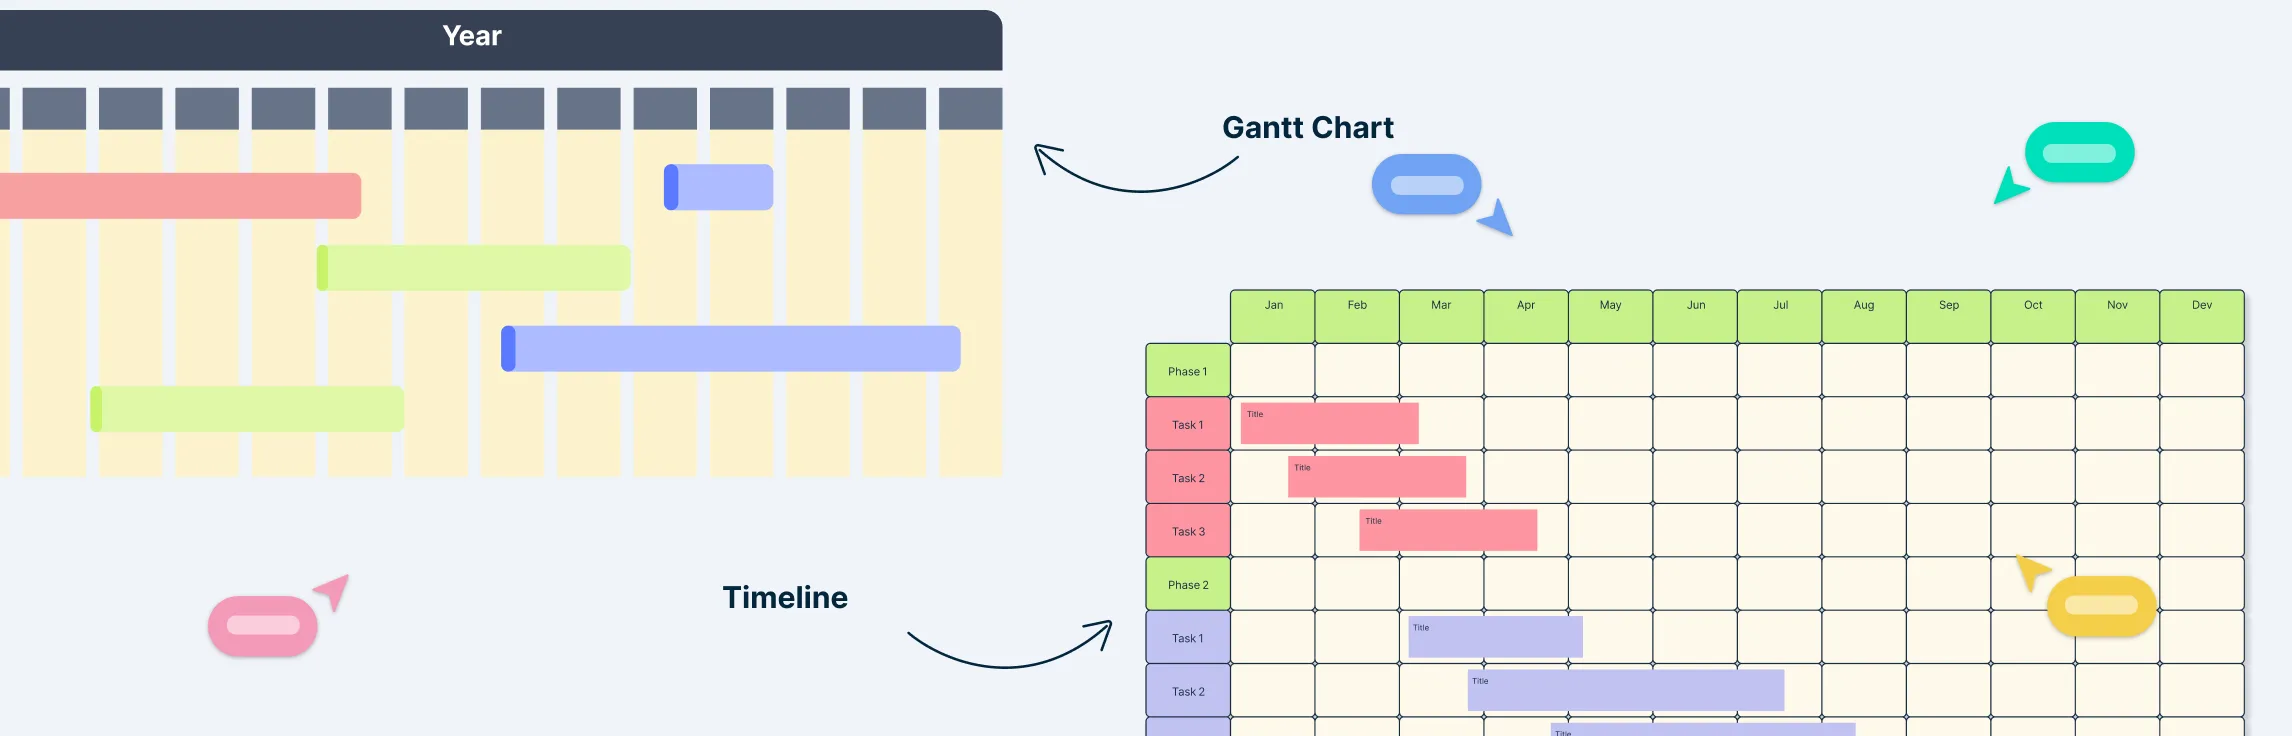
Gantt charts have been around for over a century, thanks to Henry Gantt, who knew a thing or two about keeping complex projects on track. At their core, these charts map out tasks over time, showing not just what needs to be done, but when—and how everything connects.
Core components of a Gantt chart include:
Tasks: Every step that needs to be completed
Durations: How long each task will take
Dependencies: How tasks relate and which ones rely on others
Milestones: Key achievements or checkpoints
Resource assignment: Who’s responsible for what
Together, these elements create a visual command center for your project:
Spot overlapping tasks and bottlenecks instantly
Track progress at a glance
Keep the team aligned on priorities and deadlines
Typical uses in project management:
Planning: Map out every task before the work begins
Scheduling: Set deadlines and visualize overlaps
Tracking: Monitor progress and adjust timelines as needed
With a Gantt chart, what could feel like chaos becomes clarity—and your team always knows exactly where the project stands.
What Is a Timeline?
A timeline is all about seeing the big picture at a glance. It’s a linear, chronological representation of events or milestones that keeps things simple and easy to follow.
Key features of a timeline:
Simplicity: Focuses on clarity rather than detailed tasks
Milestone emphasis: Highlights major events, deadlines, or achievements
Chronological view: Shows how things unfold over time, step by step
Common use cases:
High-level planning: Perfect for visualizing phases of a project without getting bogged down in tasks
Stakeholder updates: Share progress and key dates with executives or clients in a clean, digestible format
Presentations: Great for slides, reports, or roadmaps where a clear, simple view is needed
Timelines are ideal when you want a quick, visually appealing overview that tells the story of your project without diving into the nitty-gritty details.
Key Differences: Gantt Chart vs Timeline
Gantt charts and timelines might look similar at first glance, but they serve very different purposes. Choosing the right one can save you hours of confusion, keep your team on track, and make stakeholders actually enjoy reading your project plan.
| Feature / Aspect | Gantt Chart | Timeline | Notes / When to Use |
| Level of detail | Task-level details, durations, and dependencies | High-level milestones and events | Gantt is best for detailed planning; timeline for big-picture overview |
| Dependencies & relationships | Shows task dependencies clearly | Usually does not show dependencies | Use Gantt to track linked tasks; timeline for sequential overview |
| Complexity | More complex and detailed | Simple and easy to understand | Gantt can be overwhelming for large projects; timeline is presentation-friendly |
| Time scale & granularity | Can display days, weeks, months, or even hours per task | Broad overview, often only major dates or phases | Gantt is flexible for precise scheduling; timeline for milestone tracking |
| Interactivity | Interactive: update tasks, drag-and-drop, adjust durations | Often static | Gantt ideal for active project tracking; timeline ideal for reports or slides |
| Progress tracking | Shows percentage completion of tasks | Usually does not track progress | Gantt helps monitor ongoing work; timeline focuses on key dates |
| Critical path / project control | Identifies bottlenecks and critical tasks | Focuses on chronological order only | Gantt useful for managing risks and timelines; timeline for communicating milestones |
| Resource assignment | Can assign tasks to team members | Rarely shows resource allocation | Gantt is better for resource-heavy projects; timeline is simpler for visualization |
| Use cases | Planning, scheduling, tracking, resource management | Stakeholder updates, presentations, high-level planning | Choose based on audience and project complexity |
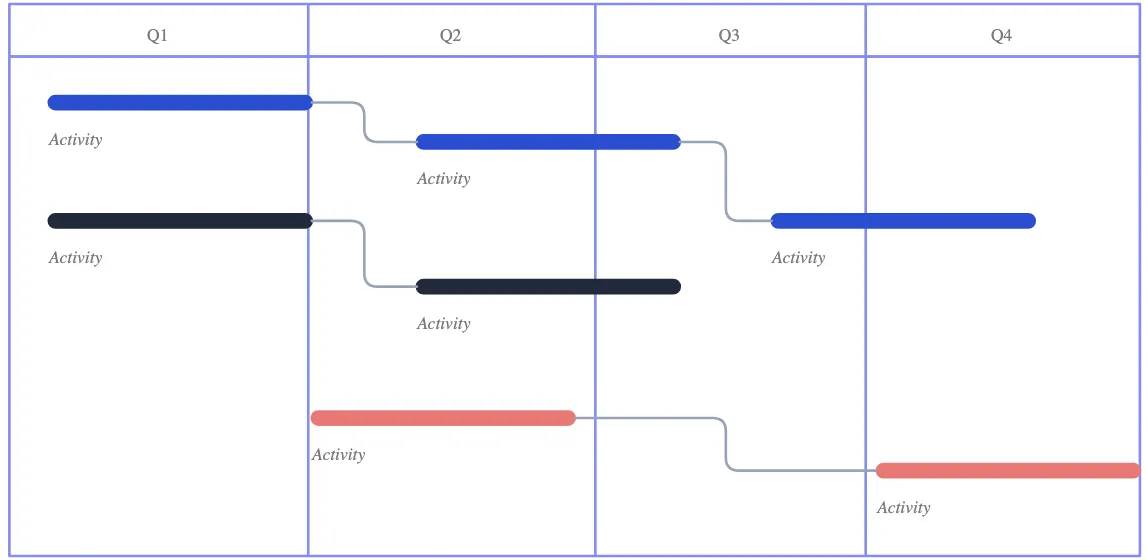
| Visual style | Bars along a time axis with overlapping tasks | Linear or chronological layout of events/milestones | Gantt emphasizes overlaps; timeline emphasizes sequence |
| Importance | Essential for detailed execution, risk management, and keeping teams aligned | Crucial for communicating milestones, project phases, and high-level progress | Gantt is key for managing day-to-day project tasks; timeline is important for keeping stakeholders informed and aligned |
Pros and Cons of Timelines and Gantt Charts
Before you dive in, it helps to see the good, the tricky, and the trade-offs of timeline vs Gantt chart at a glance.
| Feature | Gantt Chart | Timeline |
| Pros |
|
|
| Cons |
|
|
Gantt Chart and Timeline: When to Use Each
Gantt Chart
When to create a Gantt chart;
Ideal for detailed project planning where every task, duration, and dependency needs to be mapped out.
Perfect for allocating resources, tracking workloads, and balancing team responsibilities.
Essential for monitoring progress, updating tasks, and adjusting schedules in real time.
Crucial for complex projects with interlinked tasks and critical path analysis.
Great for interactive project management—drag-and-drop updates, baseline tracking, and dynamic adjustments.
Timeline
When to create a timeline;
Best for giving stakeholders a clear, high-level overview of key milestones and events.
Excellent for project roadmaps, showing phases or strategic timelines without overwhelming detail.
Perfect for executive updates, client presentations, or reporting where simplicity and visual appeal matter.
Ideal for a quick snapshot of progress or milestones without diving into task-level details.
Works well when you need a chronological, easy-to-read view of the project’s big picture.
How to Use Gantt Charts and Timelines to Plan Your Project
Step 1: Start with the big picture (Timeline)
Map out major milestones, key deadlines, and phases of your project.
Keep it simple—focus on what needs to happen and when.
Use this high-level view to align stakeholders and get quick buy-in.
Step 2: Break it down into tasks (Gantt Chart)
Take each milestone from your timeline and break it into actionable tasks.
Assign durations, dependencies, and responsible team members.
Visualize overlaps and sequence tasks to prevent bottlenecks.
Step 3: Allocate resources and responsibilities
Use the Gantt chart to see who’s working on what and when.
Adjust workloads to balance team capacity.
Identify potential resource conflicts before they become a problem.
Step 4: Track progress and adjust
Update task completion percentages in your Gantt chart regularly.
Shift timelines or reassign resources as needed to stay on track.
Use your timeline to communicate progress to stakeholders in a clean, visual way.
Step 5: Combine for maximum clarity
Use the timeline for high-level updates and presentations.
Use the Gantt chart for detailed planning, scheduling, and execution.
Together, they give you both control and clarity over your project from start to finish.
Helpful Resources
Professionally designed Gantt chart templates available in the Creately diagramming community.
Learn how to use Gantt charts to plan projects, why they are useful and how to effectively use them in a project.
Everything you need to know on how to make a timeline. From gathering your information to choosing the right layout and styling your timeline for impact.
Learn how to build a clear, easy-to-follow project timeline from scratch, choose the right format, and use ready-made templates to get started fast.
Discover 15 different types of timelines and how to use them effectively for projects, history, education, or personal planning.
Turn complex timelines into clear, actionable plans. With Creately’s vertical timeline template, track projects, events, and milestones from start to finish—all in a single, intuitive view.
Free Timeline and Gantt Chart Examples
Looking for inspiration? Here are ready-made timeline and Gantt chart examples you can use to plan, track, and present your projects with ease.
Free Timeline templates
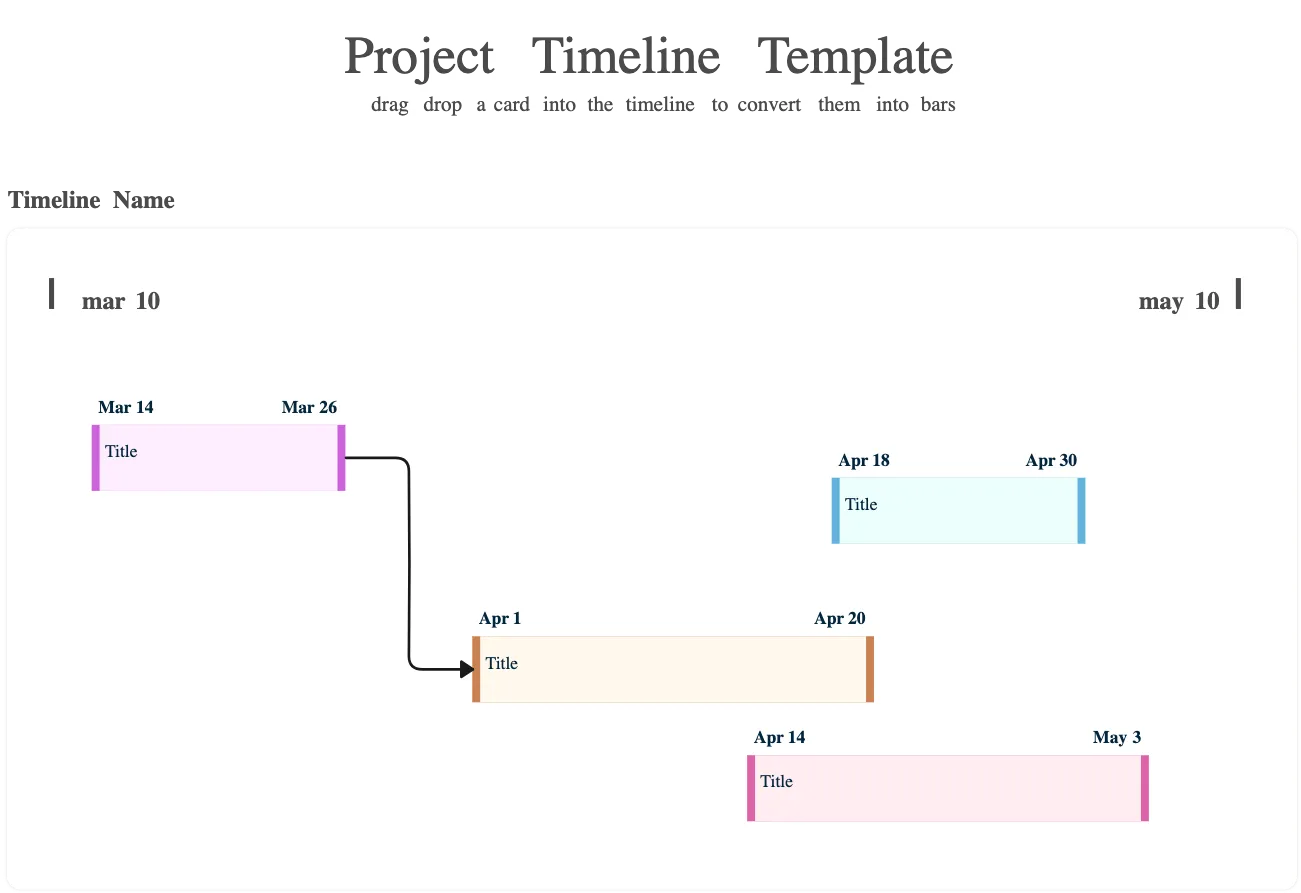
Project Timeline Template


Horizontal Timeline Template

Monthly Timeline Template

Event Planning Timeline Template

Free Gantt chart templates
Gantt Chart Template

Strategic Planning Gantt Chart

Colored Gantt Chart Example

Gantt Chart for Company Audit

FAQs About Gantt vs Timeline
Are there similarities between a Gantt chart and a timeline?
Can you use a Gantt chart as a timeline?
What is a Gantt timeline?
What is a project timeline?
Can you convert a project timeline into a Gantt chart?
Which tool is best to create a timeline and Gantt schedule?