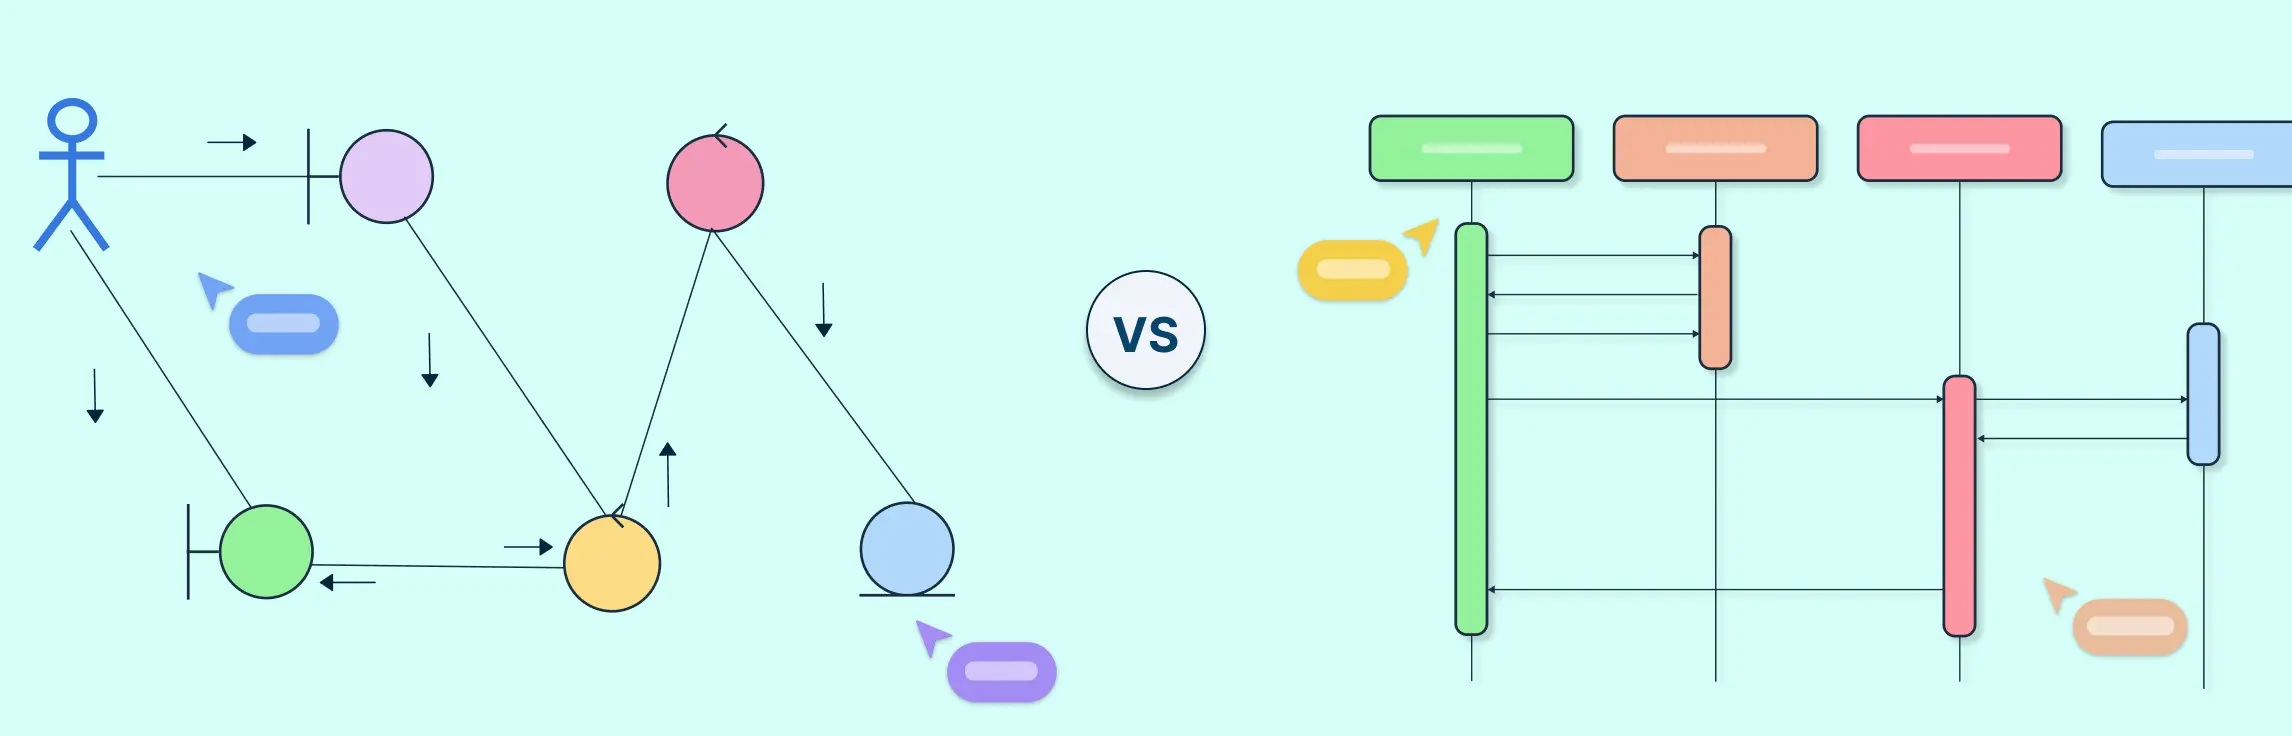
In UML, sequence and communication diagrams both show how objects interact within a system, but they do so from different perspectives. A sequence diagram focuses on the order of messages over time, while a communication diagram emphasizes the relationships and message flow between objects. This guide explains their key differences, when to use each, and how they work together to model system behavior effectively.
Sequence Diagram Definition
A sequence diagram is a type of UML interaction diagram that shows how objects or components in a system communicate with each other over time. It focuses on the order of messages and the interactions needed to complete a specific process or use case. Think of it as a visual timeline of system behavior.


Explore more sequence diagram templates in Creately.
Key Components
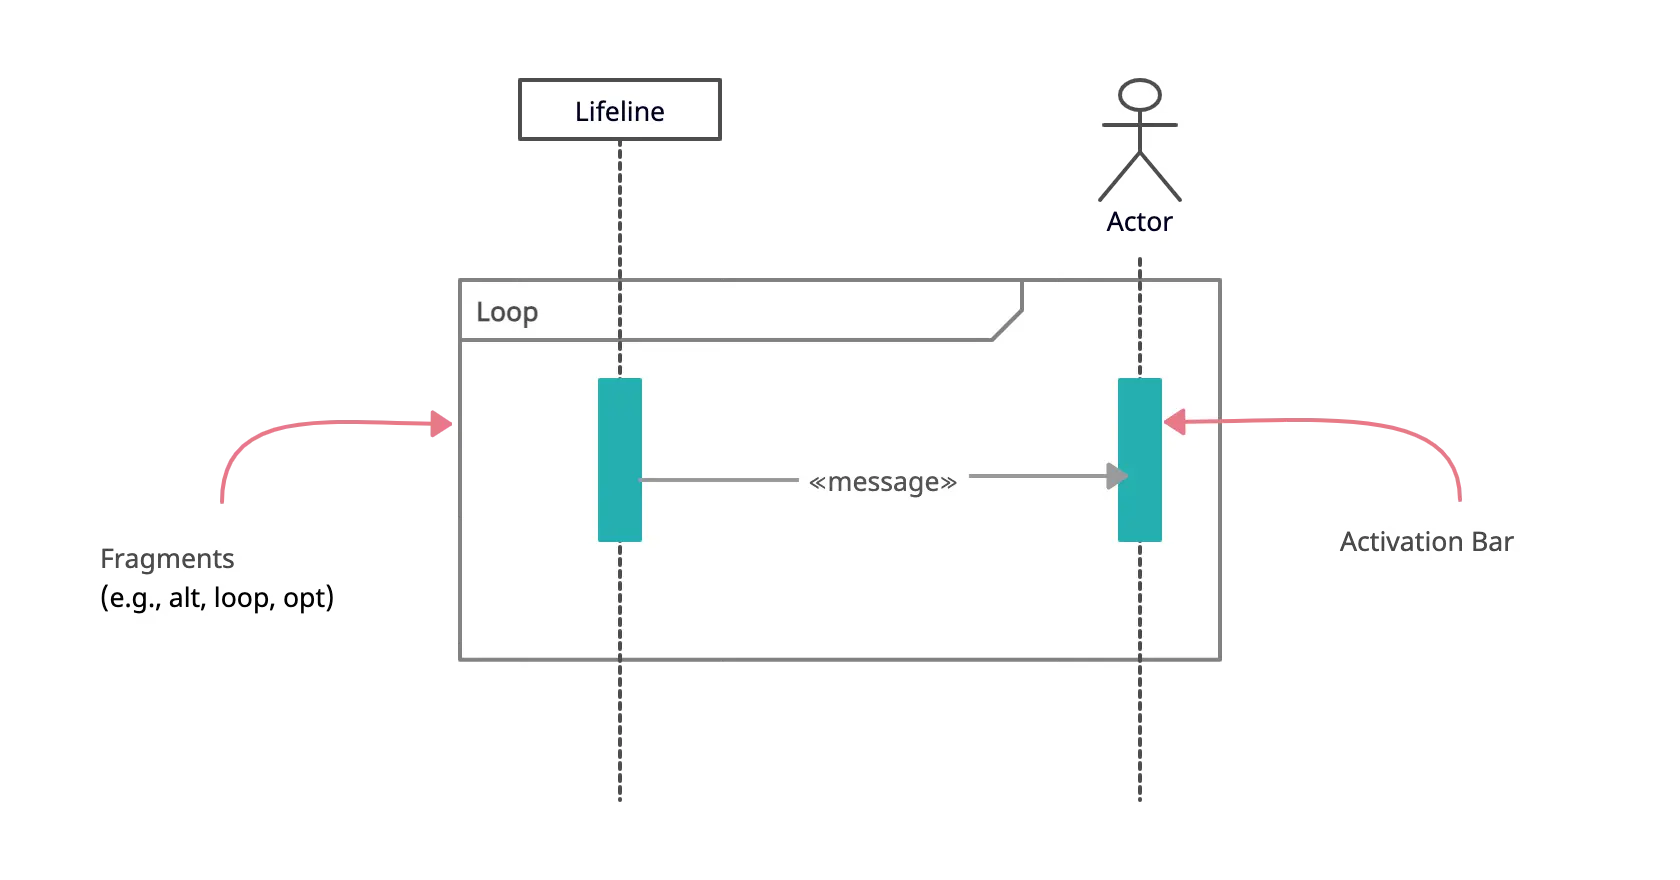
Actors: Represent users or external systems interacting with your system. Shown as stick figures or labeled icons.
Objects/Participants: The system components or classes involved in the interaction, represented as rectangles at the top of the diagram.
Lifelines: Vertical dashed lines extending from each object or actor, showing their existence over time.
Messages: Arrows between lifelines that represent communication, actions, or method calls. Can be synchronous, asynchronous, or return messages.
Activation Bars (Execution Specifications): Narrow rectangles on a lifeline that show when an object is active or performing an action.
Fragments (Optional): Boxes used for modeling conditional flows, loops, alternatives, or parallel actions (e.g., alt, loop, opt).
This structure helps teams clearly see who does what, in what order, making it easier to understand, design, and debug system processes.
What Is Communication Diagram
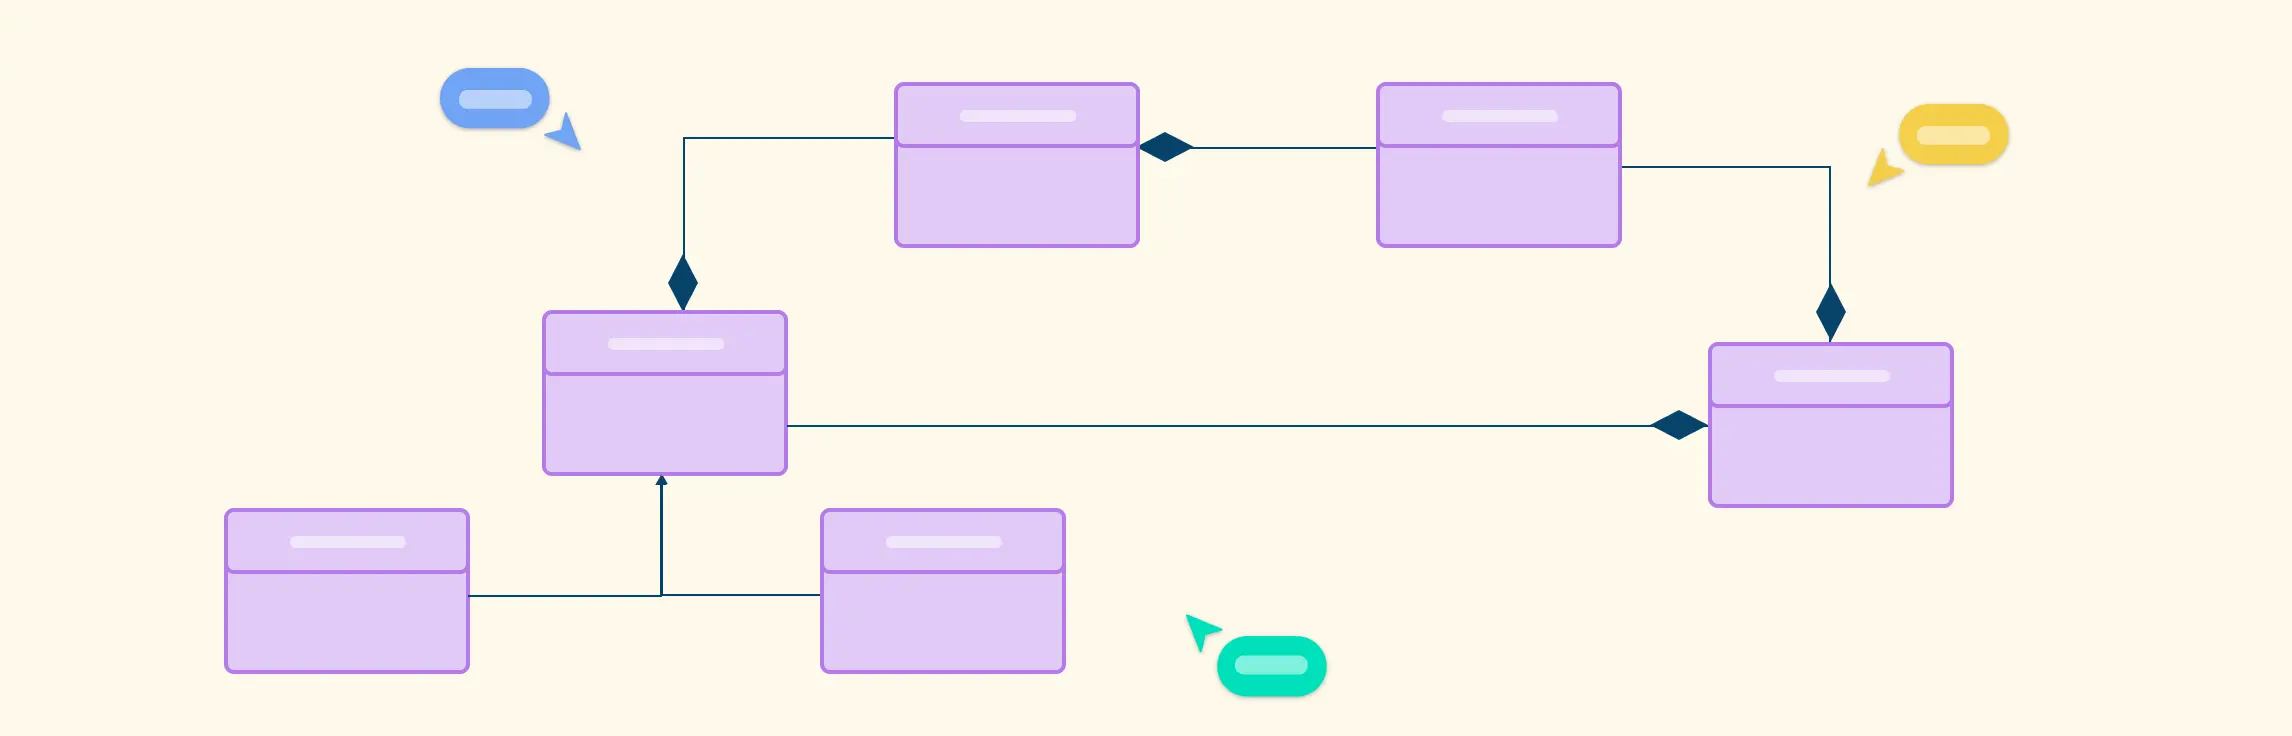
A communication diagram (also called a collaboration diagram) is a type of UML interaction diagram that shows how objects or components in a system are connected and how they exchange messages. Unlike sequence diagrams, it focuses on relationships and links between objects rather than the exact order of events over time. Think of it as a map of interactions.

Key Components:
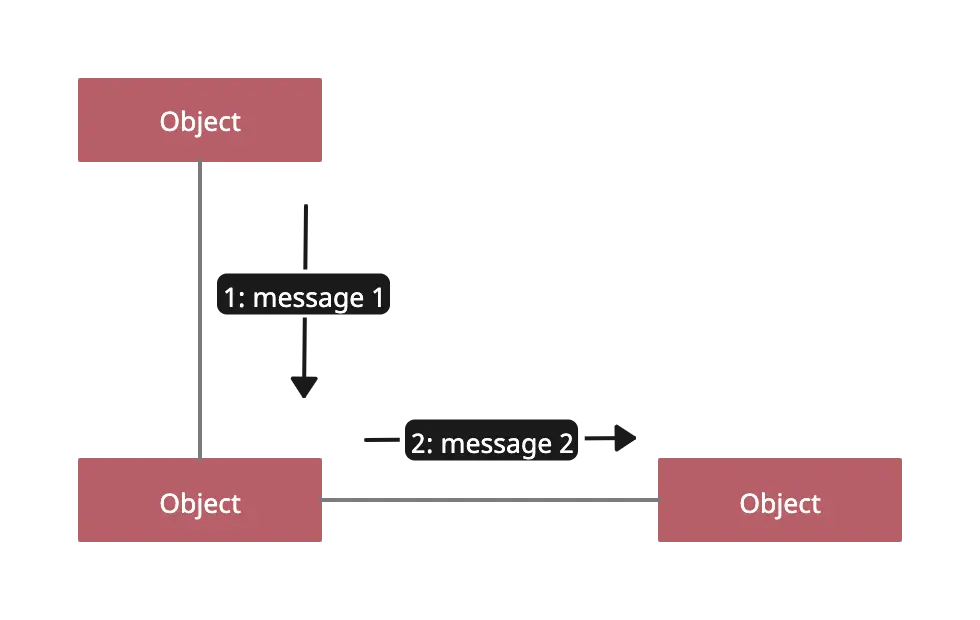
Objects/Participants: The components, classes, or instances involved in the interaction, usually shown as rectangles with the object name and class.
Links: Lines connecting objects, representing relationships or communication paths.
Messages: Numbered arrows along the links showing the flow of messages between objects. The numbers indicate the sequence in which messages are sent.
Message Types: Can include synchronous calls, asynchronous calls, and returns, similar to sequence diagrams.
Roles & Multiplicity (Optional): Indicate the role of an object in the interaction and how many instances are involved in the relationship.
Communication diagrams are great for seeing the big picture of who interacts with whom, understanding dependencies, and analyzing the structure of a system’s interactions without focusing too heavily on timing.
Difference Between Sequence Diagram and Communication Diagram
While sequence diagrams and communication diagrams both model interactions in a system, they do so from different perspectives and are suited for different purposes. Understanding their differences can help you choose the right diagram for your project.
| Aspect | Sequence Diagram | Communication Diagram |
| Primary Focus | Emphasizes order of messages over time; shows step-by-step interactions. | Emphasizes relationships and links between objects; shows who communicates with whom. |
| Layout | Horizontal placement of objects at the top; vertical timeline flows downward. | Objects arranged spatially to highlight connections; message numbers indicate sequence. |
| Message Representation | Arrows show messages, synchronous/asynchronous calls, returns; activation bars show processing time. | Numbered arrows on links show message order; activation bars optional. |
| Best Use Cases | Detailed process flows, use case modeling, debugging, method calls. | High-level overview of object interactions, system topology, or component relationships. |
| Readability & Tradeoffs | Clear temporal flow; easy to trace sequence of events; can become cluttered with many objects/messages. | Clear overview of object relationships; easier to visualize complex networks; temporal order is less explicit. |
| Conditional & Iterative Flows | Supports alt, loop, opt, par fragments for branching or parallel actions. | Typically shows linear interactions; less focused on conditions or loops. |
| Temporal Information | Explicitly shows timing, order, and duration of actions. | Sequence is implied by numbered messages; less clear about timing. |
| Practical Guidance / Key Cues | Use when exact timing, activation, or order is critical. | Use when relationships and message paths are the focus. If a communication diagram has heavily numbered messages, it often signals that a sequence diagram would be clearer. |
| Semantic Equivalence | Can represent the same interactions as a communication diagram but focuses on time. | Can represent the same interactions as a sequence diagram but focuses on space/relationships. |
UML Communication Diagram vs Sequence Diagram: When to Use Which
Choosing between creating a sequence diagram or communication diagram depends on what you want to emphasize in your system interactions. Here’s a practical guide:
Use a sequence diagram when;
You need to show the exact order of messages between objects.
Understanding timing, lifetimes, or activation of components is important.
You want to model loops, conditions, or parallel flows using fragments like
alt,loop, orpar.Debugging or tracing a use case step by step is required.
You have short to medium interactions with clear start and end points.

Use a communication diagram when;
You want to see all object relationships and how components are connected.
Focusing on system topology or architecture rather than precise timing.
You need a high-level overview of interactions in a complex network.
The diagram helps analyze dependencies, coupling, or message paths.
Interactions are simple and don’t require detailed branching or loops.

Tip: If your communication diagram has heavily numbered messages or the sequence becomes hard to follow, it’s usually a sign that a sequence diagram would communicate the flow more clearly.
How to Convert a Communication Diagram into a Sequence Diagram
Step 1: List all objects or participants
Look at your communication diagram and write down all the objects (e.g., User, Client, Server).
These objects will appear as lifelines in the sequence diagram (vertical lines showing the existence of each object).
Step 2: Check the message numbers
Communication diagrams usually have numbers on the arrows showing the order of messages (1, 2, 3…).
If your diagram doesn’t have numbers, decide the logical order of interactions first.
Step 3: Draw lifelines horizontally
At the top of your sequence diagram, place each object from left to right.
Draw a vertical dashed line (lifeline) under each object.
Step 4: Draw messages in order
Take each numbered message from the communication diagram and draw it as an arrow from sender to receiver along the lifelines.
Read top to bottom in order: first message at the top, last message at the bottom.
Use solid arrows for calls, dashed arrows for return messages.
Step 5: Add activation bars (optional but helpful)
Draw a narrow rectangle along the lifeline of an object while it is processing a message.
This shows when the object is “active” doing something.
Step 6: Add loops or conditions if needed
For repeated actions or optional flows, use fragments like
loop,alt, oropt.This is optional for beginners but useful for more complex processes.
Step 7: Check your sequence
Make sure all messages from the communication diagram appear in the sequence diagram.
Verify that the top-to-bottom flow makes sense.
Example:
Communication diagram:
User → Client → Server → Client → User
Messages numbered 1 to 4

Sequence diagram conversion:
Draw lifelines for User, Client, Server horizontally.
Message 1: User sends request to Client (arrow from User → Client)
Message 2: Client sends request to Server (arrow from Client → Server)
Message 3: Server responds to Client (arrow from Server → Client)
Message 4: Client responds to User (arrow from Client → User)

Now you can see the exact order of actions over time clearly.
FAQs About Sequence Diagram and Communication Diagram
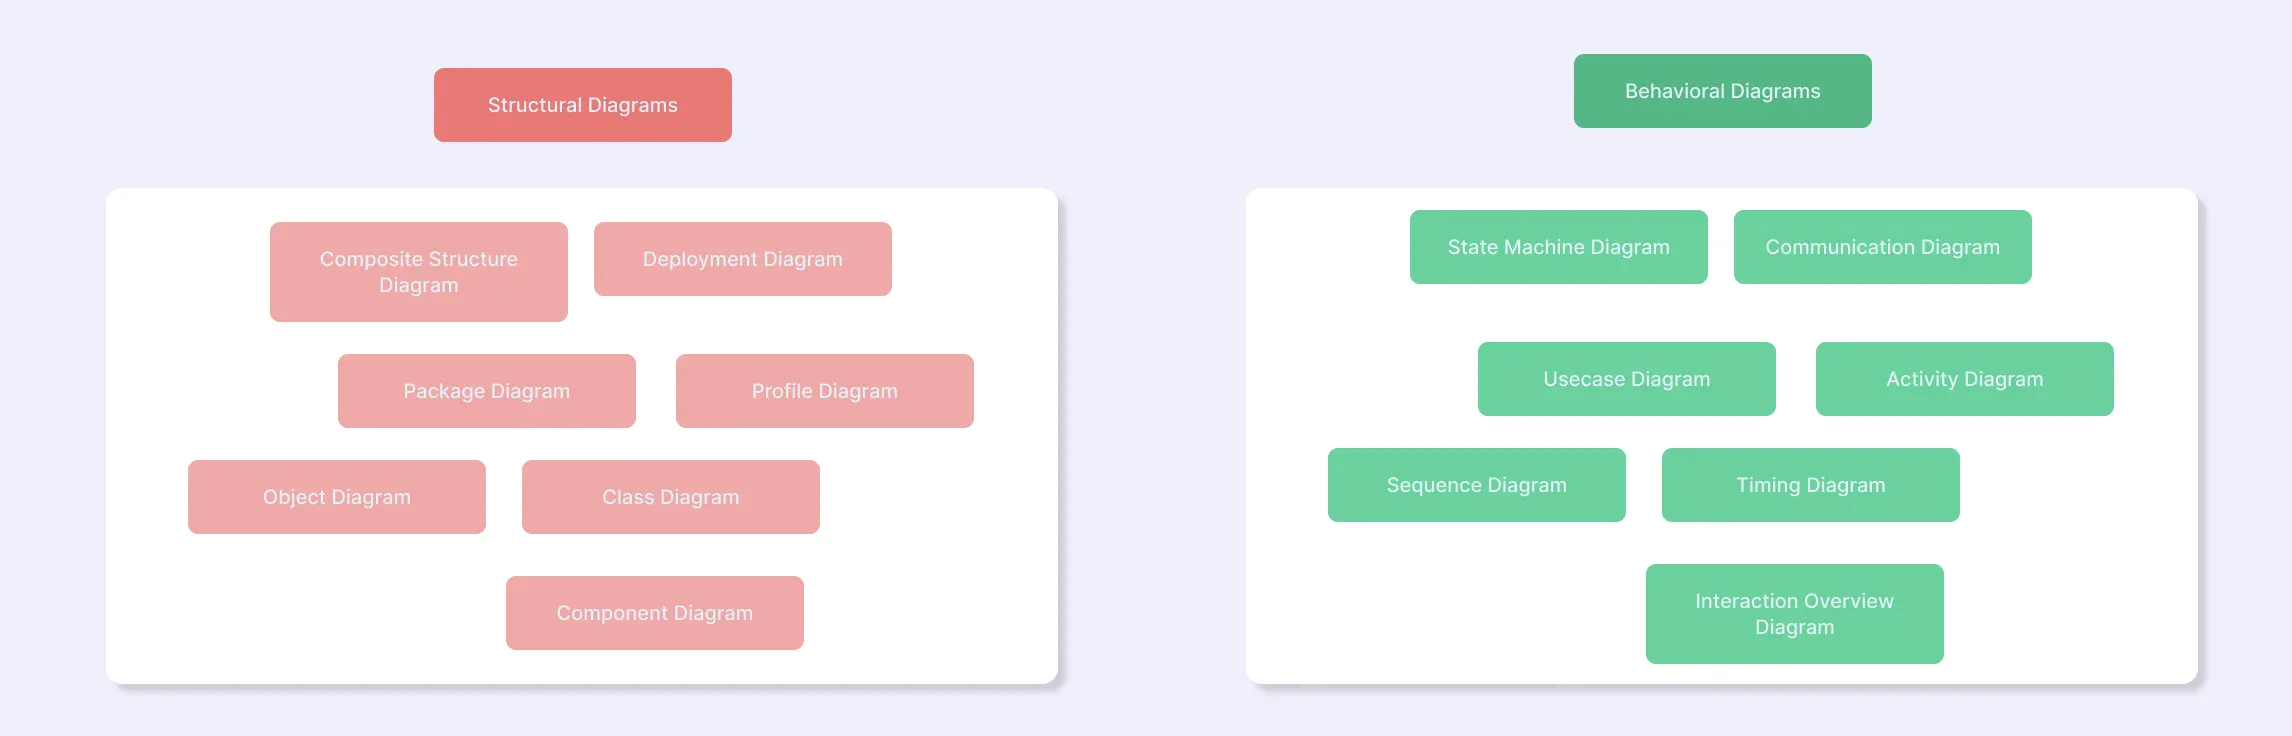
What are UML interaction diagrams?
Are sequence and communication diagrams interchangeable?
Which diagram is better for beginners?
Can I use both diagrams for the same process?
When should I switch from a communication diagram to a sequence diagram?
Which diagram should I use for modeling object interactions?
What is the best tool to create communication and sequence diagrams?