The BCG Matrix, developed by the Boston Consulting Group, is a strategic tool used for analyzing a company’s portfolio of products or business units. This matrix helps in understanding the balance between products that generate cash and those that require investment to grow, guiding strategic decision-making. This guide includes 19 real-world Boston matrix examples to illustrate how businesses apply it in practice.
Purpose and Benefits of the BCG Matrix
- Strategic business analysis: The BCG Matrix is primarily used to analyze the strategic positioning of business units and products within the broader market context. It assists in identifying where resources should be allocated to maximize profitability and market share.
- Assessing product lines: By categorizing products or business units into one of the four distinct quadrants, companies can better understand the performance and potential of each unit, making it easier to decide on investment, development, or divestment.
- Market share and growth analysis: The matrix provides insights into market dynamics, helping companies to strategize based on the relative market share and growth rates of their products. This is crucial for maintaining a balanced product portfolio that supports sustainable growth.


19 Real World BCG Examples
Understanding the practical application of the BCG Matrix can be significantly enhanced by examining how leading companies utilize this strategic tool. Let’s dive into some real-world BCG Matrix examples from various industries to illustrate how businesses leverage market share and growth analysis to inform strategic decisions.
1. BCG Matrix Example - Companies Template
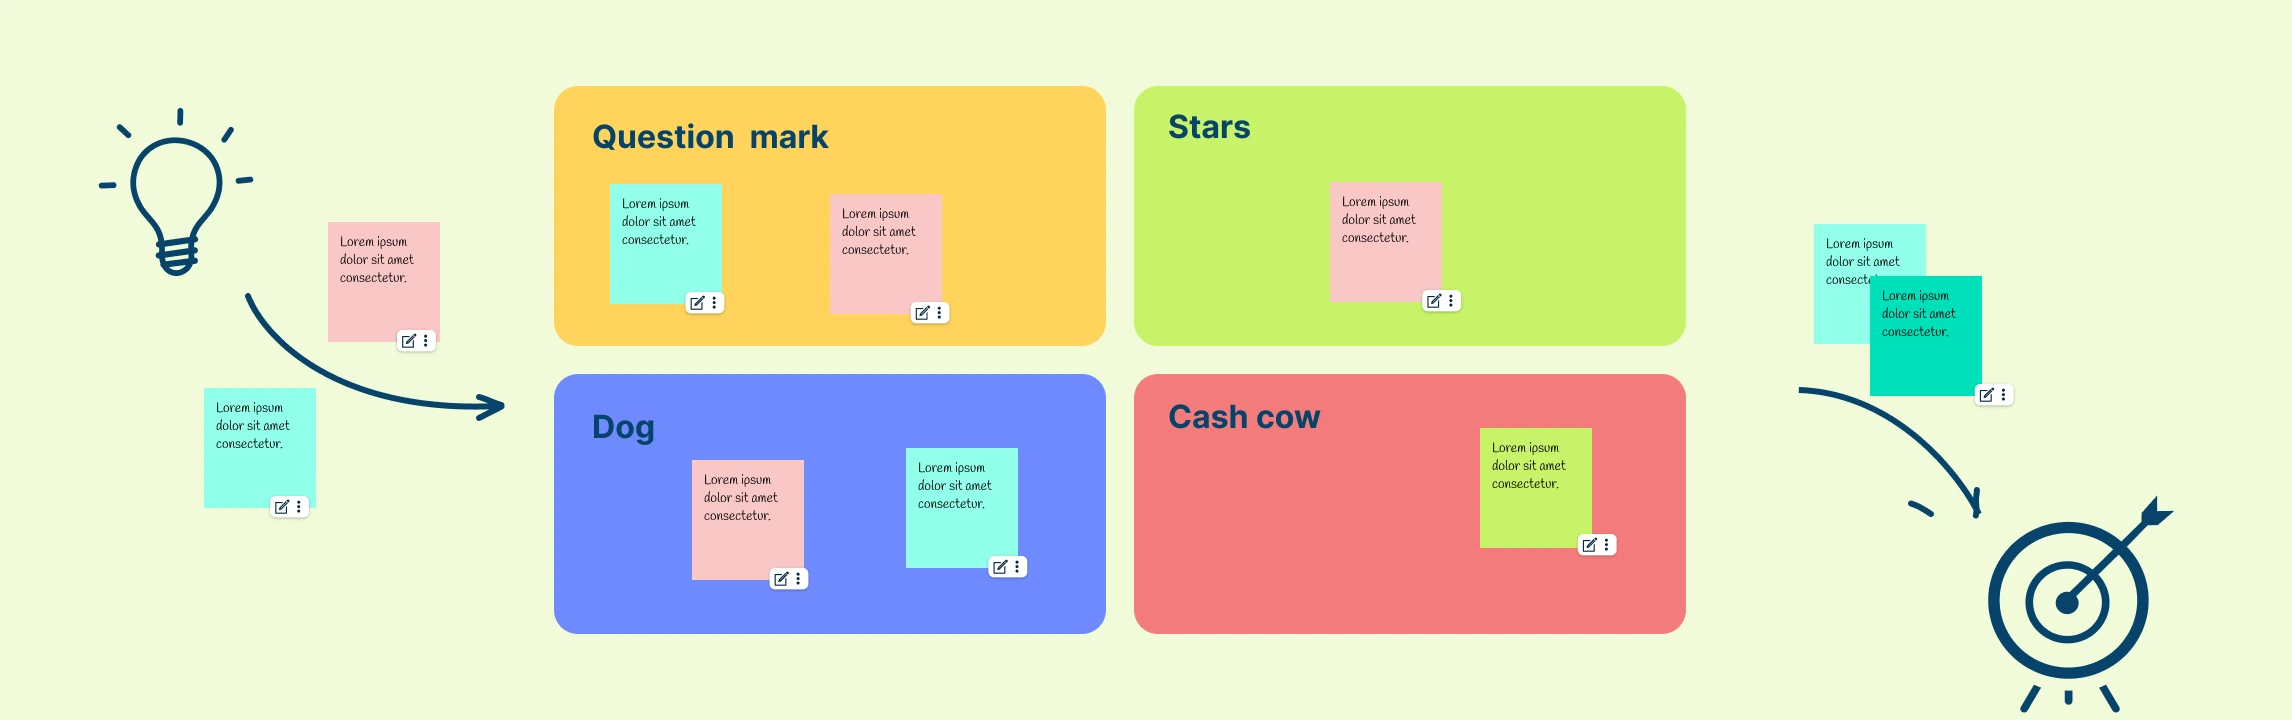
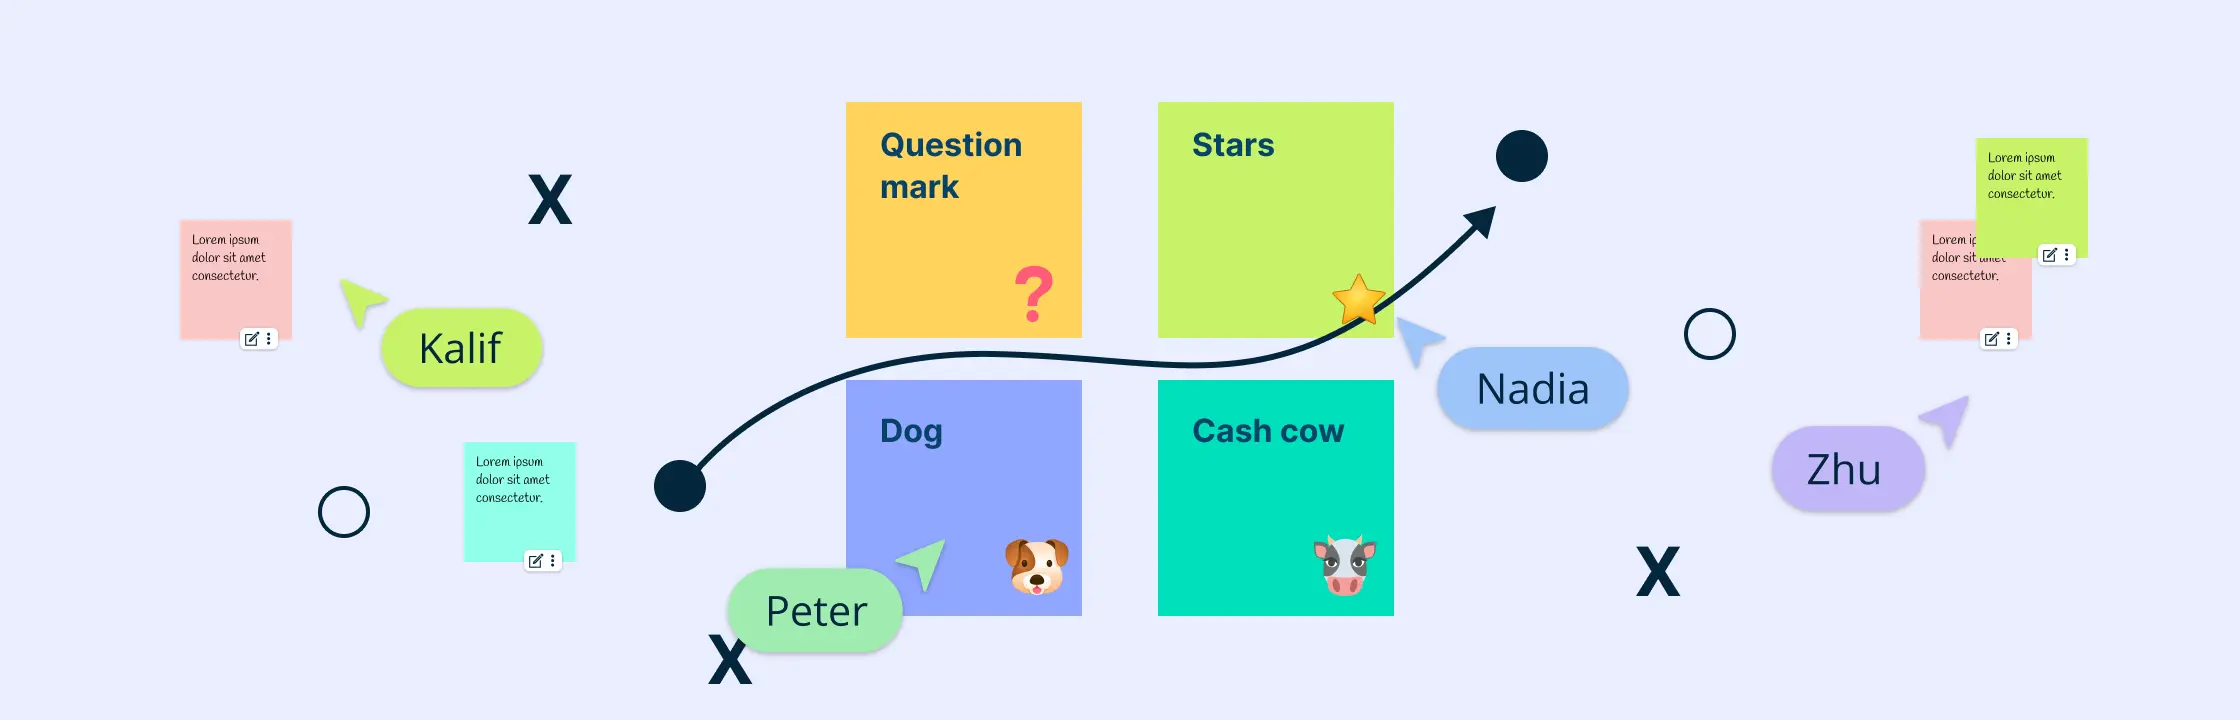
Before we delve into specific company examples of BCG matrix in practice, let’s take a moment to understand the structure of the BCG matrix. This blank template for BCG matrix example - companies serves as a visual representation of the four quadrants: Stars, Question Marks, Cash Cows, and Dogs. It provides a framework for evaluating products or business units based on their relative market share and market growth rate. Use the dots to represent companies, products or services and drag and drop them on the grid to position them correctly.

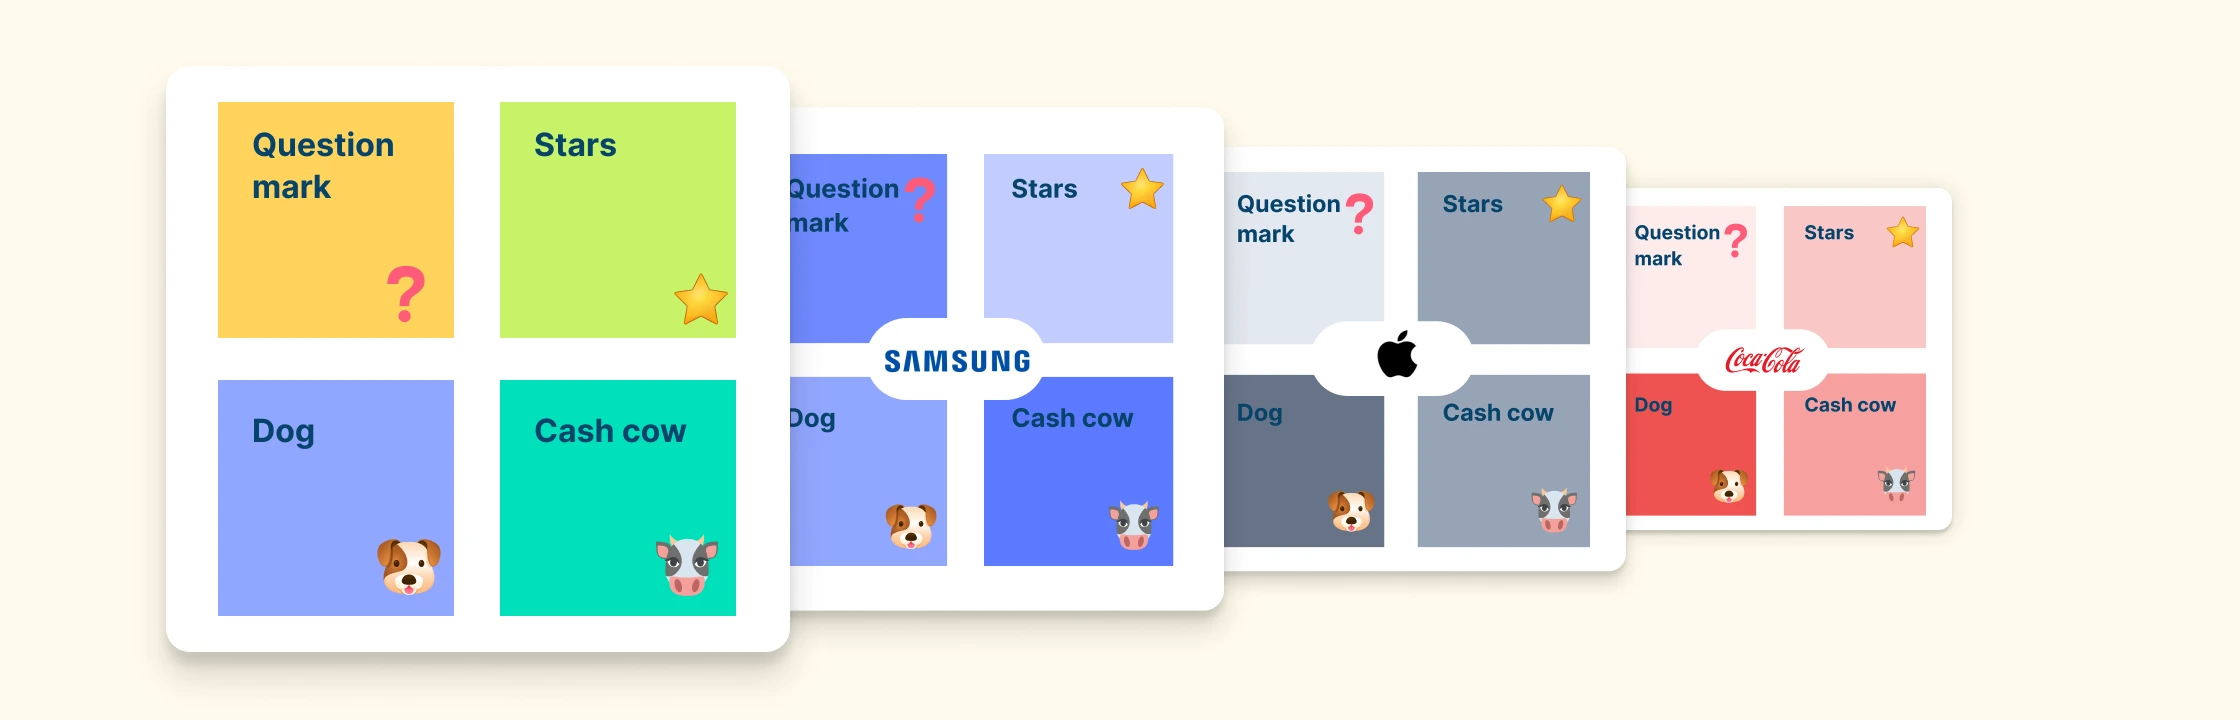
2. BCG Matrix Example of Samsung
Samsung, a global leader in electronics, provides an intriguing example of BCG Matrix in action. With a diverse portfolio across smartphones, appliances, and semiconductors, Samsung’s BCG Matrix guides strategic focus. Galaxy S series and semiconductors are Cash Cows, driving steady profits, while foldables and smart wearables are Stars with high growth potential. Low-performing mid-range appliances fall under Dogs, prompting reevaluation or exit.

3. BCG Example for Tesla Motors
Tesla Motors, known for its innovative electric vehicles and renewable energy solutions, demonstrates this dynamic nature through its example of BCG Matrix analysis. As a disruptor in the automotive industry, Tesla’s products initially fell into the Question Marks quadrant but rapidly evolved into Stars as market demand surged and technology advanced.

4. BCG Matrix Example for Apple
Apple, renowned for its iPhones, iPads, and MacBooks, showcases the transition of products through various stages of its BCG matrix example. While flagship products like the iPhone may have started as Stars, they eventually mature as Cash Cows, contributing to Apple’s sustained profitability and market dominance. Emerging innovations like the Apple Vision Pro or Apple TV+ represent Question Marks, with growth potential but uncertain long-term market share.

5. Amazon BCG Matrix Example
Amazon’s vast ecosystem of e-commerce, cloud computing, and digital streaming services offers a fascinating example of BCG matrix analysis. By strategically analyzing different business segments, Amazon identifies growth opportunities (Stars), allocates resources efficiently, and maximizes profitability across its portfolio. AWS, as a dominant cloud provider in a high-growth market, serves as a clear Star, while its core e-commerce operations in mature markets function as Cash Cows.

6. BCG Matrix of McDonalds
One of the best BCG examples is that of McDonald’s, the global fast-food giant. Their example illustrates how the BCG Matrix informs strategic decisions in the food and beverage industry. With iconic products like the Big Mac, French Fries, and Happy Meal serving as Cash Cows, and high-growth offerings like the McCafé range and McPlant burger positioned as Stars, McDonald’s maintains a balanced portfolio while managing underperforming items like Snack Wraps or discontinued regional items (Dogs) through menu innovation and strategic repositioning.

7. BCG Matrix of HUL (Hindustan Unilever)
India’s largest FMCG is the subsidiary of Unilever, known locally as HUL. They utilize the BCG Matrix to optimize its brand portfolio. Through strategic divestments, acquisitions, and product innovation, Hindustan Unilever ensures a healthy mix of Cash Cows like Lifebuoy, Surf Excel, and Pond’s, and Stars such as Dove and Pureit, while minimizing exposure to underperforming brands like Axe deodorants or discontinued SKUs that fall under Dogs.

8. BCG Matrix of Coca-Cola
Coca-Cola, a beverage industry leader, has one of the most compelling BCG examples. The company leverages its strong brand to sustain iconic products while adapting to shifting consumer preferences and market dynamics. Products like Coca-Cola Classic serve as Cash Cows, while new launches in health-focused beverages often fall under Question Marks, guiding investment and innovation decisions.

9. BCG Matrix Example for KFC
KFC, a leading fast-food chain specializing in fried chicken, is a great example of BCG Matrix used to evaluate its menu offerings and geographic expansion. By identifying high-growth products like plant-based chicken options and spicy chicken innovations (Stars), and optimizing best-sellers such as Original Recipe chicken and Zinger burgers (Cash Cows), KFC sustains its competitive advantage and adapts to evolving consumer preferences.

10. BCG Matrix of Nestlé
Nestlé, known for its diverse range of food and beverage products, employs the BCG Matrix to drive growth and profitability. Nestlé’s Boston matrix example shows how they position high-performing brands like Nescafé, KitKat, and Purina as Cash Cows while investing in health-focused or plant-based products that fall under Stars or Question Marks.

11. BCG Matrix of Nike
Nike, a powerhouse in the sportswear industry, exemplifies strategic portfolio management through their BCG matrix example. By nurturing high-potential product categories (Stars) such as performance running shoes and tech-integrated wearables, and divesting from underperforming segments (Dogs) like its golf equipment division, Nike sustains its competitive edge and reinforces its position as a market leader in athletic footwear and apparel.

12. BCG Matrix of PepsiCo
PepsiCo, a global food and beverage company, leverages the BCG Matrix to drive innovation and growth across its diverse product portfolio. With iconic brands like Pepsi, Lay’s, and Gatorade serving as Cash Cows, PepsiCo strategically invests in emerging products like SodaStream, Bubly sparkling water, and plant-based snacks as Question Marks, aligning with evolving consumer trends while maximizing returns from its core brands.

13. BCG Matrix of Google
The BCG Matrix of Google is a great BCG example that shows how the company balances profitability and innovation. Google Search is a Cash Cow, dominating a mature market and generating steady revenue. YouTube and Google Cloud are Stars, leading in high-growth sectors and requiring continued investment. Pixel phones and Nest devices are Question Marks, competing in growing markets with uncertain returns. Discontinued products like Google+ and Google Glass fall under Dogs, offering low returns in low-share positions. This matrix helps Google prioritize resources across its product portfolio.

14. Growth Share Matrix Example for IKEA
IKEA’s BCG example reveals a mix of products and initiatives. Stars include its assembly service and sustainability efforts, poised for growth. Question Marks encompass ventures like smart home products and city center stores, with potential but uncertainty. Cash Cows are staples like the Billy bookcase, providing steady revenue. Meanwhile, traditional furnishings and certain non-furniture items may be Dogs, offering limited growth. Through strategic management based on the BCG Matrix, IKEA can optimize its product lineup and sustain its market leadership.

15. Boston Matrix Example for Starbucks
One of the best BCG examples is that of Starbucks which highlights its diverse offerings within the coffee and beverage industry. Stars include innovations like mobile ordering and delivery services, driving growth amid changing consumer habits. Question Marks cover new product lines or non-coffee ventures with uncertain potential. Cash Cows are core items like espresso beverages and brewed coffee, delivering steady revenue. Dogs include seasonal or limited-time offerings with limited returns.

16. Growth Share Matrix Example for Amul
Amul’s BCG Matrix example highlights its strong presence in the dairy industry. Milk, butter, and cheese are Cash Cows, generating steady revenue in mature markets. Stars include probiotic drinks and health-focused dairy with strong growth potential. Question Marks cover non-dairy innovations that need investment and evaluation. Dogs are niche or seasonal items with low share and limited prospects.

17. Boston Matrix Example for Disney
Disney’s Boston matrix example showcases its diverse entertainment portfolio. Stars include blockbuster franchises like Marvel and Star Wars, fueled by global demand and expanding content. Question Marks are newer ventures like streaming platforms and theme park expansions, needing investment to grow. Cash Cows include classic animated films and merchandise, generating steady revenue. Dogs are underperforming media assets or legacy products with declining share.

18. BCG Matrix Hyundai
Hyundai’s matrix reflects its evolving auto portfolio. Stars include EVs like the IONIQ series in a fast-growing segment. Question Marks are hydrogen fuel cell vehicles with potential but limited adoption. Cash Cows are reliable sellers like the Elantra and Tucson. Dogs include low-performing or phased-out regional models.

19. BCG Matrix Dabur
Dabur’s matrix showcases its strength in natural wellness. Stars are health products like Dabur Honey. Question Marks include newer categories like men’s grooming. Cash Cows are core brands like Amla Hair Oil and Red Toothpaste. Dogs are weaker SKUs in saturated FMCG segments.

Lessons Learned from BCG Examples
- Regularly assess your product portfolio using the BCG Matrix to identify opportunities and challenges.
- Allocate resources strategically based on each product’s position in the matrix.
- Adapt your strategies as products move through different stages of the lifecycle.
The BCG method offers a clear, actionable framework for managing your product portfolio and aligning strategic decisions with market realities as shown by the real-world BCG examples we covered earlier. Creately makes it easy to visualize your portfolio, auto-categorize products based on input data, and collaborate with your team in real time.
Helpful Resources for BCG Matrix Analysis
Learn how BCG analysis can be applied to optimize marketing resource allocation and tailor effective marketing strategies.
Learn about the core quadrants of the BCG, how to do the analysis and advanced tips.
Learn to identify and manage high-profit, low-investment products within a business portfolio.
FAQs about BCG Examples
Why are BCG examples useful for learning?
What makes a good Boston Consulting Group matrix example?
Are BCG examples static or do they change over time?
How can I create a BCG Matrix for my own business?
Resources
Jain, Tarun. “A Study of the Construction of BCG Matrix for Nestle India.” SSRN Electronic Journal, 2005, https://doi.org/10.2139/ssrn.1120857.
Lestari, Susi, et al. “Analysis of the Boston Consulting Group (BCG) Matrix in Defending Market Share on Apple Brand Smartphones.” Proceedings of International Conference on Multidisciplinary Research, vol. 6, no. 1, 24 Feb. 2024, pp. 189–197, https://doi.org/10.32672/picmr.v6i1.1144.
Yadav, Himanshu. “Study of the BCG Matrix for Hindustan Unilever Limited.” SSRN Electronic Journal, vol. 2, no. 1, 2012, https://doi.org/10.2139/ssrn.2124042.