Flowchart Maker
Flowchart Creator to Visualize Processes & Workflows
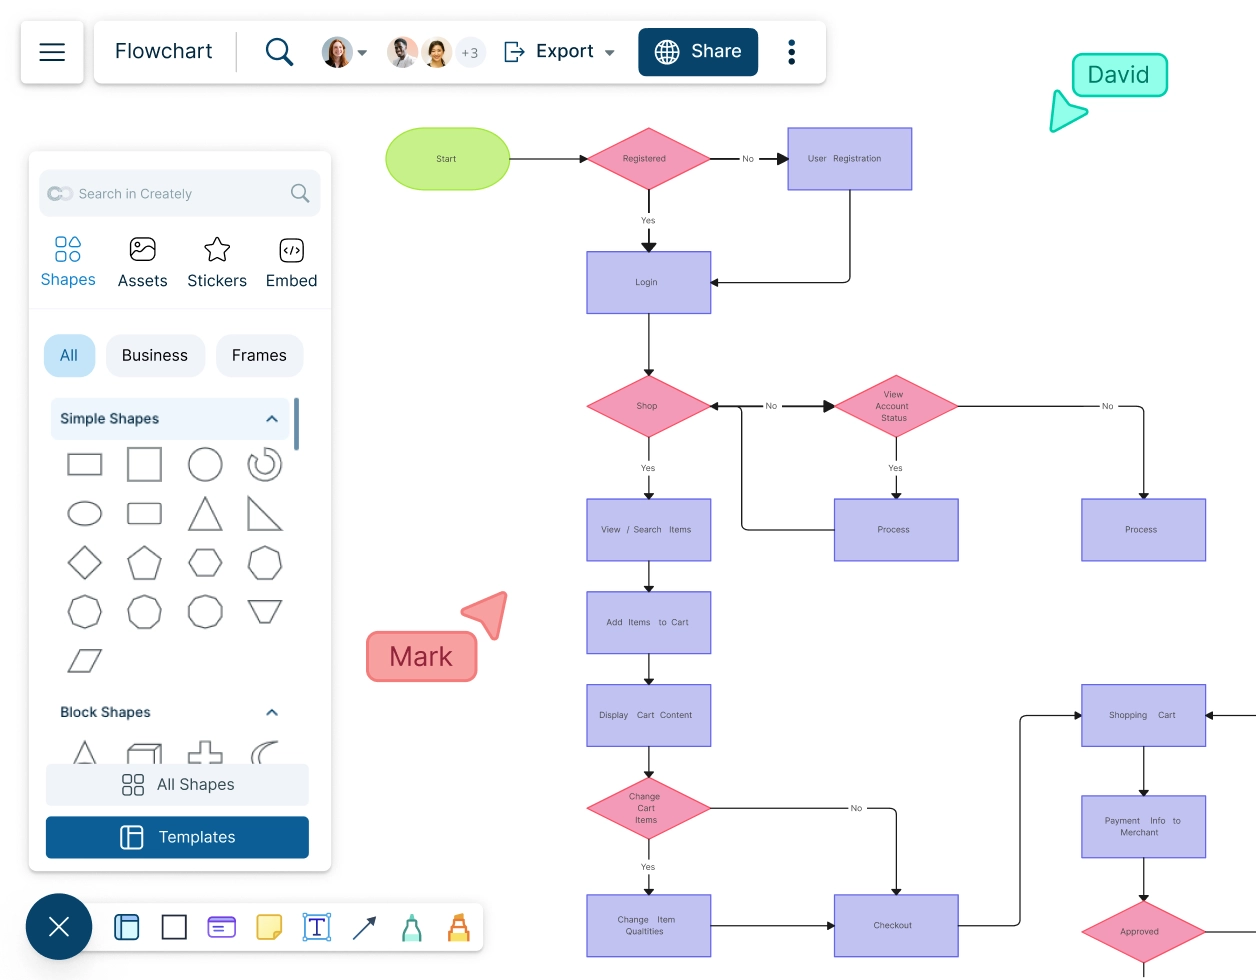
Visualize your workflows and processes to identify operational bottlenecks and areas for improvement with Creately’s Flowchart Creator.
- Professionally designed Flowchart templates to map processes faster.
- Embed in web pages or export as JPEG, PNG, SVG or PDFs.
- Powerful sharing options to get feedback on your workflows.
- Synced previews and live mouse tracking to map processes as a team.
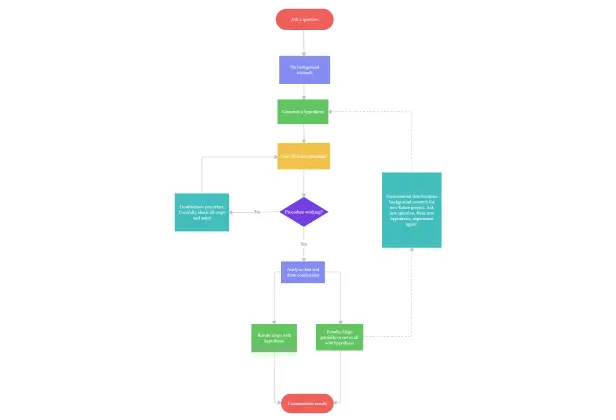
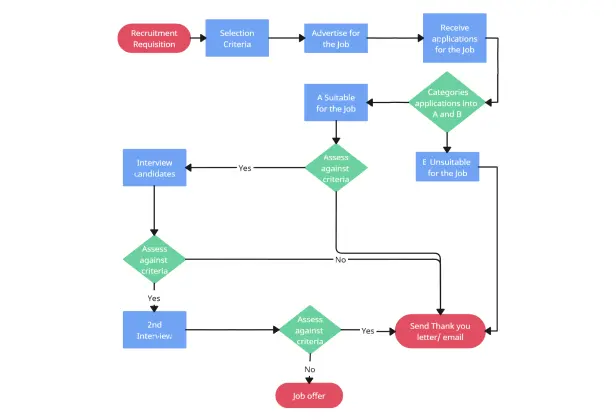
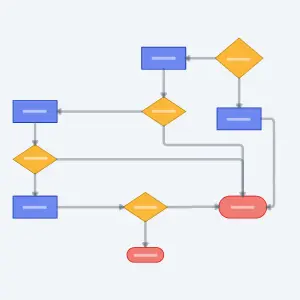
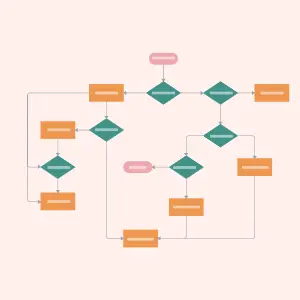
Flowchart Templates
What is a Flowchart?
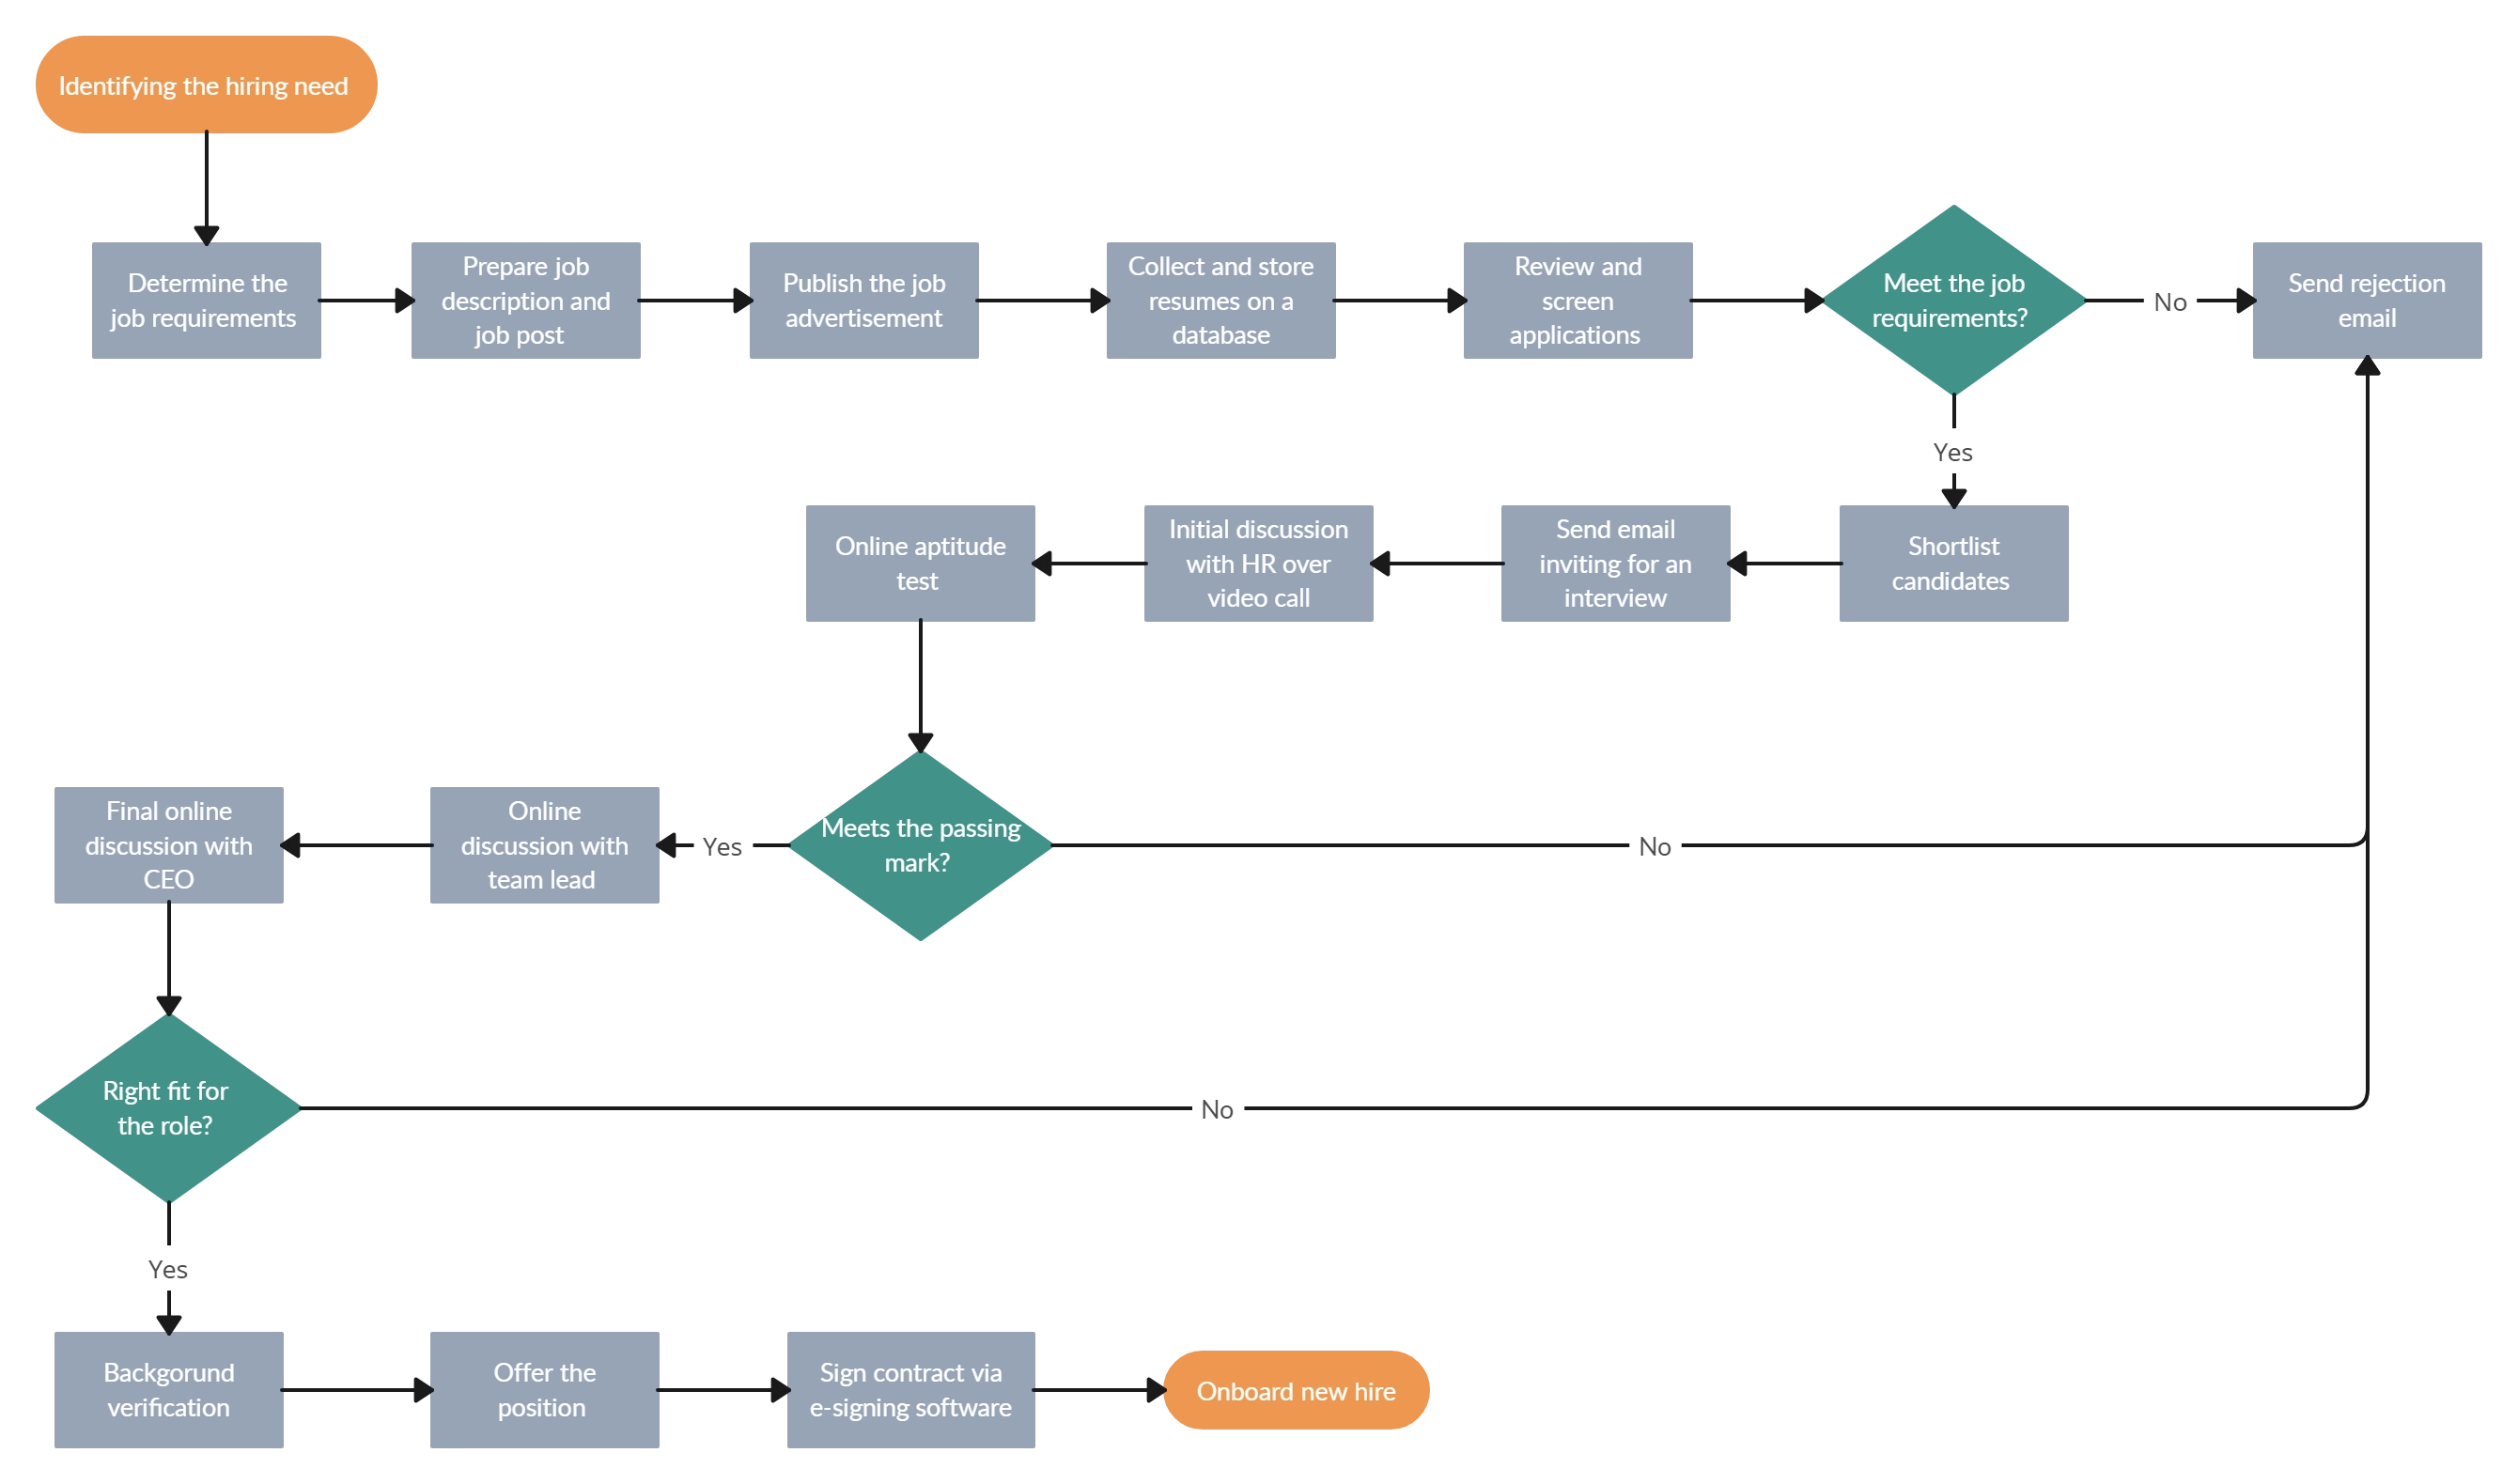
A flowchart is a diagram that visually represents the progression of steps of a process or workflows. They are commonly used as decision-making, problem-solving, system designing, and educational tools.
There are multiple types of flowcharts including:
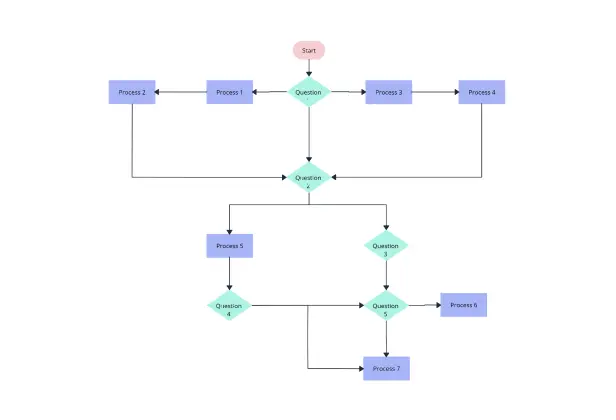
- Process flowchart - shows the steps of a process in sequential order
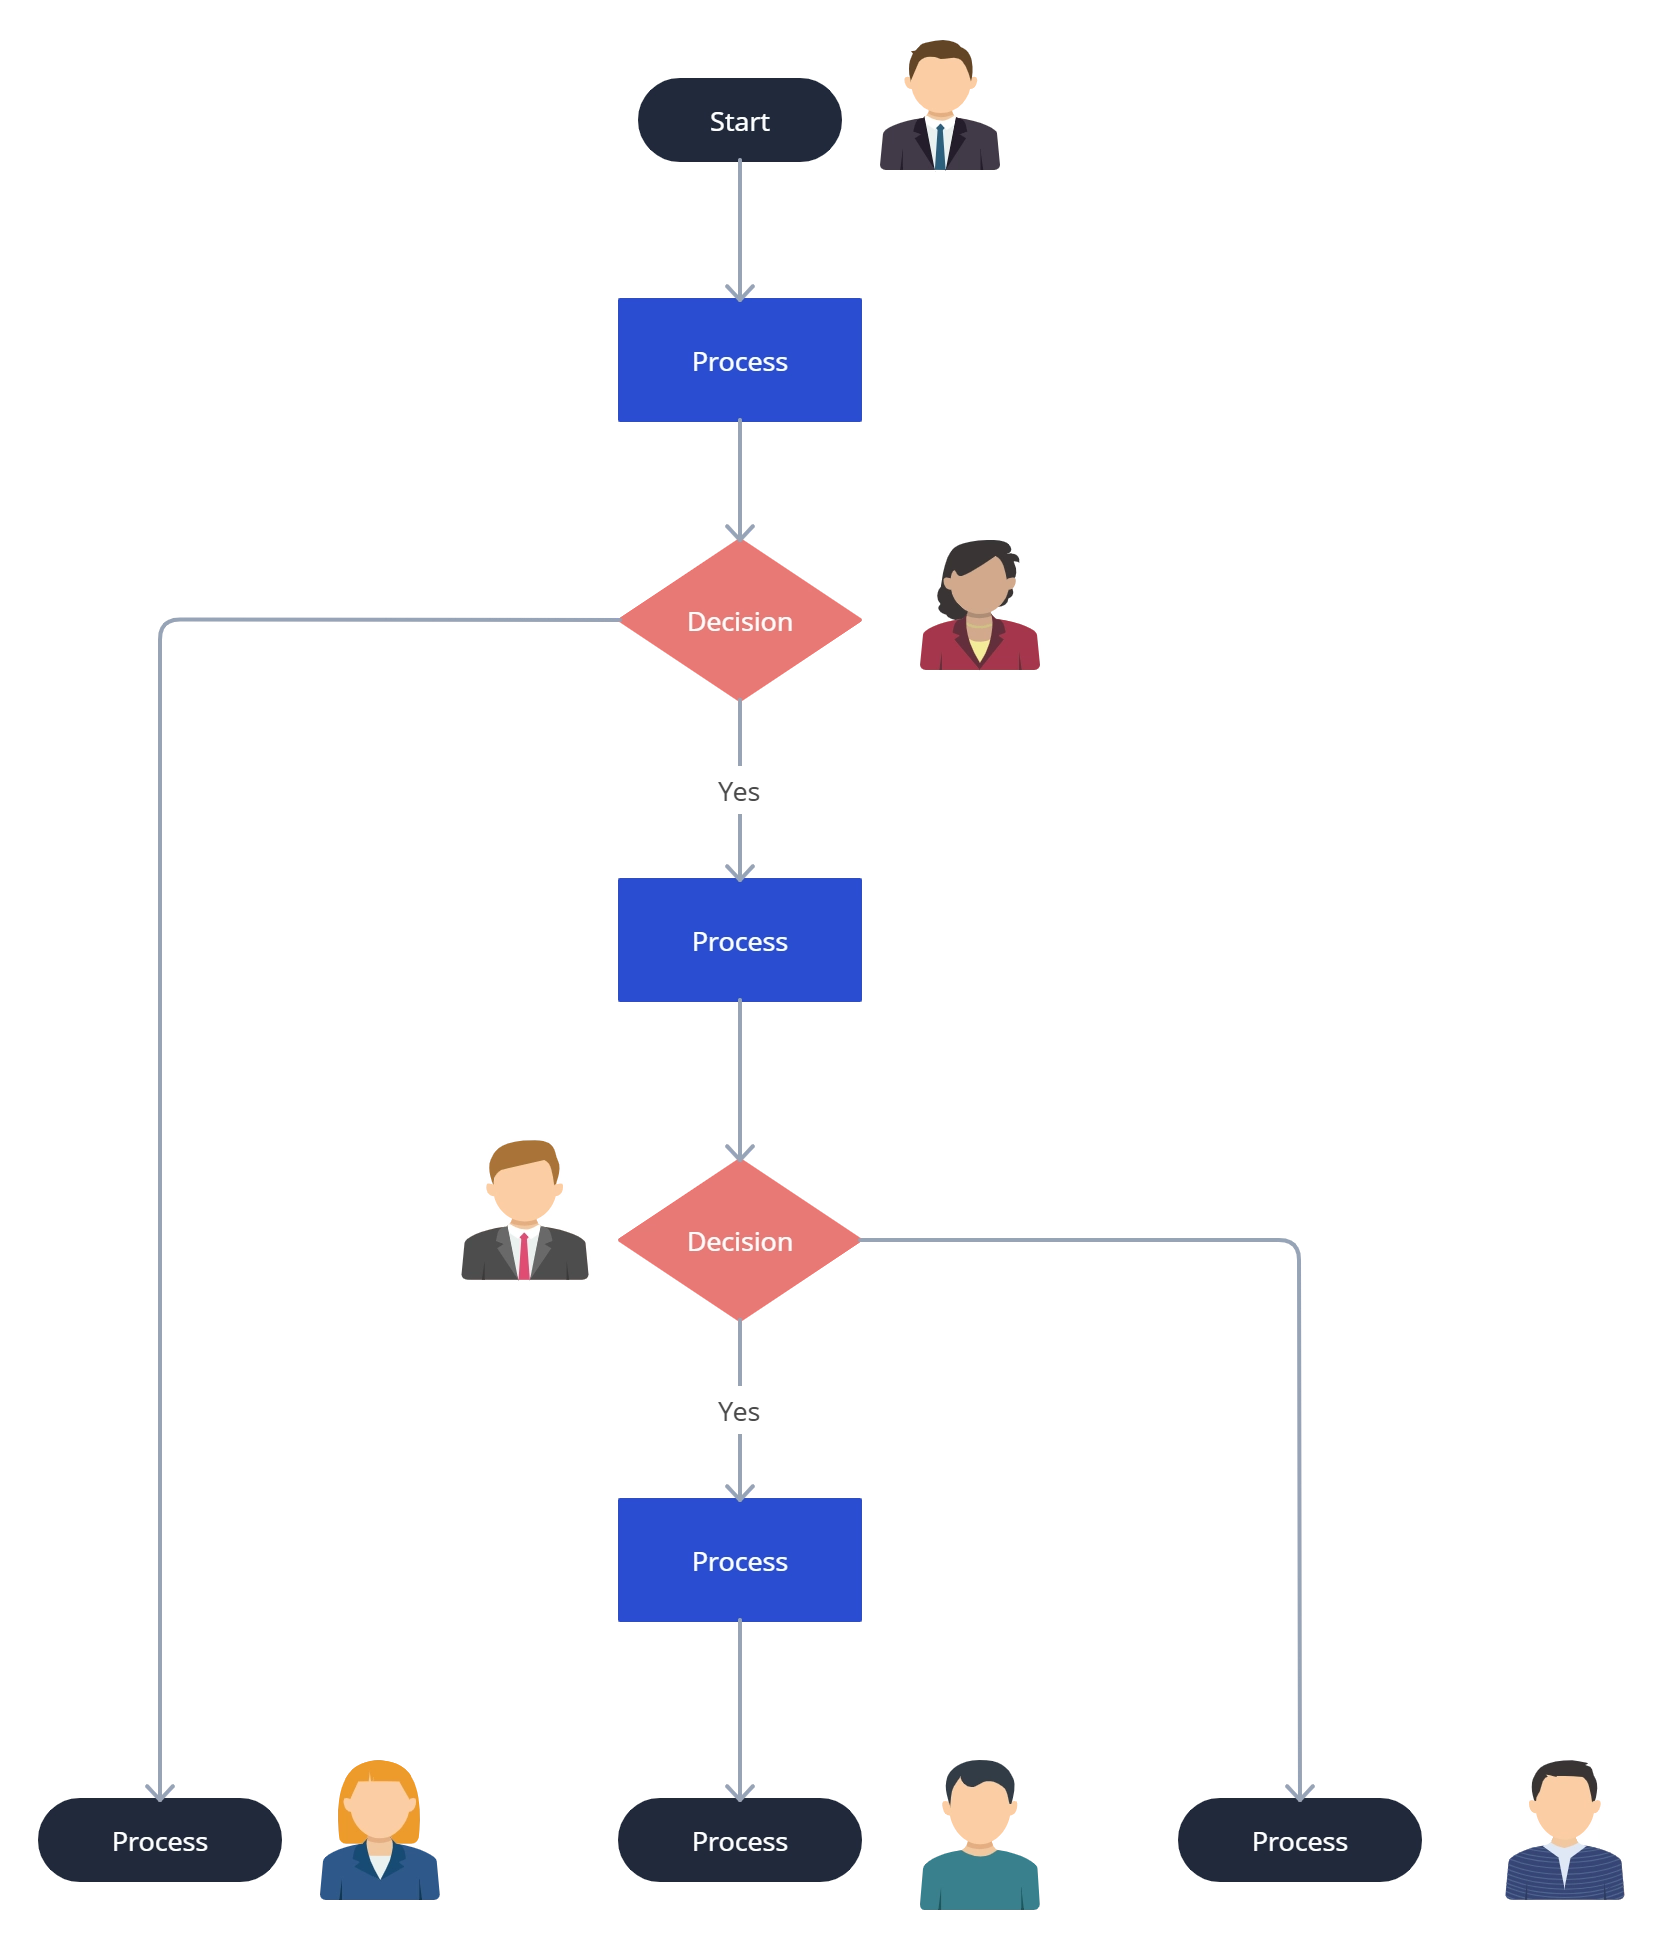
- Workflow chart - visualizes a workflow or actions that need to be carried out to achieve a goal
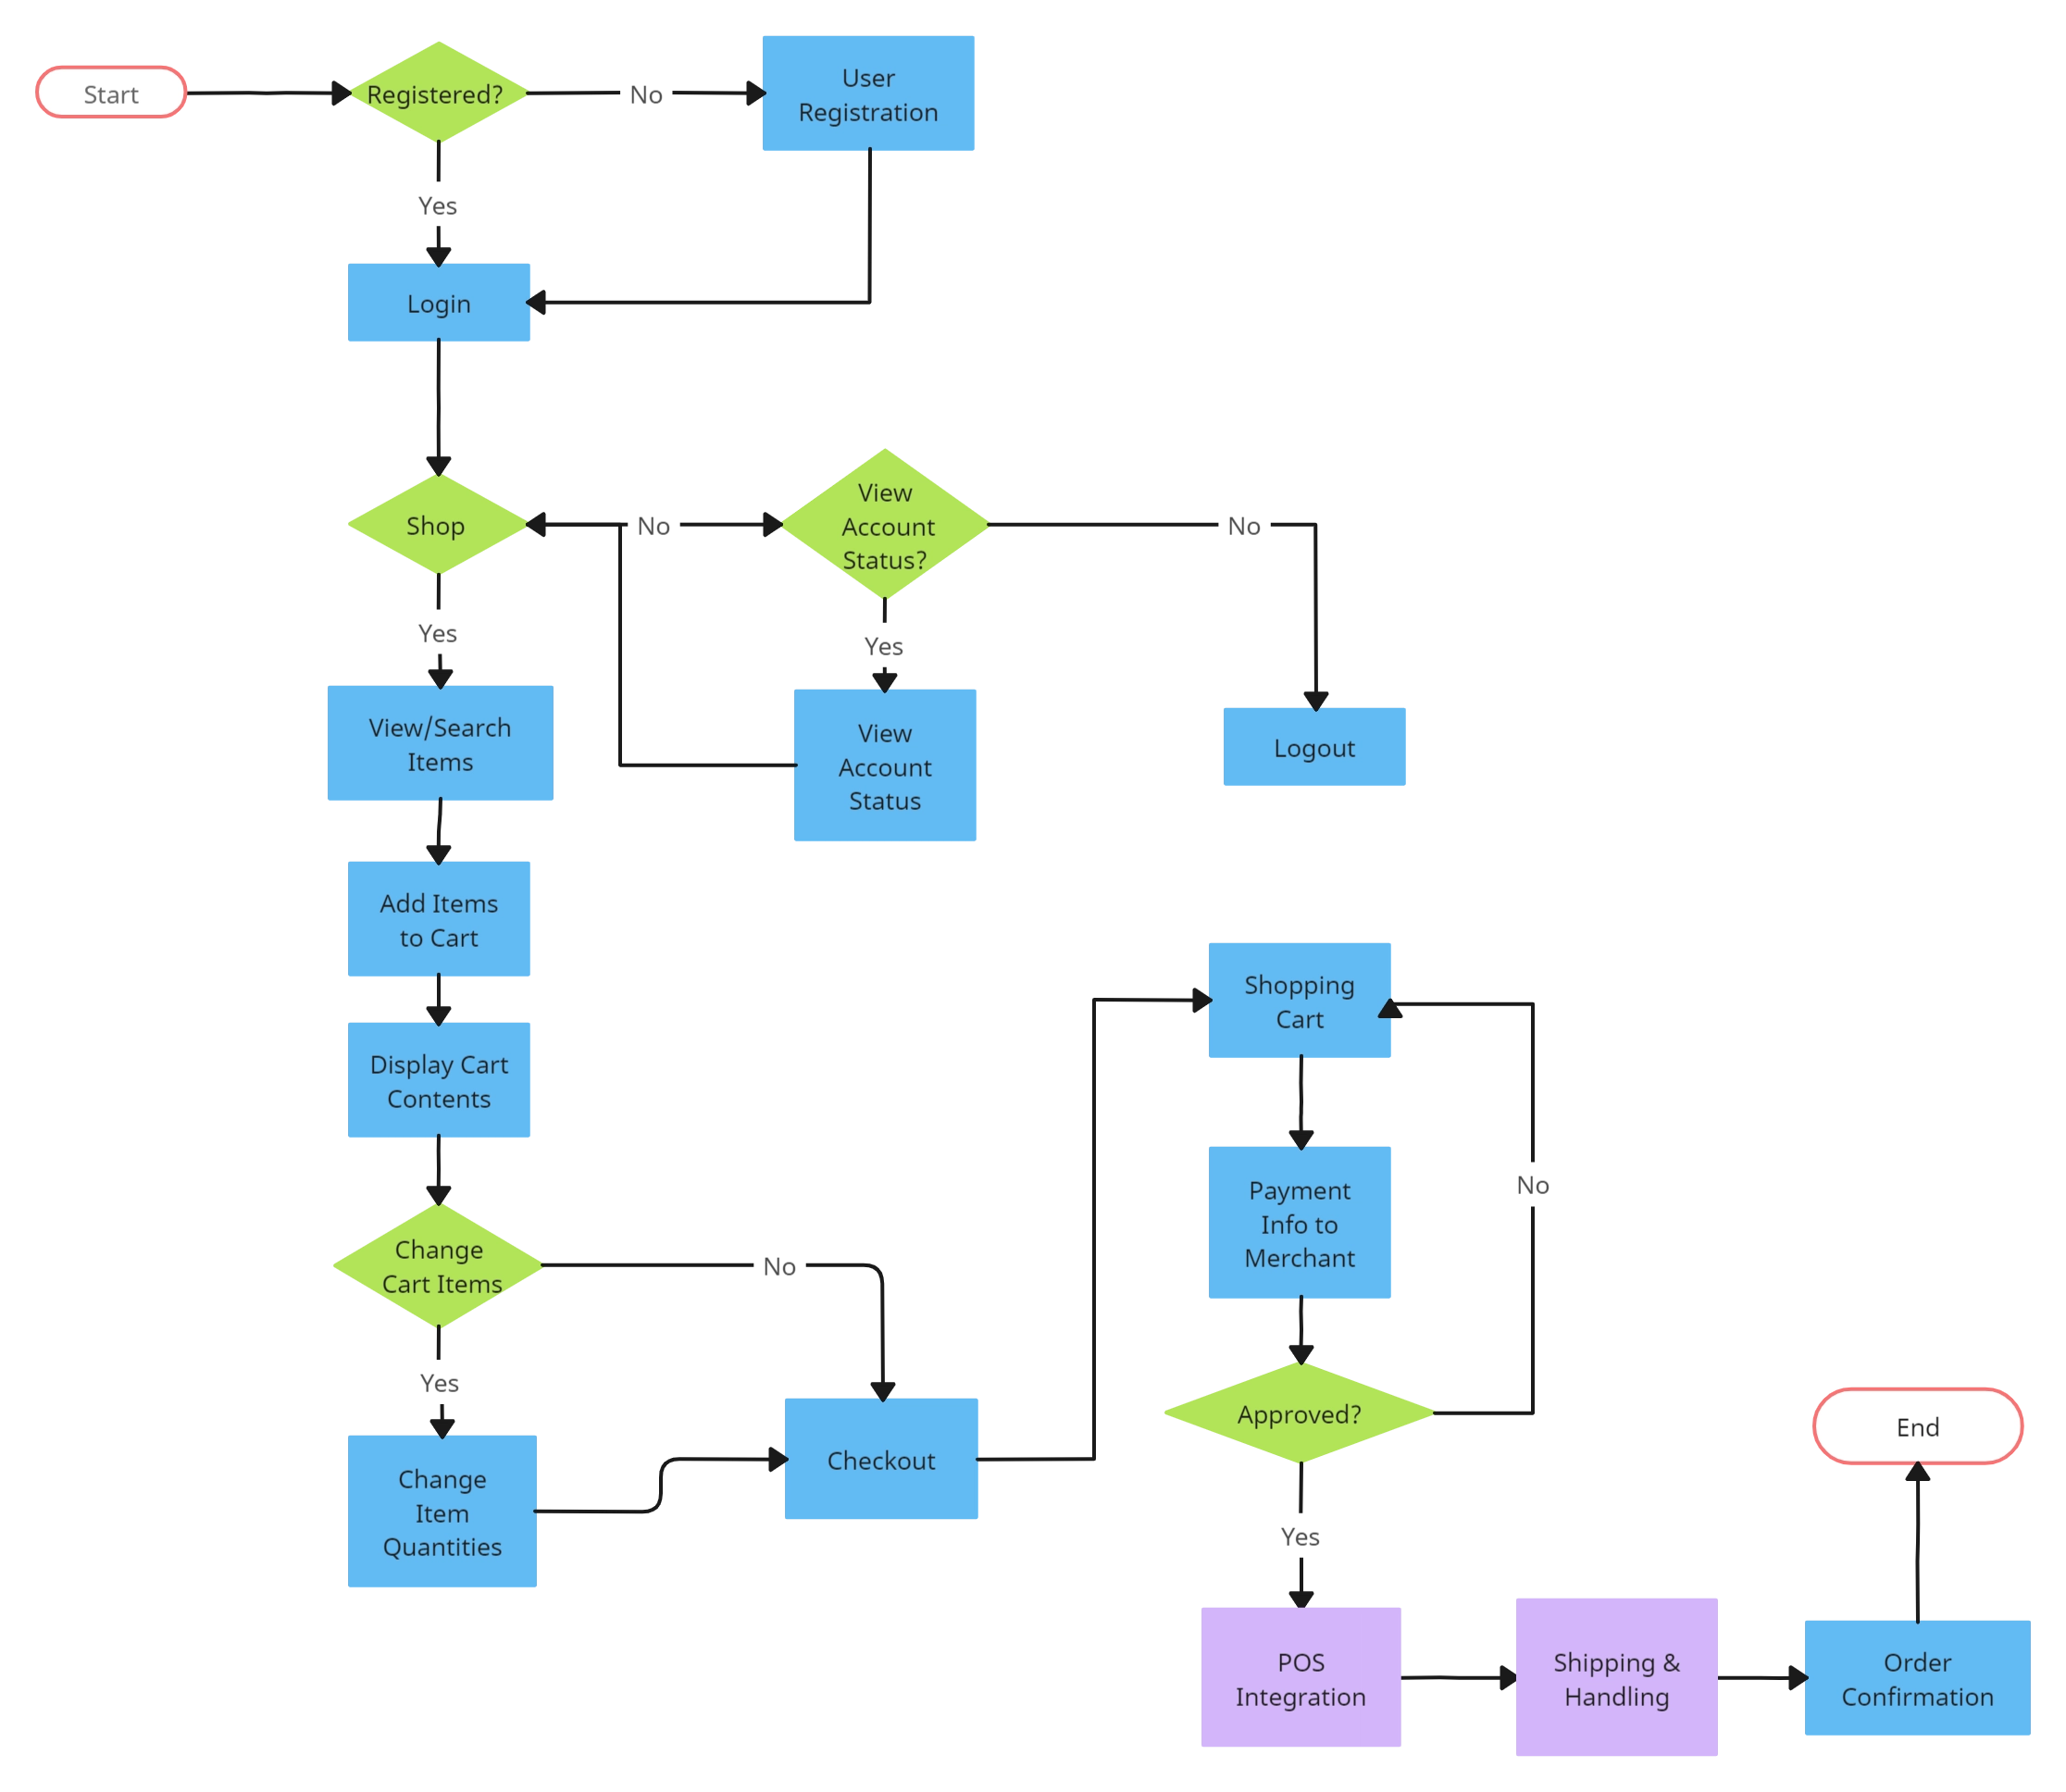
- Data flow chart - represents how data is processed within a system
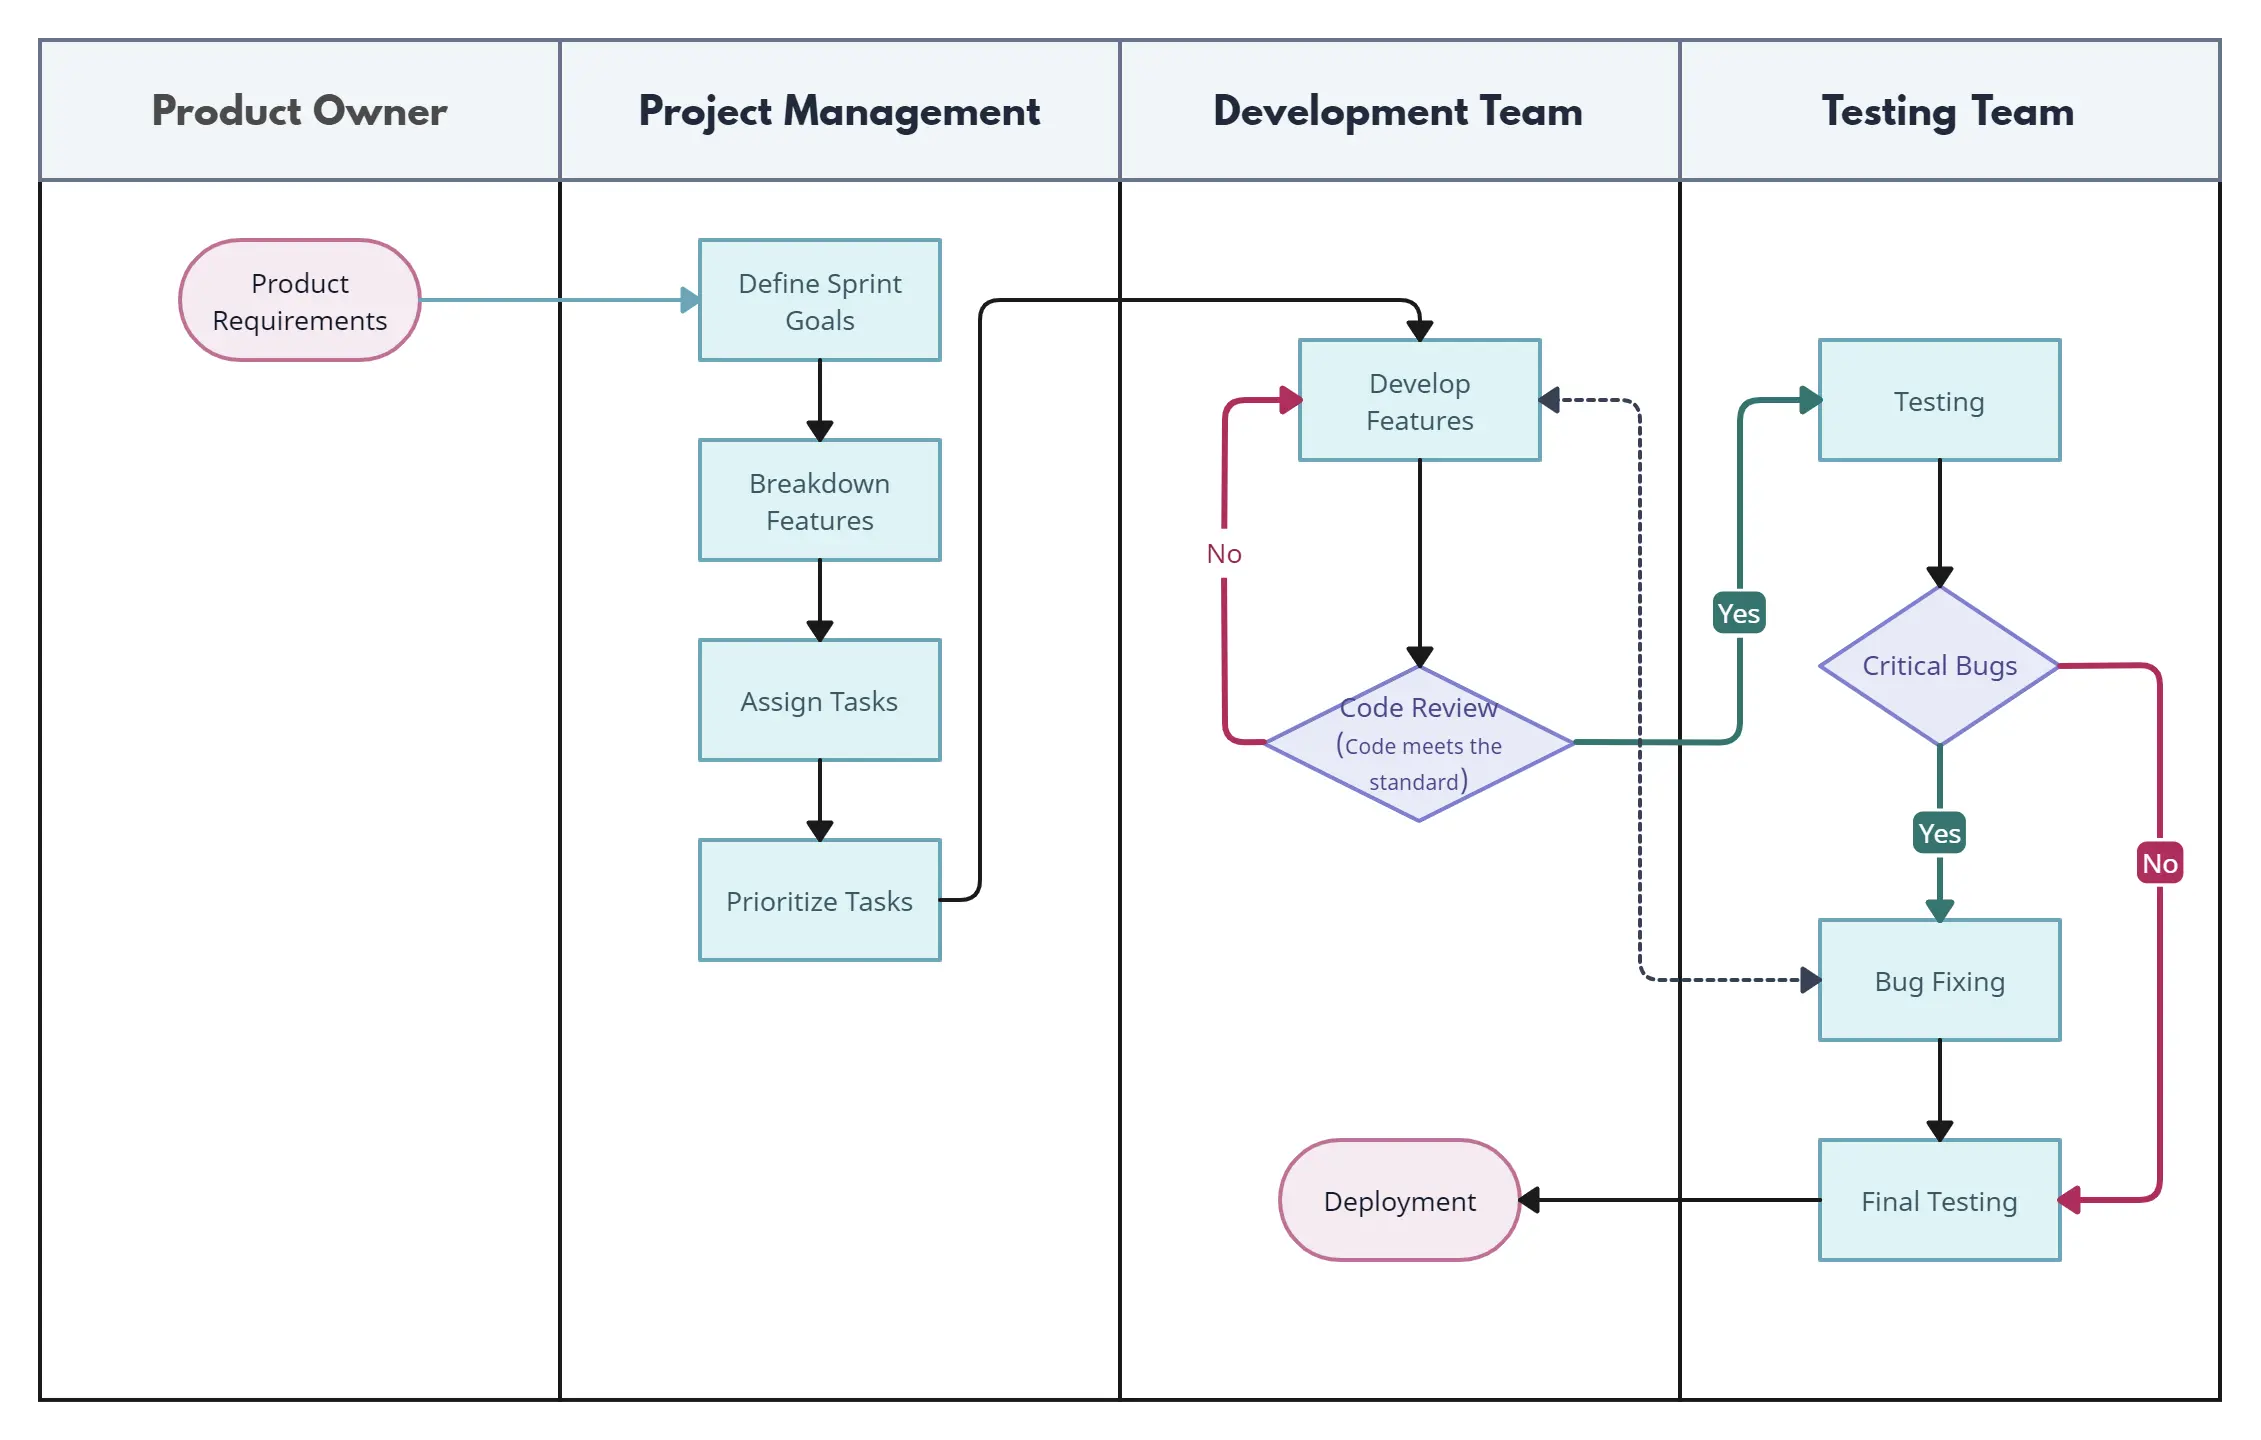
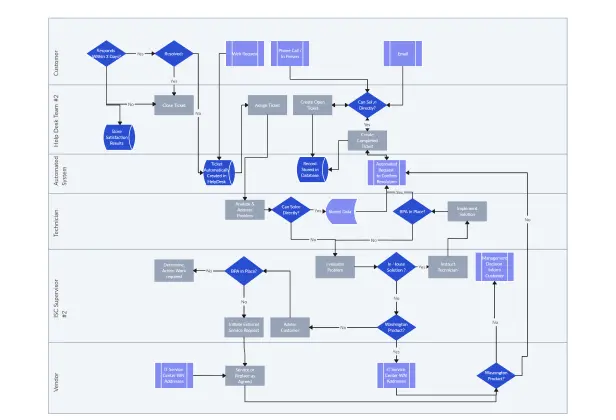
- Swimlane flowchart - illustrates process steps along with responsible owners or departments
What are Flowcharts Used for
Flowcharts are used across multiple industries;
- To clarify process steps or workflows and their respectful owners.
- To analyze existing processes to identify inefficiencies and necessary improvements.
- To collaborate on planning and designing new processes and to build a common understanding of them.
- To standardize processes by allowing team members to follow a single set of steps consistently.
- To train and guide new and existing employees on performing their tasks accurately.
How to Create a Flowchart Collaboratively with Creately
Identify the process or the workflow you and your team want to document or visualize. And then define the purpose and goals of the flowchart.
Gather the team members who will be involved in creating the flowchart. Create a workspace in Creately for your flowchart. Add the team as collaborators with edit access to allow them to work together. You can easily track the changes they make with real-time cursor tracking and synced previews.
Identify the different steps involved in executing this process. If several people are responsible for carrying out the process, collaborate and get their input for an accurate visualization.
Using the standard flowchart symbols available in the Creately flowchart maker, convert the listed steps into a flowchart.
First, drag and drop the Start/End symbol onto the canvas. Using the Plus Create option, add the next symbol depending on whether it’s a process/step/operation or decision. Make sure to use the correct flowchart symbol to represent your data.
Connect the shapes with arrows highlighting the flow of the process or workflow. Creately’s Plus Create automatically recognizes the flow and adds the relevant connector as you draw the flowchart.
Customize the flowchart as necessary with Creately flowchart creator’s preset color themes before sharing it with stakeholders for feedback.
Review the flowchart frequently and update it as the process it represents, undergoes changes.
Flowchart Symbols

Terminal / Terminator
Represents the start or end of a process or system.

Process
Represent a process, action step, or operation.

Data
Shows the data inputs or outputs of a process.

Decision
Represents the decision point of a process.

Document
Indicates a document or report in a process flow.

Stored Data
Represents a data storage device or location, such as a database, file, or other form of data storage.

Direct Data
Indicate a step in the process where data is directly entered or obtained from an external source, such as a user, sensor, or other system.
Internal Storage
Represents an internal storage location, such as a register or buffer.

Manual Input
Represents a step in the process where data is manually entered by a user or operator.

Predefined Process
Predefined Process flowchart symbol in Creately flowchart maker representing a reusable subprocess
Flowchart Resources


FAQ about Creately’s Flowchart Maker
How to use a flowchart for process documentation?
What are the best practices for creating and analyzing flowcharts?
- Involve people who really know and live the process such as front-line employees.
- When analyzing a process using a flowchart, first create a high-level overview to identify the major components of the process and then drill down.
- Include as many people involved in the implementation of the process as possible to get a complete understanding.
- Keep the flowchart as simple and understandable as possible to ensure all stakeholders can follow it.
- Analyze the flowchart from front to back or from the process owner’s point of view and from back to front or from the customer’s point of view.