What is a Spaghetti Diagram?
A spaghetti diagram is a visual representation of physical movement through a workspace, tracing the paths taken by people, materials, products, or equipment. By recording actual routes and distances, it helps teams identify repeated travel, backtracking, congestion, and other forms of motion or transportation waste. Teams can then use that evidence to evaluate changes to a layout or workflow.
The name comes from the tangled appearance of the traced paths, which can resemble a plate of spaghetti. Mapping the routes makes the relationship between a physical layout and the movement it creates easier to discuss. It can reveal excessive travel between workstations or frequently crossed paths that are difficult to recognize from a floor plan alone. Stakeholders can use the visual evidence to compare improvement options before changing the workspace.
Spaghetti diagrams are commonly used in Lean process improvement to examine motion and transportation waste. They can also support the Measure and Analyze phases of DMAIC (Define, Measure, Analyze, Improve, Control) when a team needs evidence about actual movement. Explore this spaghetti diagram example to see how observed paths can be documented.
Components of a Spaghetti Diagram
Workers: Tracks the movement of individuals within the space.
Products: Follows the path products take through the production or service delivery process.
Physical information flow: Traces the movement of paper records or other information carriers when their physical route affects the process. Use a process map or data flow diagram when the goal is to examine digital information exchange.
Distinguishing these components helps teams record each route consistently and compare where unnecessary movement occurs. For a broader view of activities, decisions, and responsibilities beyond physical movement, see this process mapping guide.
Top Five Use Cases for Spaghetti Diagrams in Various Industries
Manufacturing Process Optimization
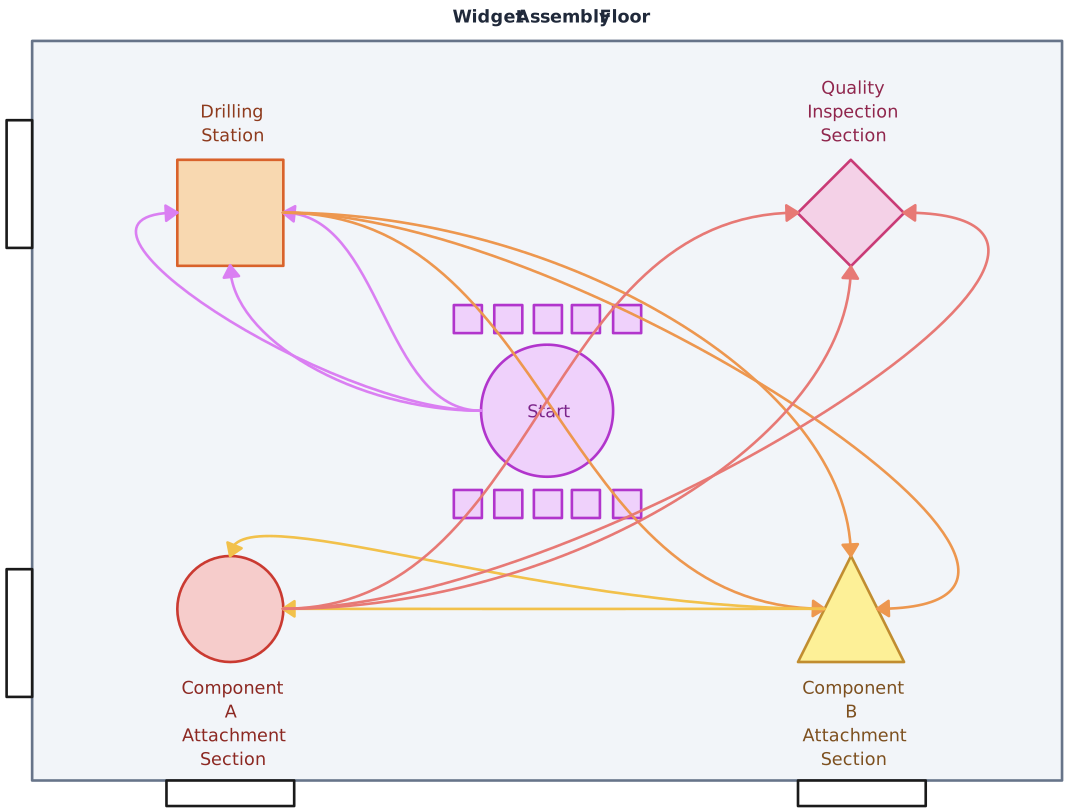
In manufacturing, teams can trace movement between workstations, storage areas, and inspection points to identify backtracking or congested routes. The findings can inform proposed layout changes, which should then be assessed for operational and safety implications. The production and manufacturing planning guides provide related methods for analyzing production work.

Service Delivery Streamlining
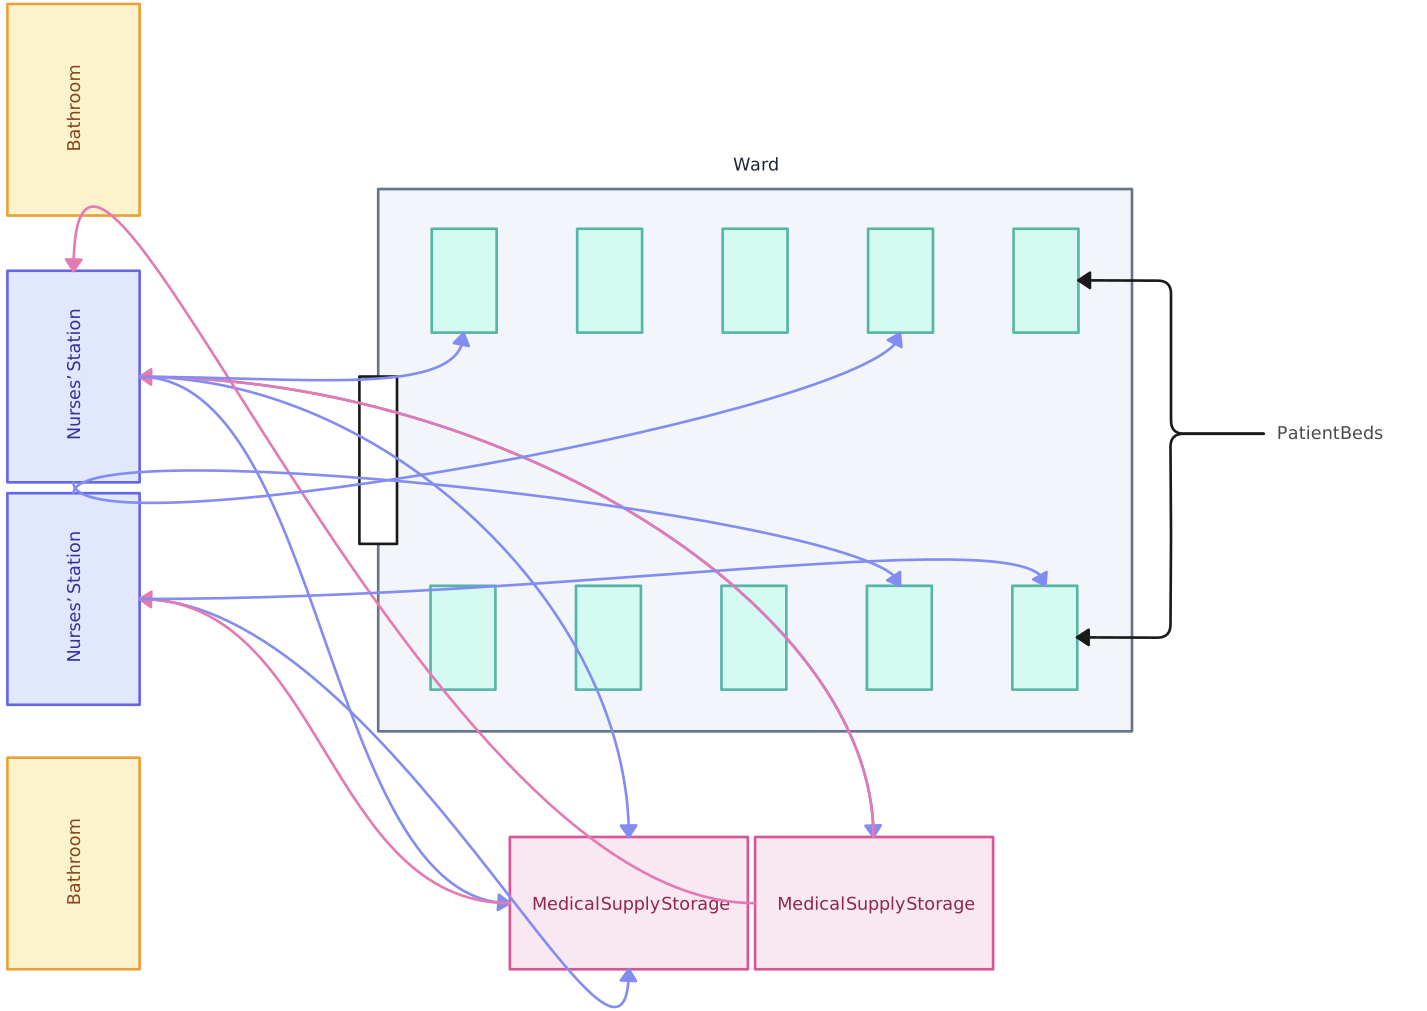
In healthcare, hospitality, and other service environments, a spaghetti diagram can reveal how staff move between customers, equipment, records, and support areas. For example, a hospital may trace a nurse’s medication round to investigate unnecessary travel. Any proposed change should preserve clinical, safety, and accessibility requirements rather than treating shorter distance as the only goal.
Retail and Warehousing Layout Optimization
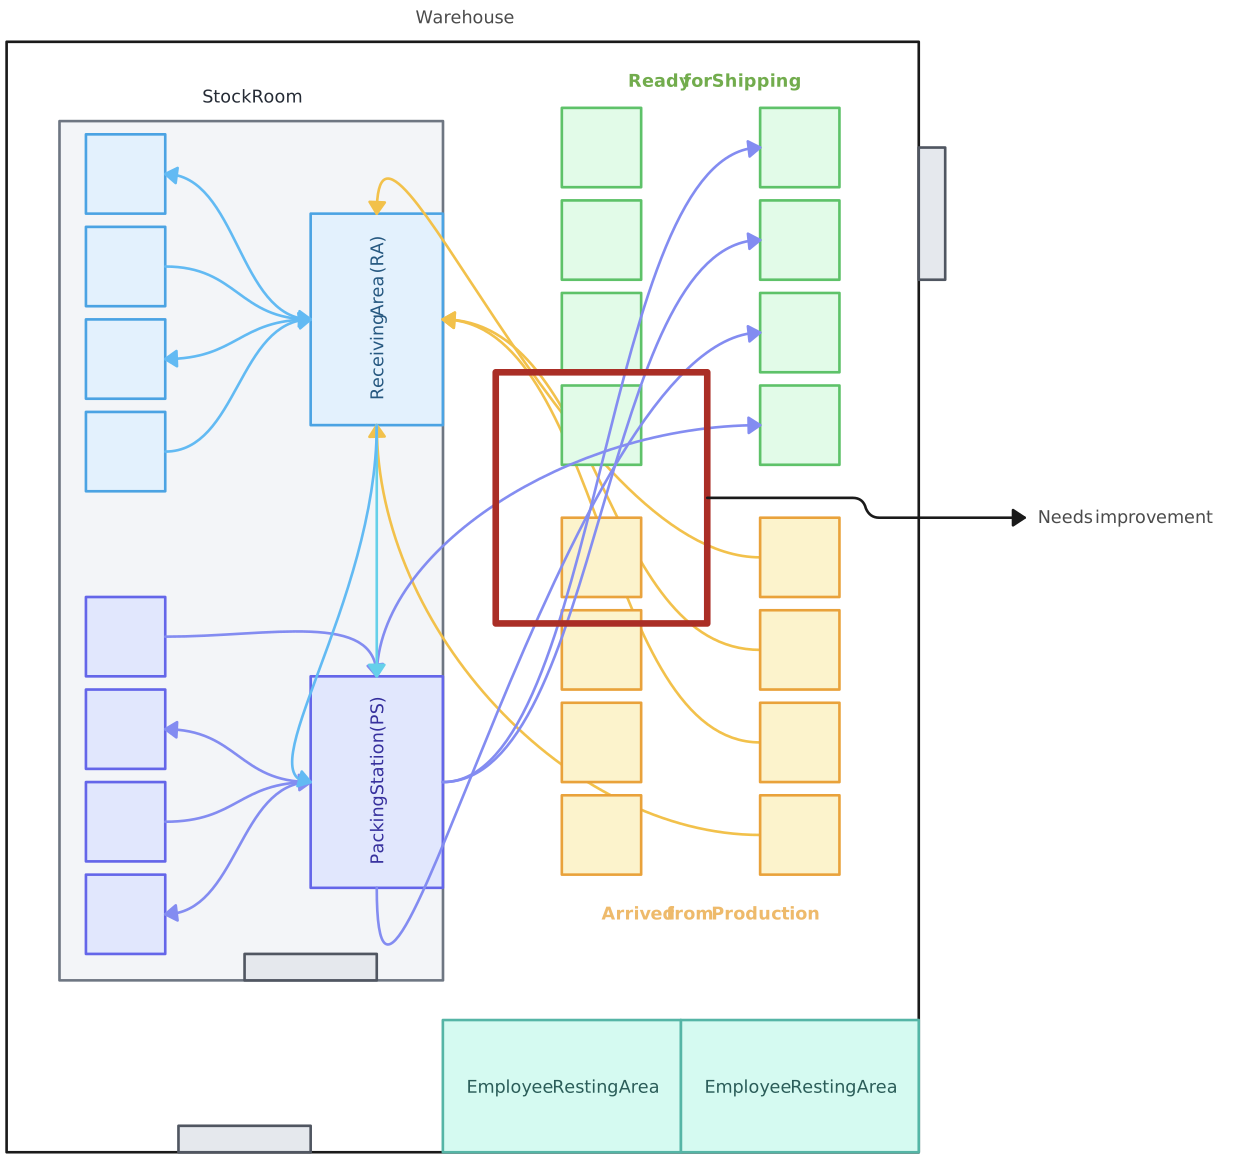
Retailers and warehouse managers can trace the movement of staff and goods between storage, picking, packing, and sales areas. Comparing path frequency and distance can help them evaluate where a layout contributes to slow stocking, retrieval, or congestion. A spaghetti diagram can also provide evidence for teams working on avoiding bottlenecks in processes during peak periods.
Logistics and Transportation Route Enhancement
In logistics and transportation facilities, spaghetti diagrams are best suited to movement within a warehouse, depot, terminal, loading yard, or maintenance area. Teams can trace frequently traveled paths to evaluate internal routing and handling activity. Long-distance fleet routing and delivery-network optimization require dedicated route-planning methods and data rather than a workplace spaghetti diagram alone.
Office Layout and Information Flow Improvement
Teams can also use spaghetti diagrams to examine movement between desks, meeting rooms, printers, storage, and shared facilities. The observations can inform office-layout options, but teams should consider accessibility, privacy, collaboration needs, and employee feedback alongside travel distance.

The Advantages of Implementing a Spaghetti Diagram in Your Operations
Identifying Inefficiencies and Wastage
Optimizing Delivery Times and Flow
Cost Savings and Efficiency Gains
Continuous Improvement and Lean Management
Data-Driven Decision Making
When to Use a Spaghetti Diagram for Maximum Impact
Initial Process Analysis and Setup
Spaghetti diagrams are most reliable when they are based on observed movement in an existing process. When planning a new workspace, teams can sketch expected paths as a hypothesis, but they should validate the diagram with observations after the process begins operating.
Scaling Operations and Maintaining Efficiency
As volume grows, routes that worked at a smaller scale may become congested or create repeated travel. A new observation can show how movement has changed and provide evidence for evaluating layout or workflow adjustments.
Post-Implementation Reviews
After implementing a new layout, observe the same movement under comparable conditions and create an updated spaghetti diagram. Comparing distance, frequency, crossings, and travel time with the baseline helps the team assess whether the change produced the intended result.
Pre-Audit Process Validation
Before a workplace or process review, a spaghetti diagram can document observed movement and support discussion of layout-related risks or waste. It does not validate every process step or demonstrate compliance on its own, so pair it with the procedures, controls, and evidence required by the relevant audit.
Step-by-Step Guide to Create Your Own Spaghetti Diagram
Here’s a step-by-step guide to help you create your spaghetti diagram.
Map the Current State
Start by sketching the physical layout of the workspace. This will serve as the foundation of your spaghetti diagram. In Creately’s visual workspace for process documentation, you can draw the area where work is performed and mark key locations such as workstations, storage areas, and equipment.
Track Movements and Flows
Next, observe the actual movement of people, products, materials, equipment, or physical records over a defined period. Use different connector types and colored lines to distinguish each route. Record direction, frequency, distance, and time consistently so the resulting pattern can be interpreted in context.
Add Insights with the Notes Panel
As you map the routes, connect observations and evidence to relevant locations on the diagram. Notes can capture travel time, distance, frequency, delay reasons, or the conditions under which the observation was made. Naming the person responsible for maintaining the diagram also makes follow-up more accountable.
Refine Your Spaghetti Diagram
Once the initial diagram is complete, review it with the people who perform and manage the work. Use comments to capture contextual feedback, confirm that the paths represent normal and exception conditions, and investigate patterns of unnecessary movement. The owner can then incorporate agreed updates and preserve the current-state diagram as a baseline for comparing proposed changes.
Tips for Creating an Effective Spaghetti Diagram
Make Sure Your Data is Accurate
Begin by defining what will be observed, for how long, and under which operating conditions. Tools such as Creately’s visual project management & execution tools can help you document the observed routes and keep review context connected to the diagram, but the accuracy depends on the source data. Record movements consistently and note unusual events rather than assuming one observation represents every shift or workload.
Get Cross-Functional Teams Involved
Involving people from the departments represented in the flow adds operational context to the observed paths. Real-time collaboration and contextual comments let participants explain handoffs, exceptions, and constraints before the diagram owner finalizes an interpretation.
Keep the Diagram Simple
While detail is important, a spaghetti diagram should not be overly complex. Keep it simple to allow for easy interpretation and to ensure that it can be understood at a glance.
Revise and Update Regularly
Processes and layouts evolve, so review the spaghetti diagram after material changes or when new movement data suggests the baseline is outdated. Keep supporting observations connected to the map, record agreed revisions, and use version history to understand how the documented flow changed over time.
Wrapping Up
The value of a spaghetti diagram comes from making observed movement visible so teams can discuss it using shared evidence. With Creately, teams can maintain the map alongside connected notes, links, and files; review it together; and keep responsibility for updates clear. This turns the diagram into living process documentation while leaving operational decisions with the people who understand the work.
By following these steps, you can create a spaghetti diagram that highlights movement patterns worth investigating and provides a baseline for comparing proposed changes. The goal is to visualize the physical flow of people, products, materials, equipment, or records without treating the diagram itself as proof that a change will improve performance.