Understanding how entities relate to each other is at the heart of data modeling. That’s where cardinality symbols come in. These visual indicators define how many instances of one entity can or must be associated with instances of another, forming the backbone of accurate, meaningful ER diagrams.
In this guide, we’ll discuss cardinality in ER diagrams, the main types of cardinality, and explore different cardinality notations. We’ll also discuss ordinality, a key concept that distinguishes optional from mandatory relationships.
Whether you’re designing a database schema or brushing up on your ER modeling skills, this guide will help you confidently use cardinality symbols to map relationships with clarity and precision.
What Is Cardinality in an ER Diagram?
Cardinality in an Entity-Relationship (ER) diagram refers to the numerical relationship between entities—specifically, it defines how many instances of one entity can be associated with instances of another. Understanding cardinality is essential in data modeling, as it sets the rules for how data is structured and connected across a database.
Let’s break this down with a practical example:
- One customer can place many orders.
- But each order is placed by only one customer.
This is known as a one-to-many relationship, and it’s just one of several types of cardinality relationships found in ER diagrams. Other common types include one-to-one and many-to-many relationships. These associations are visually represented using cardinality symbols, which are graphical notations that define the minimum and maximum number of relationships allowed between entities.
These cardinality symbols play a critical role in illustrating relationship constraints and ensuring the accuracy of your data architecture. Grasping the use of cardinality symbols in ER diagrams helps you build clear, scalable, and logical database designs.
Types of Cardinality Symbols in ER Diagrams
In ER diagrams, cardinality symbols are visual cues used to represent the nature of relationships between entities. These symbols help define how many instances of one entity can be associated with instances of another, making your data model more precise and easier to understand.
There are several widely used ER diagram notations, each with its own style of depicting cardinality. The most common types include Chen notation, Crow’s Foot notation, and UML notation. Understanding how each represents cardinality types, such as one-to-one, one-to-many, and many-to-many, can help you choose the right style for your database design needs.
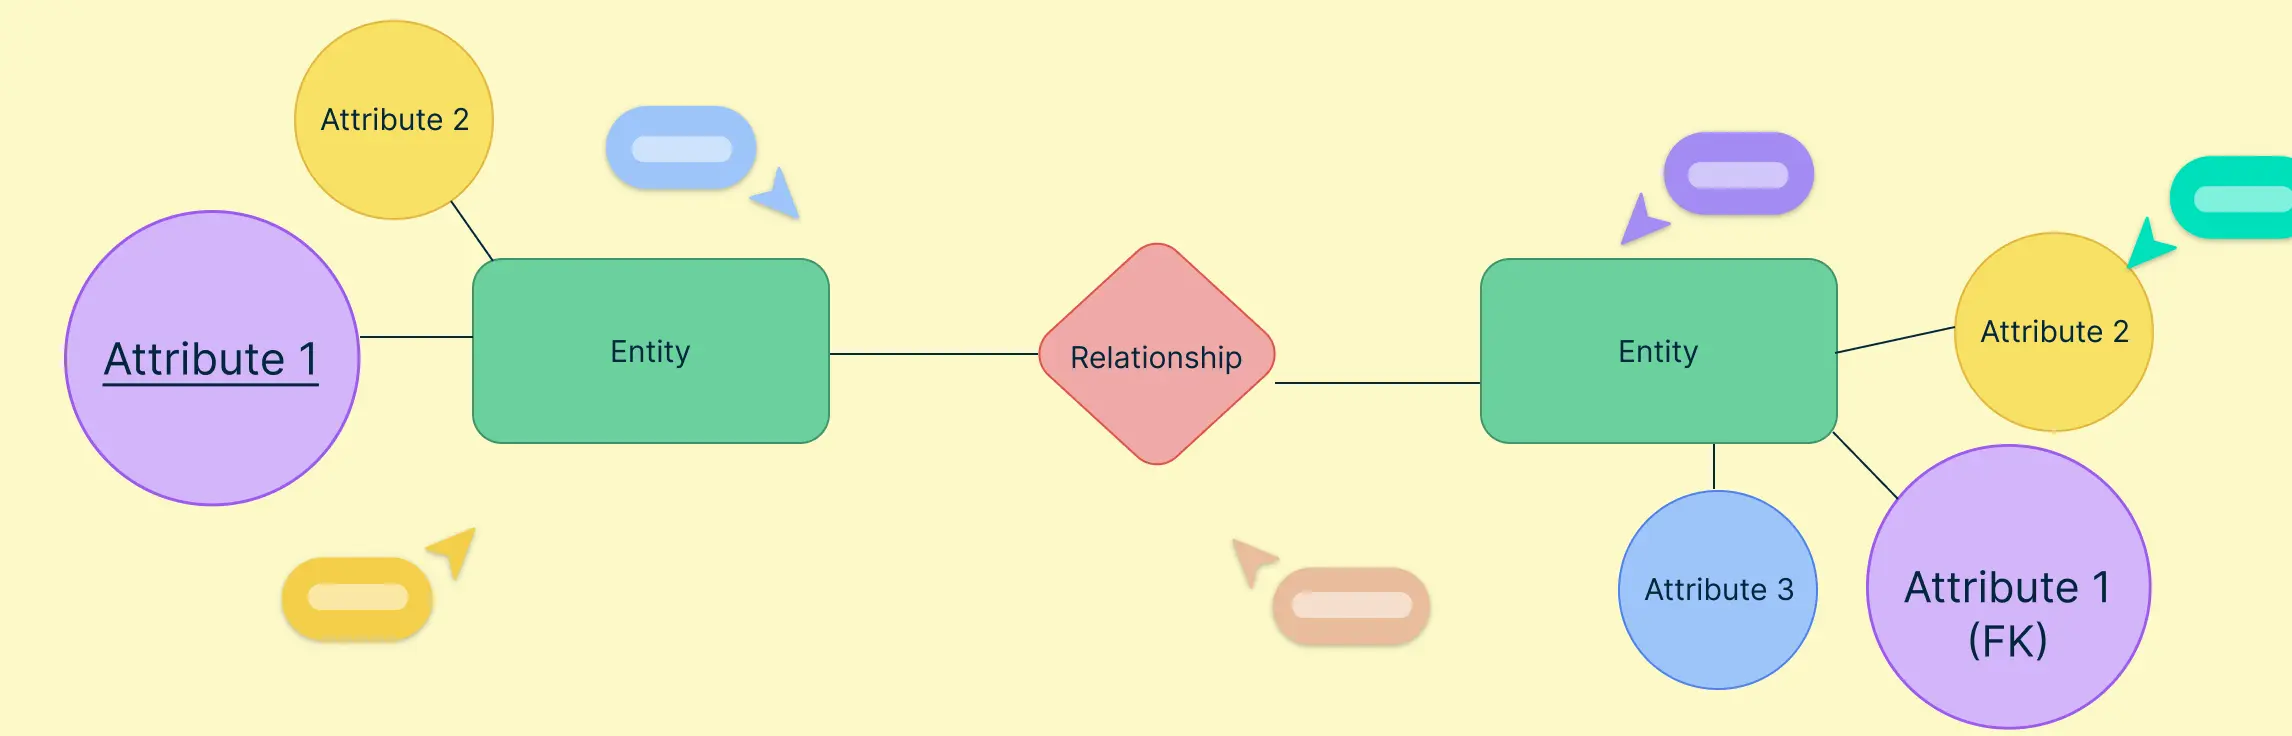
Chen Notation
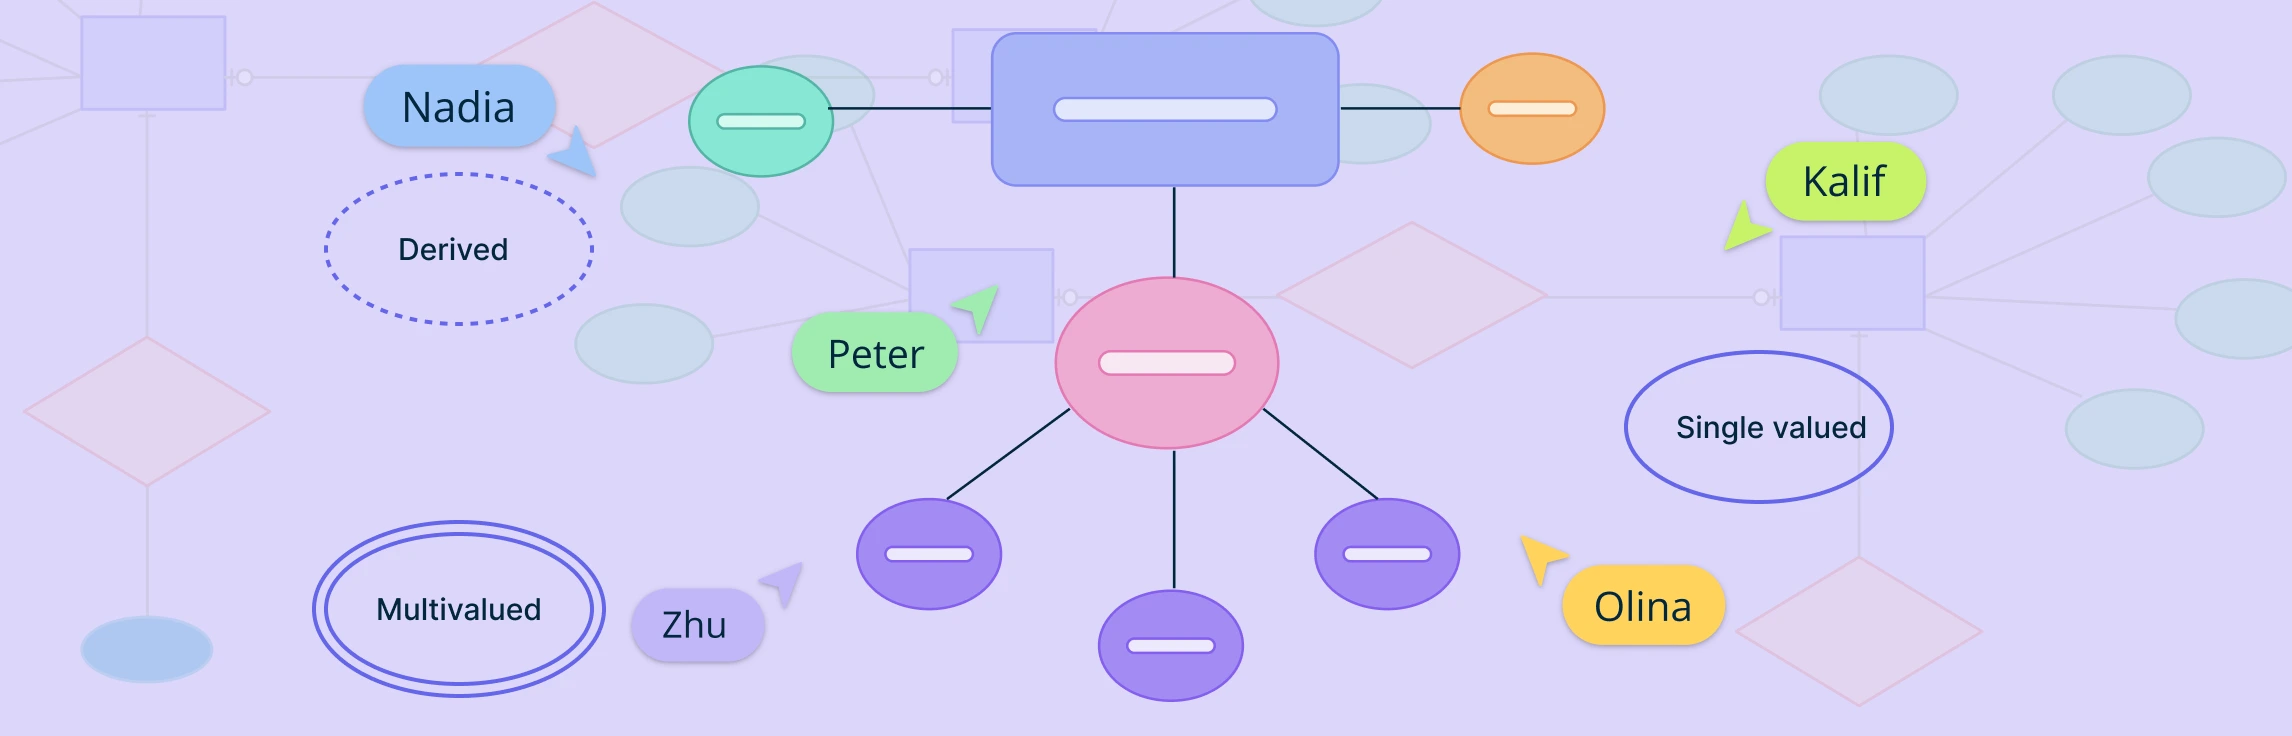
Chen notation is the original ER diagram style introduced by Peter Chen. It uses diamonds to represent relationships and ovals for attributes, with cardinality symbols placed as numbers (1, N, M) beside the entity lines.
- 1 represents a one-to-one relationship
- N or M represents a one-to-many or many-to-many relationship
This notation is excellent for conceptual modeling, where clarity and simplicity are key. It’s especially popular in academic and theoretical contexts.
Use Case: Ideal for early-stage database design and stakeholder discussions where a non-technical audience is involved.
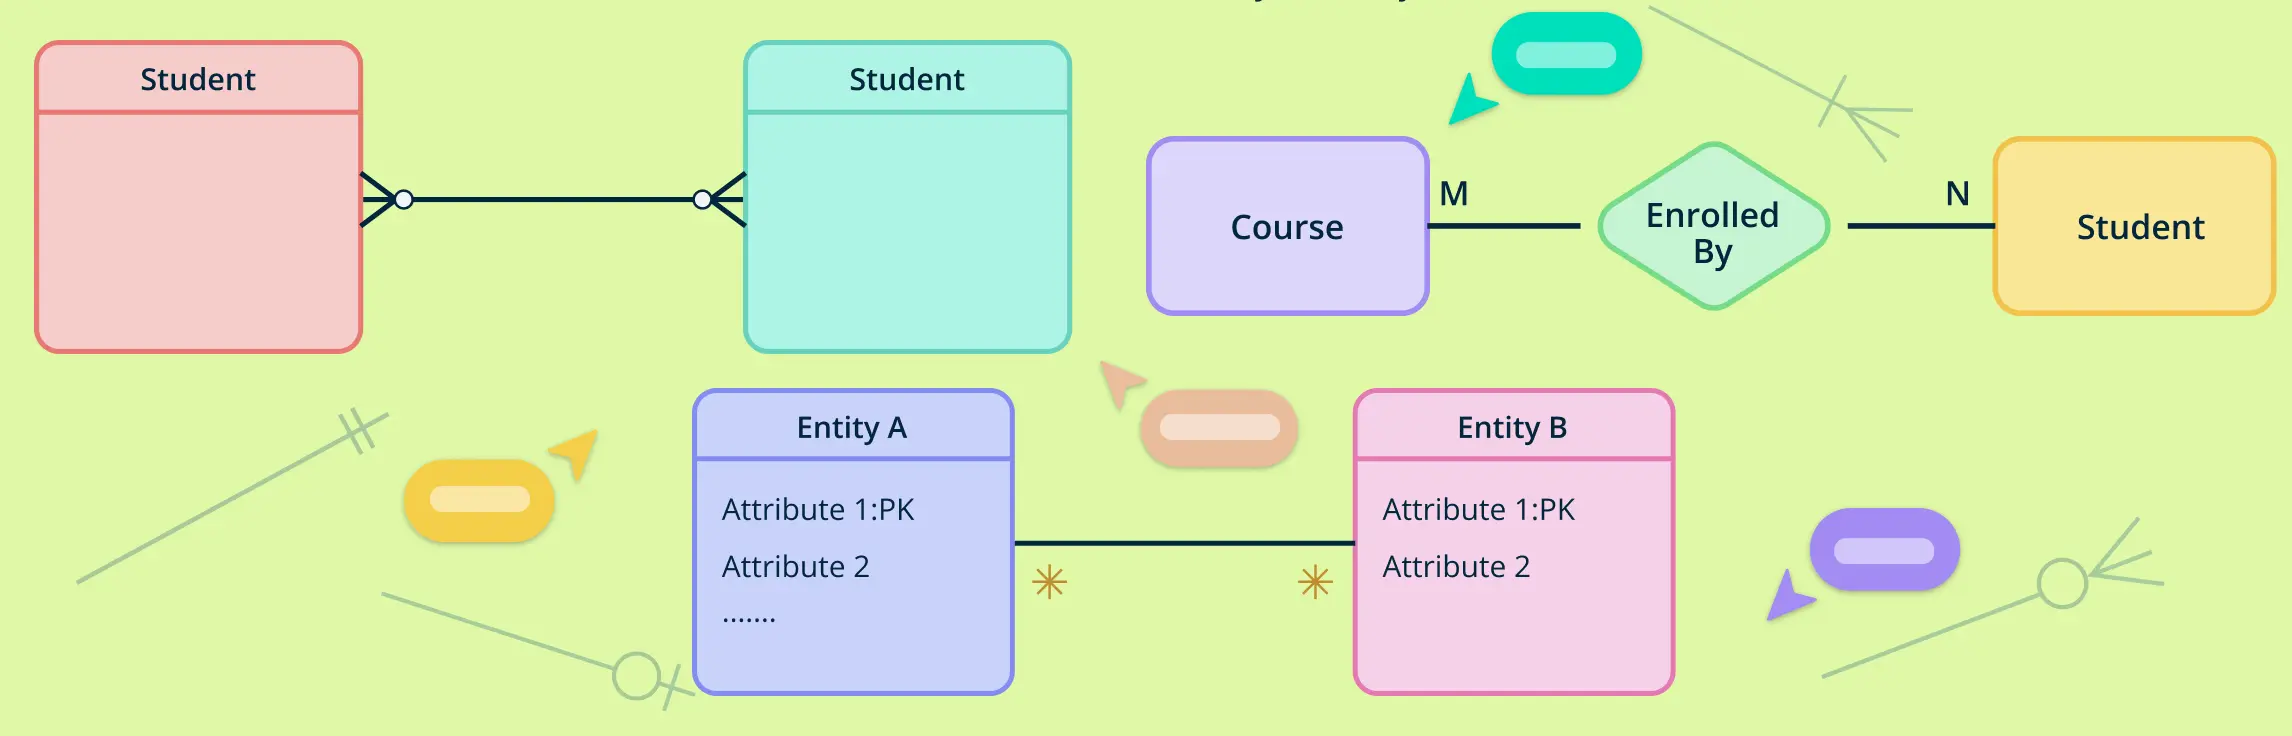
Crow’s Foot Notation
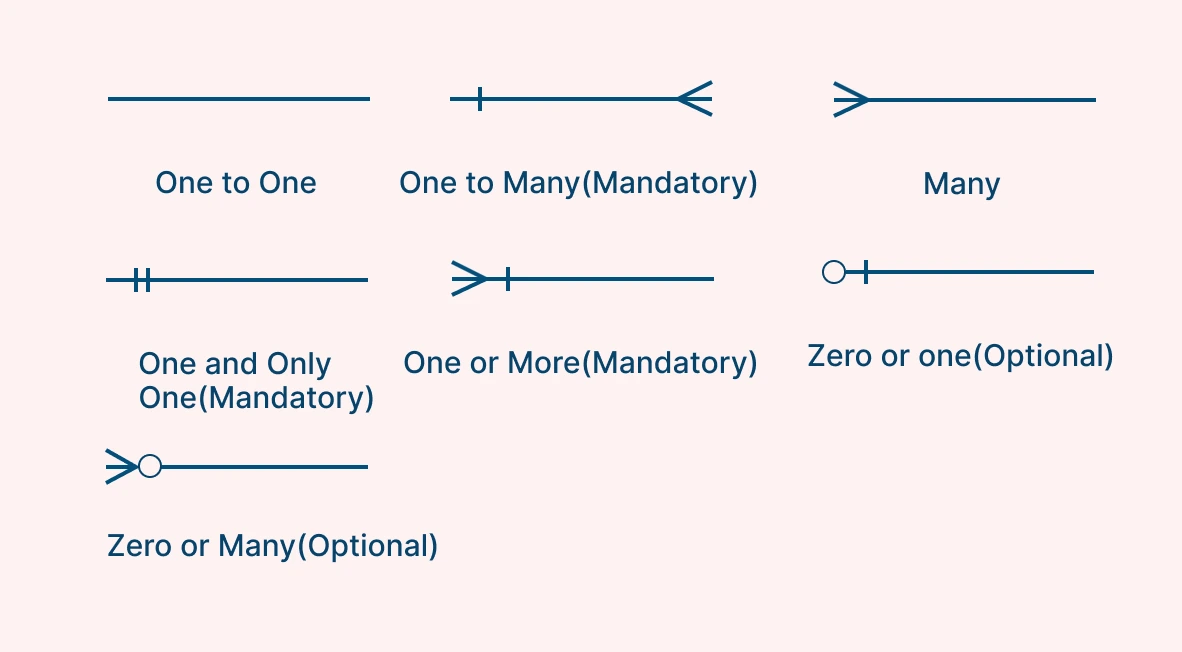
Crow’s Foot notation, also known as Information Engineering notation, is the most widely used ER diagram notation in practical, relational database design. It relies on visual cardinality symbols:
- A crow’s foot (three-pronged line) indicates “many”
- A straight bar (|) means “exactly one”
- A circle (O) denotes “zero or optional”
These symbols are placed at the ends of relationship lines, allowing you to visually distinguish between one-to-one, one-to-many, and many-to-many relationships at a glance.
Use Case: Ideal for technical teams designing detailed, implementation-ready data
UML Notation
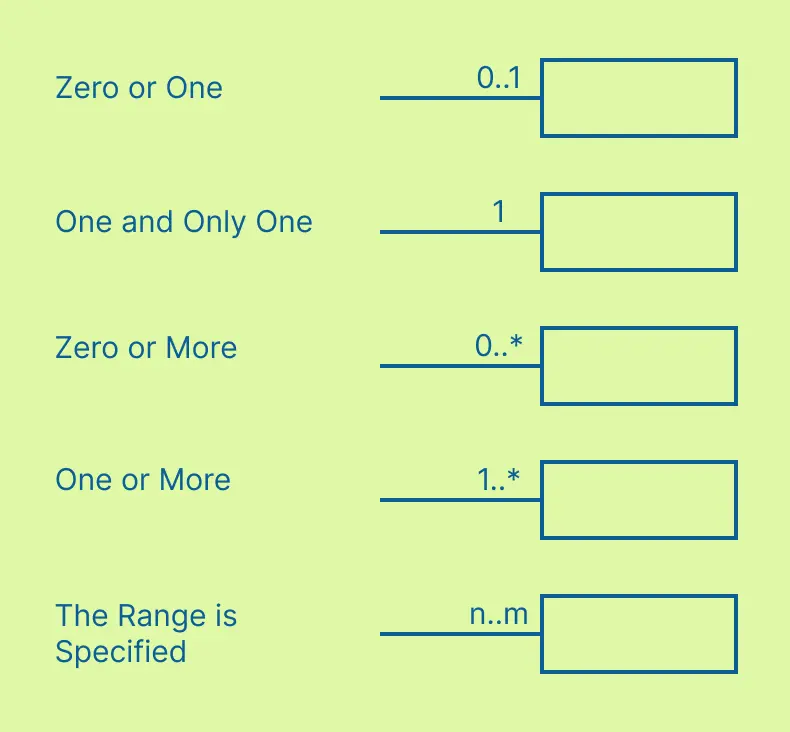
UML (Unified Modeling Language) notation is primarily used in object-oriented software design but also supports entity relationships and cardinality. It represents cardinality symbols using numeric ranges in brackets:
- 1..1 – exactly one (mandatory)
- 0..1 – zero or one (optional)
- 0..* – zero or many
- 1..* – one or many
UML favors minimal visuals and is especially effective when combining data modeling with class diagrams and system design documentation.
Use Case: Best suited for software development environments and systems where data models align with object-oriented logic.
Bachman Notation

Bachman notation, named after Charles Bachman, uses arrows and named relationships to connect entities. It places more emphasis on directionality and often includes a line with a small circle or solid line to indicate cardinality:
- A solid line generally means mandatory
- A circle at the end of a line indicates optional
While less commonly used today, Bachman notation offers a unique top-down visual structure and is still used in some legacy systems and CASE tools.
Use Case: Useful for hierarchical or network database models, particularly in environments using older CASE tools.
Barker’s Notation
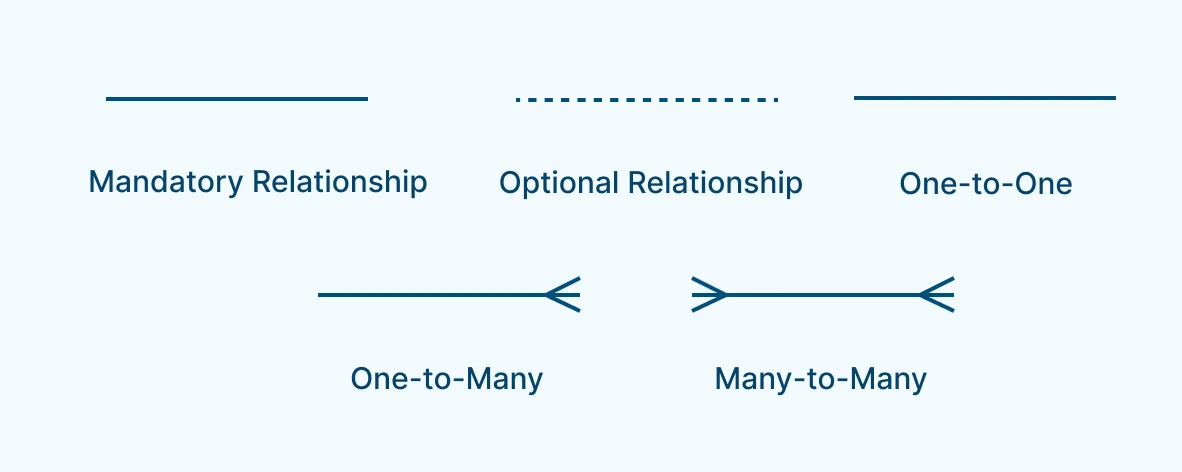
Barker’s notation, developed by Richard Barker, is another ER diagram style that uses boxes for entities and lines with cardinality indicators for relationships. It uses text labels and symbols such as:
- Mandatory relationship → Straight solid line
- Optional relationship → Dotted line
- One-to-one relationship → Single straight line between entities
- One-to-many relationship → Straight line on the “one” side, and a crow’s foot on the “many” side
- Many-to-many relationship → Crow’s foot on both ends of the relationship line
These visual distinctions help database designers instantly recognize the rules governing each relationship between entities. For example, a dotted line with a crow’s foot at one end represents an optional one-to-many relationship, while a solid line with a crow’s foot shows a mandatory one-to-many relationship.
Use Case: Effective for modeling enterprise systems where clear rules around optional and mandatory relationships are needed.
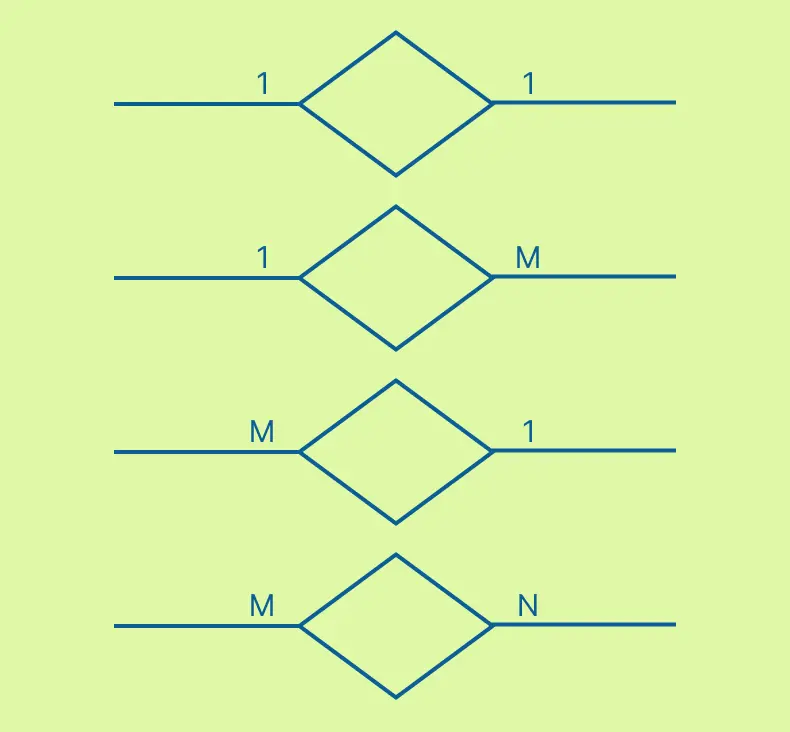
Cardinality Types in ER Diagrams
In ER diagrams, cardinality types define how entities are related to one another based on the number of possible associations. There are three primary cardinality types used in entity-relationship modeling: one-to-one, one-to-many, and many-to-many relationships.
1. One-to-One Relationship
A one-to-one relationship exists when a single instance of one entity is associated with exactly one instance of another entity, and vice versa. This cardinality type is less common but useful in cases where certain attributes are separated for security, performance, or organizational reasons.
For example, each employee might have one unique company ID card, and each ID card is assigned to one employee.
One-to-One Relationship Example
Scenario: Employees and company ID cards.
- Each employee is assigned one unique ID.
- Each ID belongs to only one employee.
2. One-to-Many Relationship
The one-to-many relationship is the most frequently used cardinality type in database design. It indicates that a single instance of one entity can be linked to multiple instances of another entity. However, each instance on the “many” side is associated with only one instance on the “one” side. This cardinality type is foundational in relational database systems.
One-to-Many Relationship Example
Scenario: Customers and orders.
- One customer can place multiple orders.
- Each order is placed by only one customer.
In this one-to-many relationship, the “one” side is the Customer entity, and the “many” side is the Order entity. This cardinality type is essential in business systems like e-commerce platforms, where each customer may initiate numerous transactions over time.
3. Many-to-Many Relationship
A many-to-many relationship occurs when multiple instances of one entity are related to multiple instances of another. This is common in scenarios where both sides can have multiple associations.
Many-to-Many Relationship Example
Scenario: Students and courses.
- A student can enroll in multiple courses.
- Each course can have many students enrolled.
This is a classic many-to-many relationship, where both entities have multiple associations with each other. In ER diagrams, this type of relationship is often broken down using a junction table, often called an intermediate or associative entity(e.g., Enrollment), to handle the complexity.
Ordinality in ER Diagrams: Mandatory vs Optional
While cardinality defines how many instances of one entity relate to another, ordinality focuses on whether the relationship between entities is mandatory or optional. In other words, ordinality determines the necessity of a relationship in an ER diagram.
This concept is critical in data modeling because it defines **relationship constraints, **helping you distinguish between situations where a relationship must exist and those where it may or may not exist.
There are two primary types of ordinality in ER diagrams:
1. Mandatory Ordinality
A mandatory relationship means that the existence of one entity requires the existence of a related entity. This is typically represented by a bar (|) or 1 near the entity in the diagram, depending on the notation used.
Example:
- Each order must be placed by exactly one customer.
- In this case, an order cannot exist without a customer.
This is an example of mandatory ordinality on the “customer” side of the relationship.
2. Optional Ordinality
An optional relationship means that an entity instance may or may not be related to another entity. It is usually represented with a circle (O) or 0 in the cardinality symbol.
Example:
- A customer may or may not place an order.
- This implies that the relationship is optional on the “order” side—customers can exist even if they haven’t placed an order.
ER Diagram Templates with Cardinality Symbols
Creating Entity Relationship Diagrams (ERDs) from scratch can be time-consuming, especially when you’re trying to get cardinalities and relationships just right. That’s why using editable ERD templates with correctly applied cardinality symbols is a great way to save time, avoid errors, and stay focused on your data structure.
Whether you’re modeling a customer database, designing a school management system, or building an inventory system, templates offer a quick starting point with professionally designed relationship layouts. Each ERD template includes clearly defined cardinality types—such as one-to-one, one-to-many, or many-to-many—using standard notations like Crow’s Foot, Chen, or UML.
1. Customer and Orders ER Diagram Examples
Discover Customer and Orders ER Diagram examples that highlight how cardinality symbols define key relationships in retail and ecommerce databases. These diagrams typically feature a one-to-many relationship—where one customer can place multiple orders—clearly illustrated using Crow’s Foot or UML notations. Perfect for CRM systems and sales data modeling, these examples demonstrate how to structure entity relationships accurately and apply the right cardinality symbols for efficient and scalable database design.


2. Employee Management ER Diagram Examples
Explore Employee Management ER Diagram examples that clearly illustrate how cardinality symbols define the relationships between entities such as employees, departments, roles, and ID cards. These diagrams showcase one-to-one and one-to-many relationships—like an employee assigned to one department or holding one unique ID—using notations such as Crow’s Foot and UML. Perfect for designing an efficient employee management system, these examples help you visualize and structure entity relationships accurately while applying the correct cardinality symbols for real-world scenarios.


Read more: 6 ER Diagrams for Employee Management System + Free Templates
3. University Management ER Diagram Examples
Explore University Management ER Diagram examples that demonstrate how cardinality symbols are used to model complex relationships between entities such as students, courses, faculties, departments, and enrollments. These ER diagrams often include one-to-many and many-to-many relationships—for example, one department offers many courses, and students enroll in multiple courses—visualized using notations like Crow’s Foot or Chen. Ideal for academic database design, these examples help clearly map out university data structures with accurate entity relationships and cardinalities.


Read more: 10 ER Diagrams for a University Management System + Free Templates
4. Library Management ERD
The Library Management ERD illustrates how cardinality symbols are used to define relationships between key entities such as books, members, loans, authors, and staff. Common relationships include one-to-many (one member can borrow multiple books) and many-to-many (books written by multiple authors), modeled using Crow’s Foot or UML notation. These ER diagrams are essential for designing efficient library systems, enabling clear visualization of entity relationships and ensuring accurate data organization and tracking within the database.


Read more: ER Diagram for Library Management System + Free Templates
Helpful Resources
Discover ER diagram usage, history, symbols, notations and more.
Quickly create your ER diagrams online, collaborate with your team, maintain and track changes as the design evolves.
Design and visualize database schema with Creately's Entity Relationship Diagram templates.
Find out what Crow’s Foot Notation is, and explore how they bring clarity to the intricate world of entities, attributes, and relationships.
Learn how to illustrate many-to-many relationships in ER diagrams using best practices
Conclusion: Design Smarter ER Diagrams with the Right Cardinality Symbols
Understanding cardinality symbols is essential for building effective and accurate ER diagrams. From defining basic relationships like one-to-many or one-to-one, to choosing the right notation—Chen, Crow’s Foot, or UML, you’ve now got a comprehensive view of how to visually and logically represent data relationships. We’ve also seen how ordinality helps capture whether relationships are optional or mandatory, providing further depth and accuracy in your models. Creately lets you build and visualize ER diagrams with all the right cardinality symbols built in. Get started today!
FAQs About Cardinality Symbols
What is the difference between cardinality and participation?
Can one relationship have multiple cardinalities?
Are cardinality symbols standardized across all ER diagram tools?
How do cardinality symbols help in database normalization?
Do NoSQL databases use cardinality symbols?
Resources:
Frantiska, J. (2017). Entity-Relationship Diagrams. Visualization Tools for Learning Environment Development, pp.21–30. doi:https://doi.org/10.1007/978-3-319-67440-7_4.
Pigott, D.J. and Hobbs, V.J. (2011). Complex knowledge modelling with functional entity relationship diagrams. VINE, 41(2), pp.192–211. doi:https://doi.org/10.1108/03055721111134817.