Org Chart Creator
See Your Entire Org in One Living Workspace
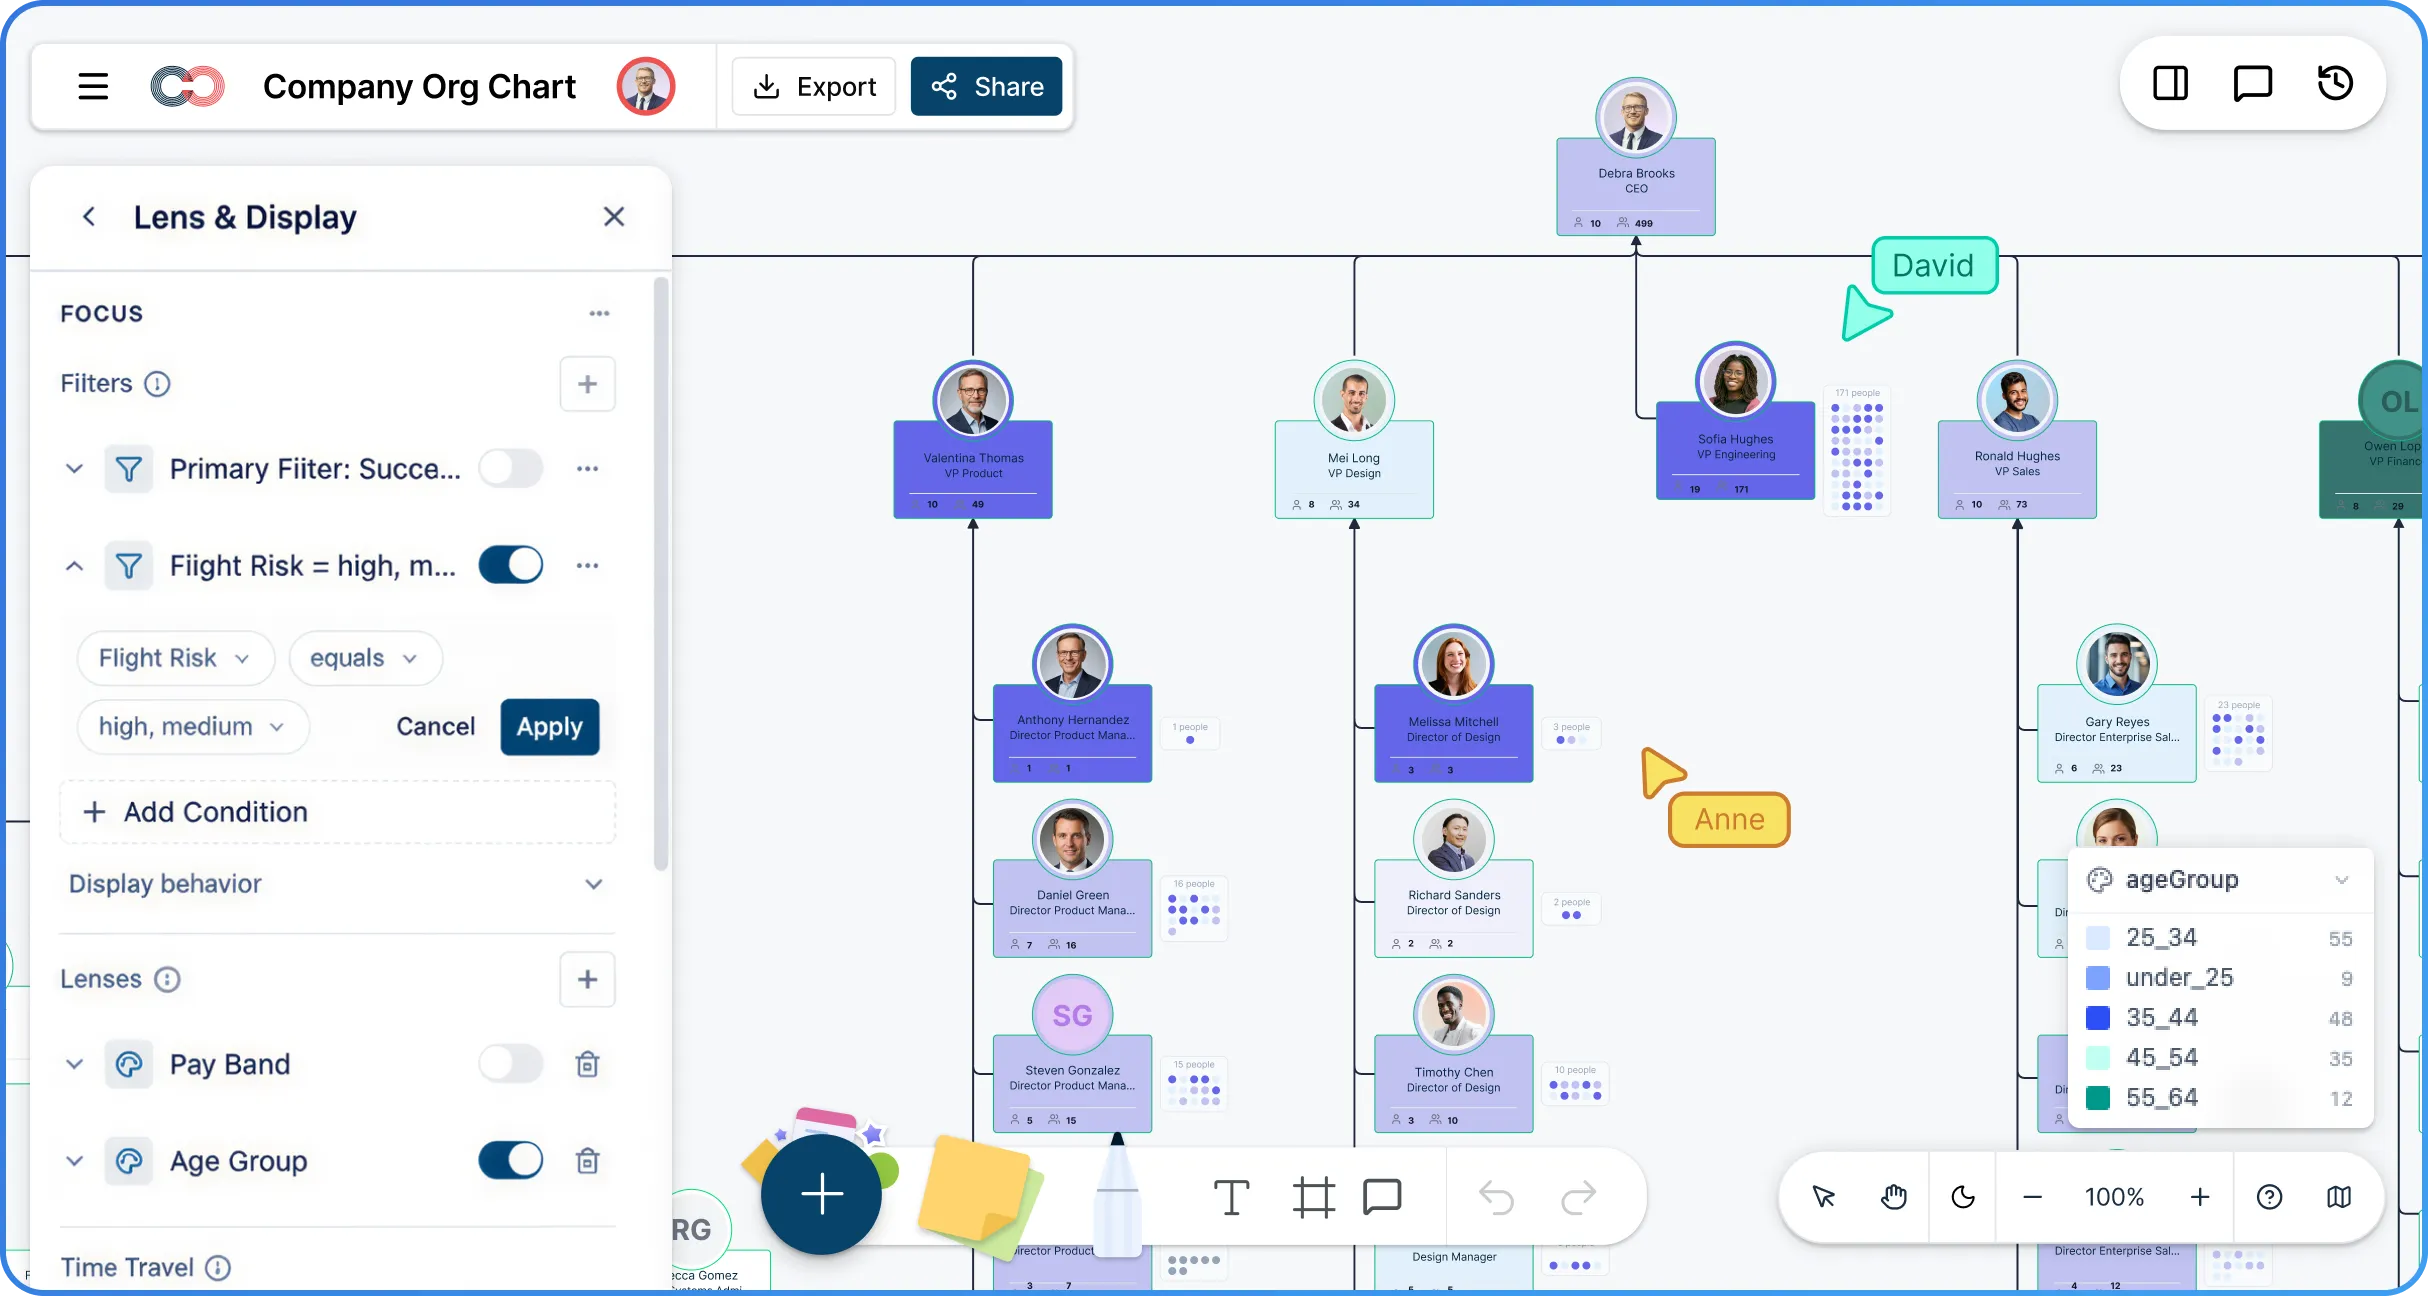
Map reporting lines, analyze compensation and succession risk, model reorganizations, and ask better org questions with AI — all in one living workspace built for planning, not just drawing.
![]() Spreadsheet org charts go stale fast
Spreadsheet org charts go stale fast
Import your data and turn it into a living org chart you can keep current.
![]() Critical people data gets buried in HR systems
Critical people data gets buried in HR systems
Bring structure, compensation, succession, and talent data into one visual workspace.
![]() Reorg and workforce planning are hard to test safely
Reorg and workforce planning are hard to test safely
Model changes in scenarios before applying them to the live org.


 Diagramming Visual Collaboration Org Chart


Why Choose Creately’s Org Chart Software

AI-Powered Org Intelligence
Ask questions in plain language, surface structural risks, and focus the org faster with an AI assistant built for organizational analysis.

Historical Org Views
Use as-of-date views to see what the organization looked like at any point in time, without maintaining manual snapshots.

Scenario-Based Reorg Planning
Create what-if branches, compare options, and review changes before applying them to the live organization.

Built for Sensitive People Data
Protect compensation, succession, and demographic fields with a 6-tier sensitivity model that controls visibility by role.

Views for Analysis, Sharing, and Documentation
Use filters, heatmaps, historical views, exports, and read-only sharing to turn the same org chart into a planning, review, and documentation workspace.

Real-Time Collaboration
Work with leaders and stakeholders in one shared workspace with comments, role-based permissions, and controlled access.
Turn Spreadsheet Data Into a Living Org Chart Fast

Build org charts faster from employee data with smart column mapping and automatic hierarchy generation.
Catch structure issues early with validation for missing IDs, unknown managers, cycles, and empty rows.
Keep your org chart current with inline editing, quick-add reporting lines, and full undo support.
Plan future headcount more clearly by separating people from positions and keeping vacant roles visible.
Reflect real organizations accurately with solid, dotted-line, and matrix reporting relationships.

Keep Succession Planning Connected to the Live Org
Review successor readiness in the context of real reporting lines and team structure.
Keep succession data available without cluttering the org by turning on succession field packs only when needed.
Spot weak pipelines and single points of failure faster by coloring key roles by succession risk.
Run visual talent reviews with 9-box performance and potential context tied back to the org chart.
Focus succession reviews on the right teams with filters, saved views, and collapsible branches.
Protect sensitive succession data with field-level visibility controls by role.
Turn Your Org Chart Into a Compensation Analysis Layer

Spot pay and compa-ratio patterns faster with color-by-field controls, numeric heatmaps, and saved filters.
Compare compensation data across teams and levels while keeping reporting lines visible.
Restrict sensitive pay data to the right users with the 6-tier sensitivity model.
Support merit and pay planning workflows by activating compensation fields only when needed.
Export compensation data to CSV for downstream planning tools, pay reviews, and merit-cycle analysis.

Test Organizational Change Before You Commit to It
Model additions, removals, moves, and updates in named scenarios instead of editing the live chart directly.
Compare before-and-after structures more clearly with scenario overlays and historical context.
Review reorg proposals collaboratively in one shared workspace instead of scattered files.
Keep planning safer by applying or discarding scenario changes only after review.
Use vacant positions and reporting relationships to model future-state structures more realistically.
Explore the Organization With AI

Ask questions like who reports to a leader, which teams have wide spans, or where tenure is concentrated.
Get answers faster with an AI assistant powered by 7 specialized tools that can query the org, apply filters, and generate focused views from one prompt.
Highlight people, roles, and departments instantly on the canvas through plain-language prompts.
Surface structural issues faster with AI that flags orphaned nodes, missing fields, and succession gaps.
Reduce manual analysis by combining AI queries with heatmaps, filters, and saved views.
Keep AI interactions aligned with permissions so restricted data stays protected.

Activate the Data You Need Without Cluttering the Chart
Turn on workforce, succession, compensation, talent, DEI, skills, and other field packs only when they are relevant to the planning task.
Keep the chart readable while expanding the data available in filters, views, and analysis tools.
Surface the right fields where you need them with field packs that appear in properties, filters, and heatmaps without changing the visual layout.
Switch planning lenses without losing data by hiding packs again without deleting what was added.
Analyze the same org through multiple perspectives without rebuilding the chart.
Keep sensitive fields controlled even when more advanced packs are activated.
How to Create an Org Chart in Creately
Import your employee data from CSV
Review and validate the reporting structure
Generate and update the org chart automatically
Activate the right field packs for analysis
Share the org chart, export outputs, or model changes in scenarios
Free Ready-to-Use Org Chart Templates
Use Cases
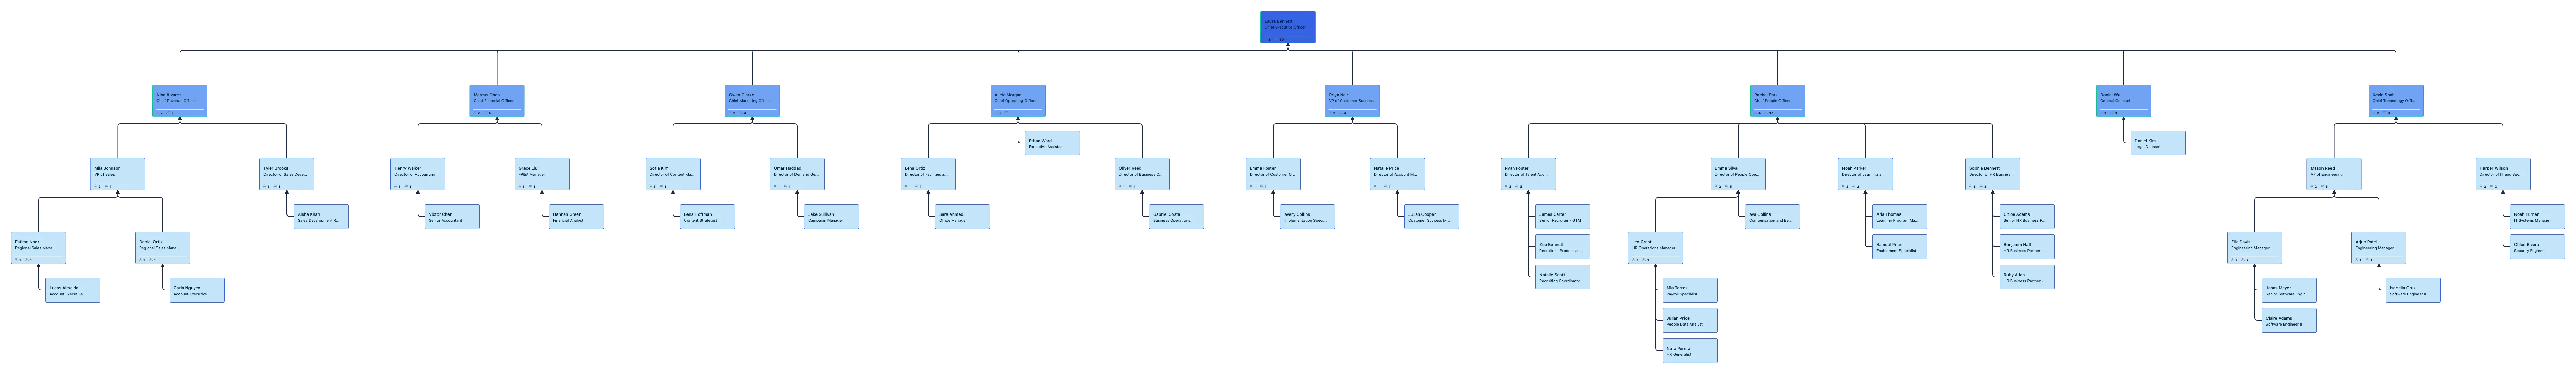
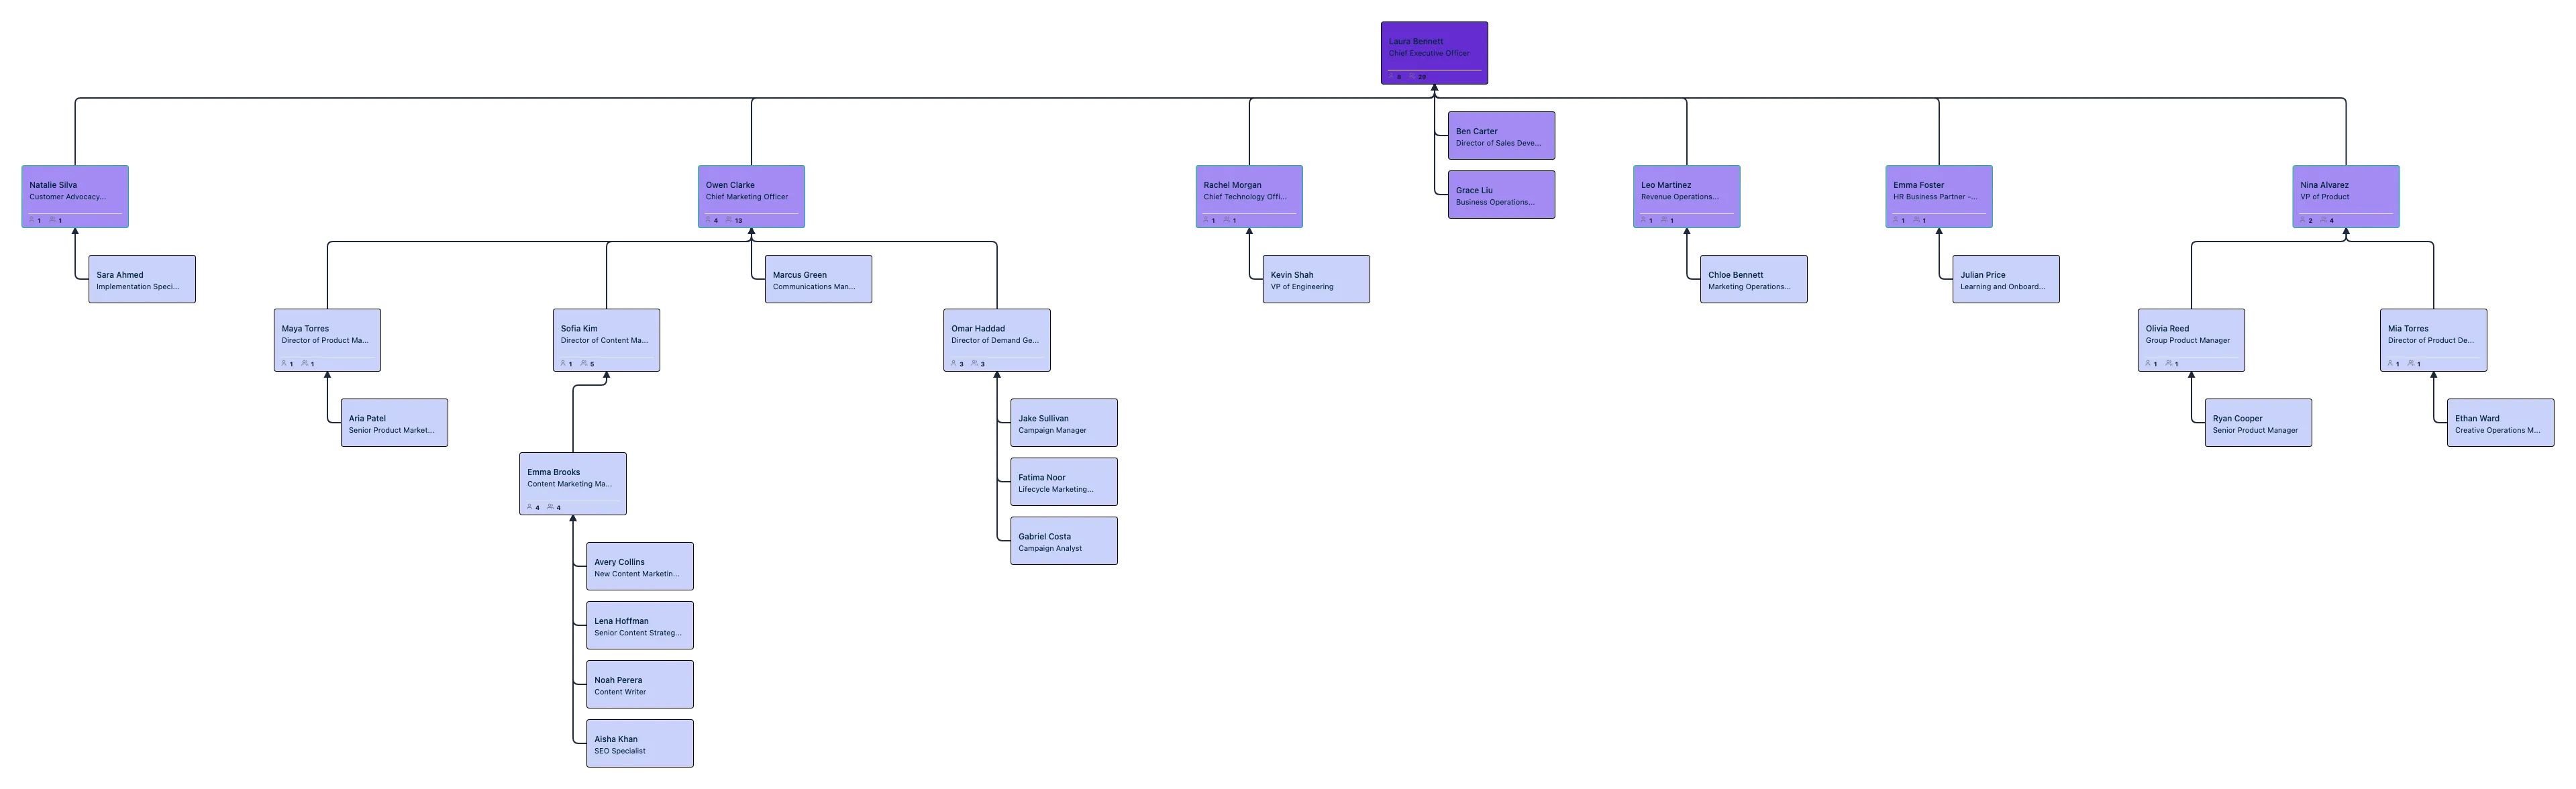
Org Design and Workforce Visibility
Map reporting lines, team structure, and workforce data in one live online org chart instead of scattered systems and static diagrams.
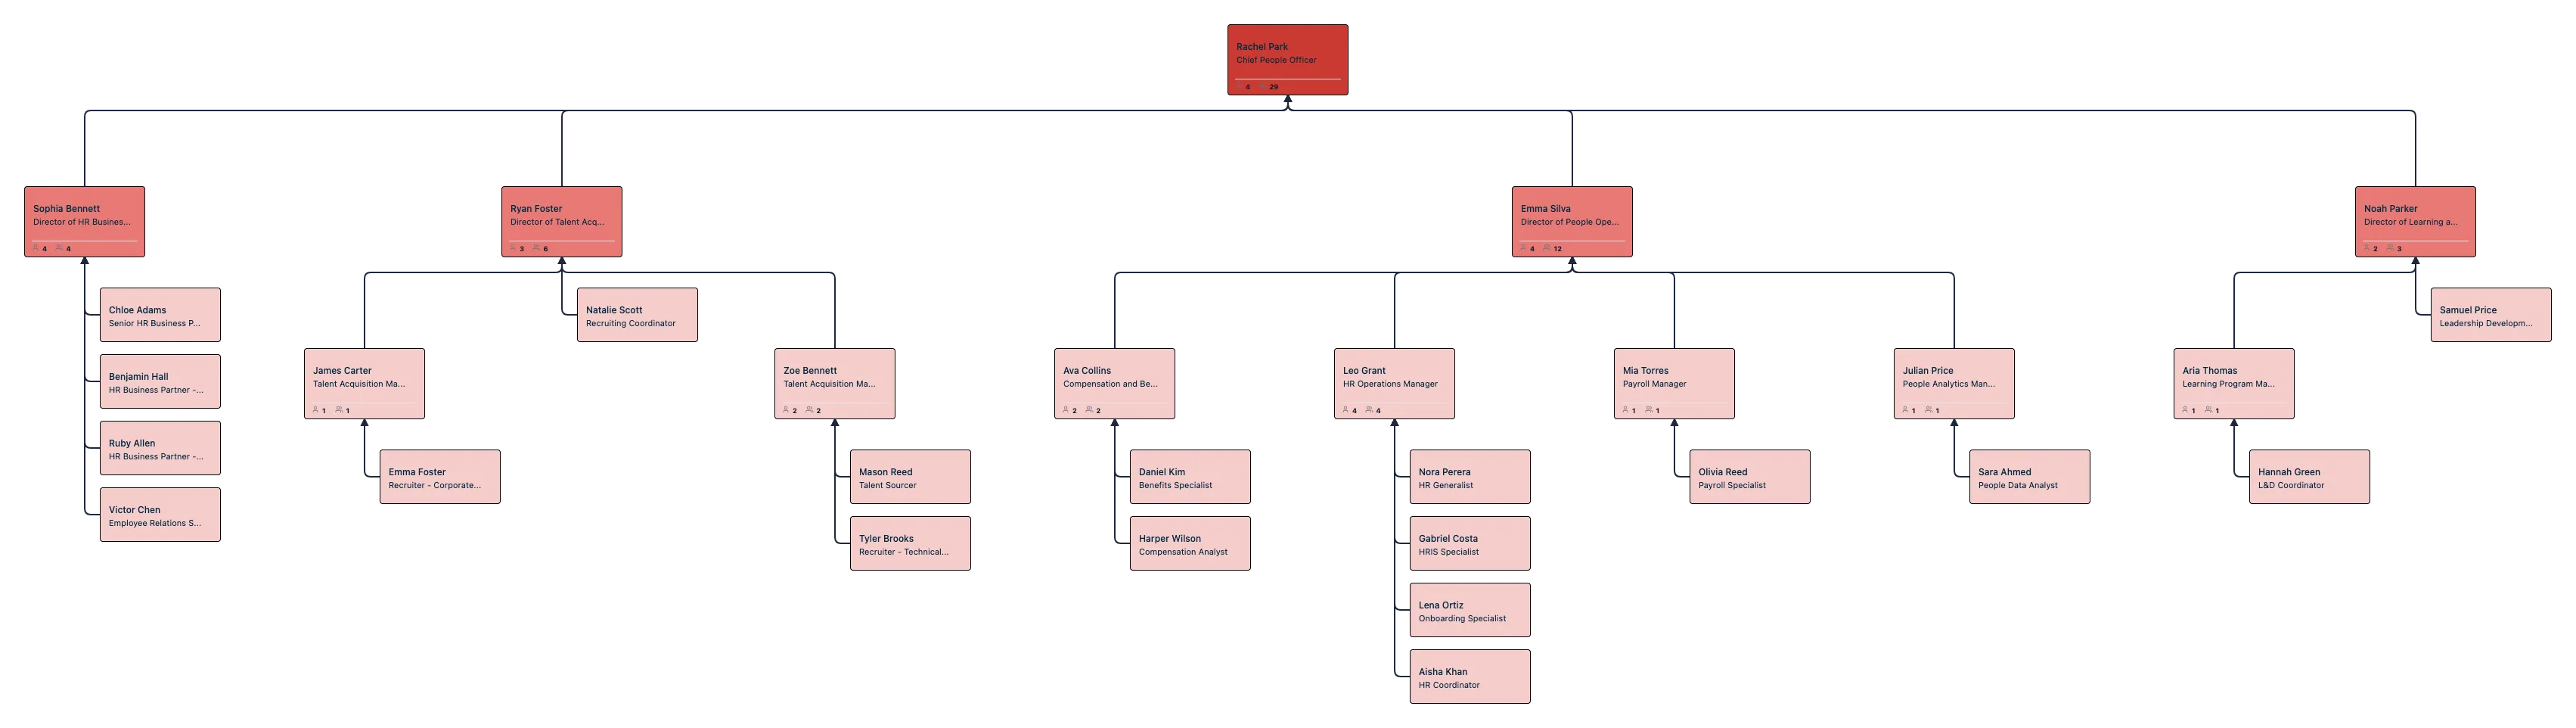
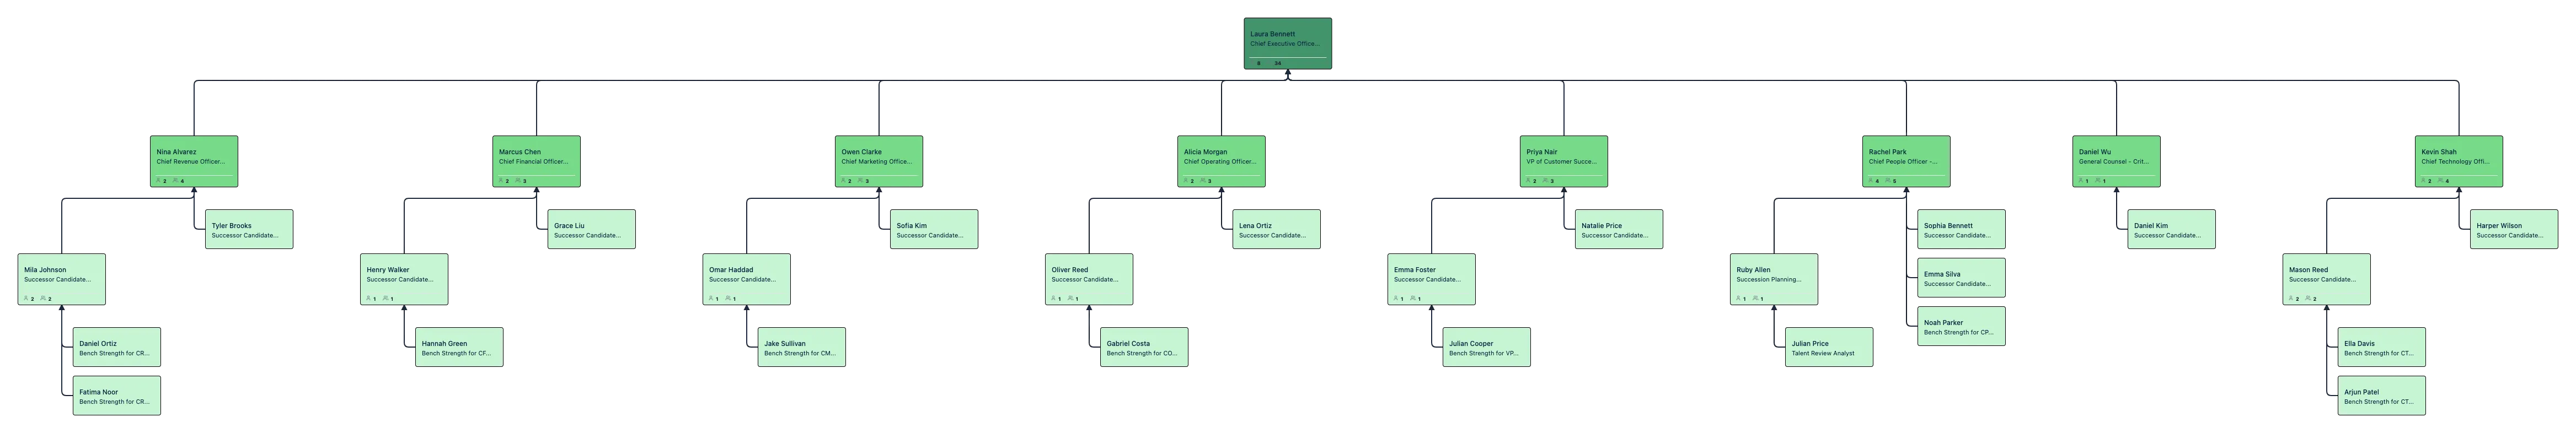
Succession Planning
Track bench strength, successor readiness, and leadership continuity directly on the online Organizational chart.
Compensation Analysis
Review pay-related patterns across teams and levels with compensation fields, filters, and heatmaps.
Reorganization Planning
Model reporting changes in scenarios, compare options safely, and review impact before updating the live org.
Executive and Leadership Reviews
Create presentation-ready org views for leadership, board, and strategic planning discussions.
AI-Powered Org Analysis
Ask the org chart questions in plain language to surface insights, risks, and structural patterns faster.
FAQs About Org Chart Creator
Can I use org chart software for compensation analysis?
Can I model a reorganization without changing the live org chart?
Can I ask questions about my org chart with AI?
How do I protect sensitive people data in an org chart?
Can I see how the organization looked in the past?
What makes Creately different from other org chart tools?


 Instant replies
 Org chart experts
 Real humans