Data Flow Diagram Maker
Easily Design and Model Data Flow Diagrams Online
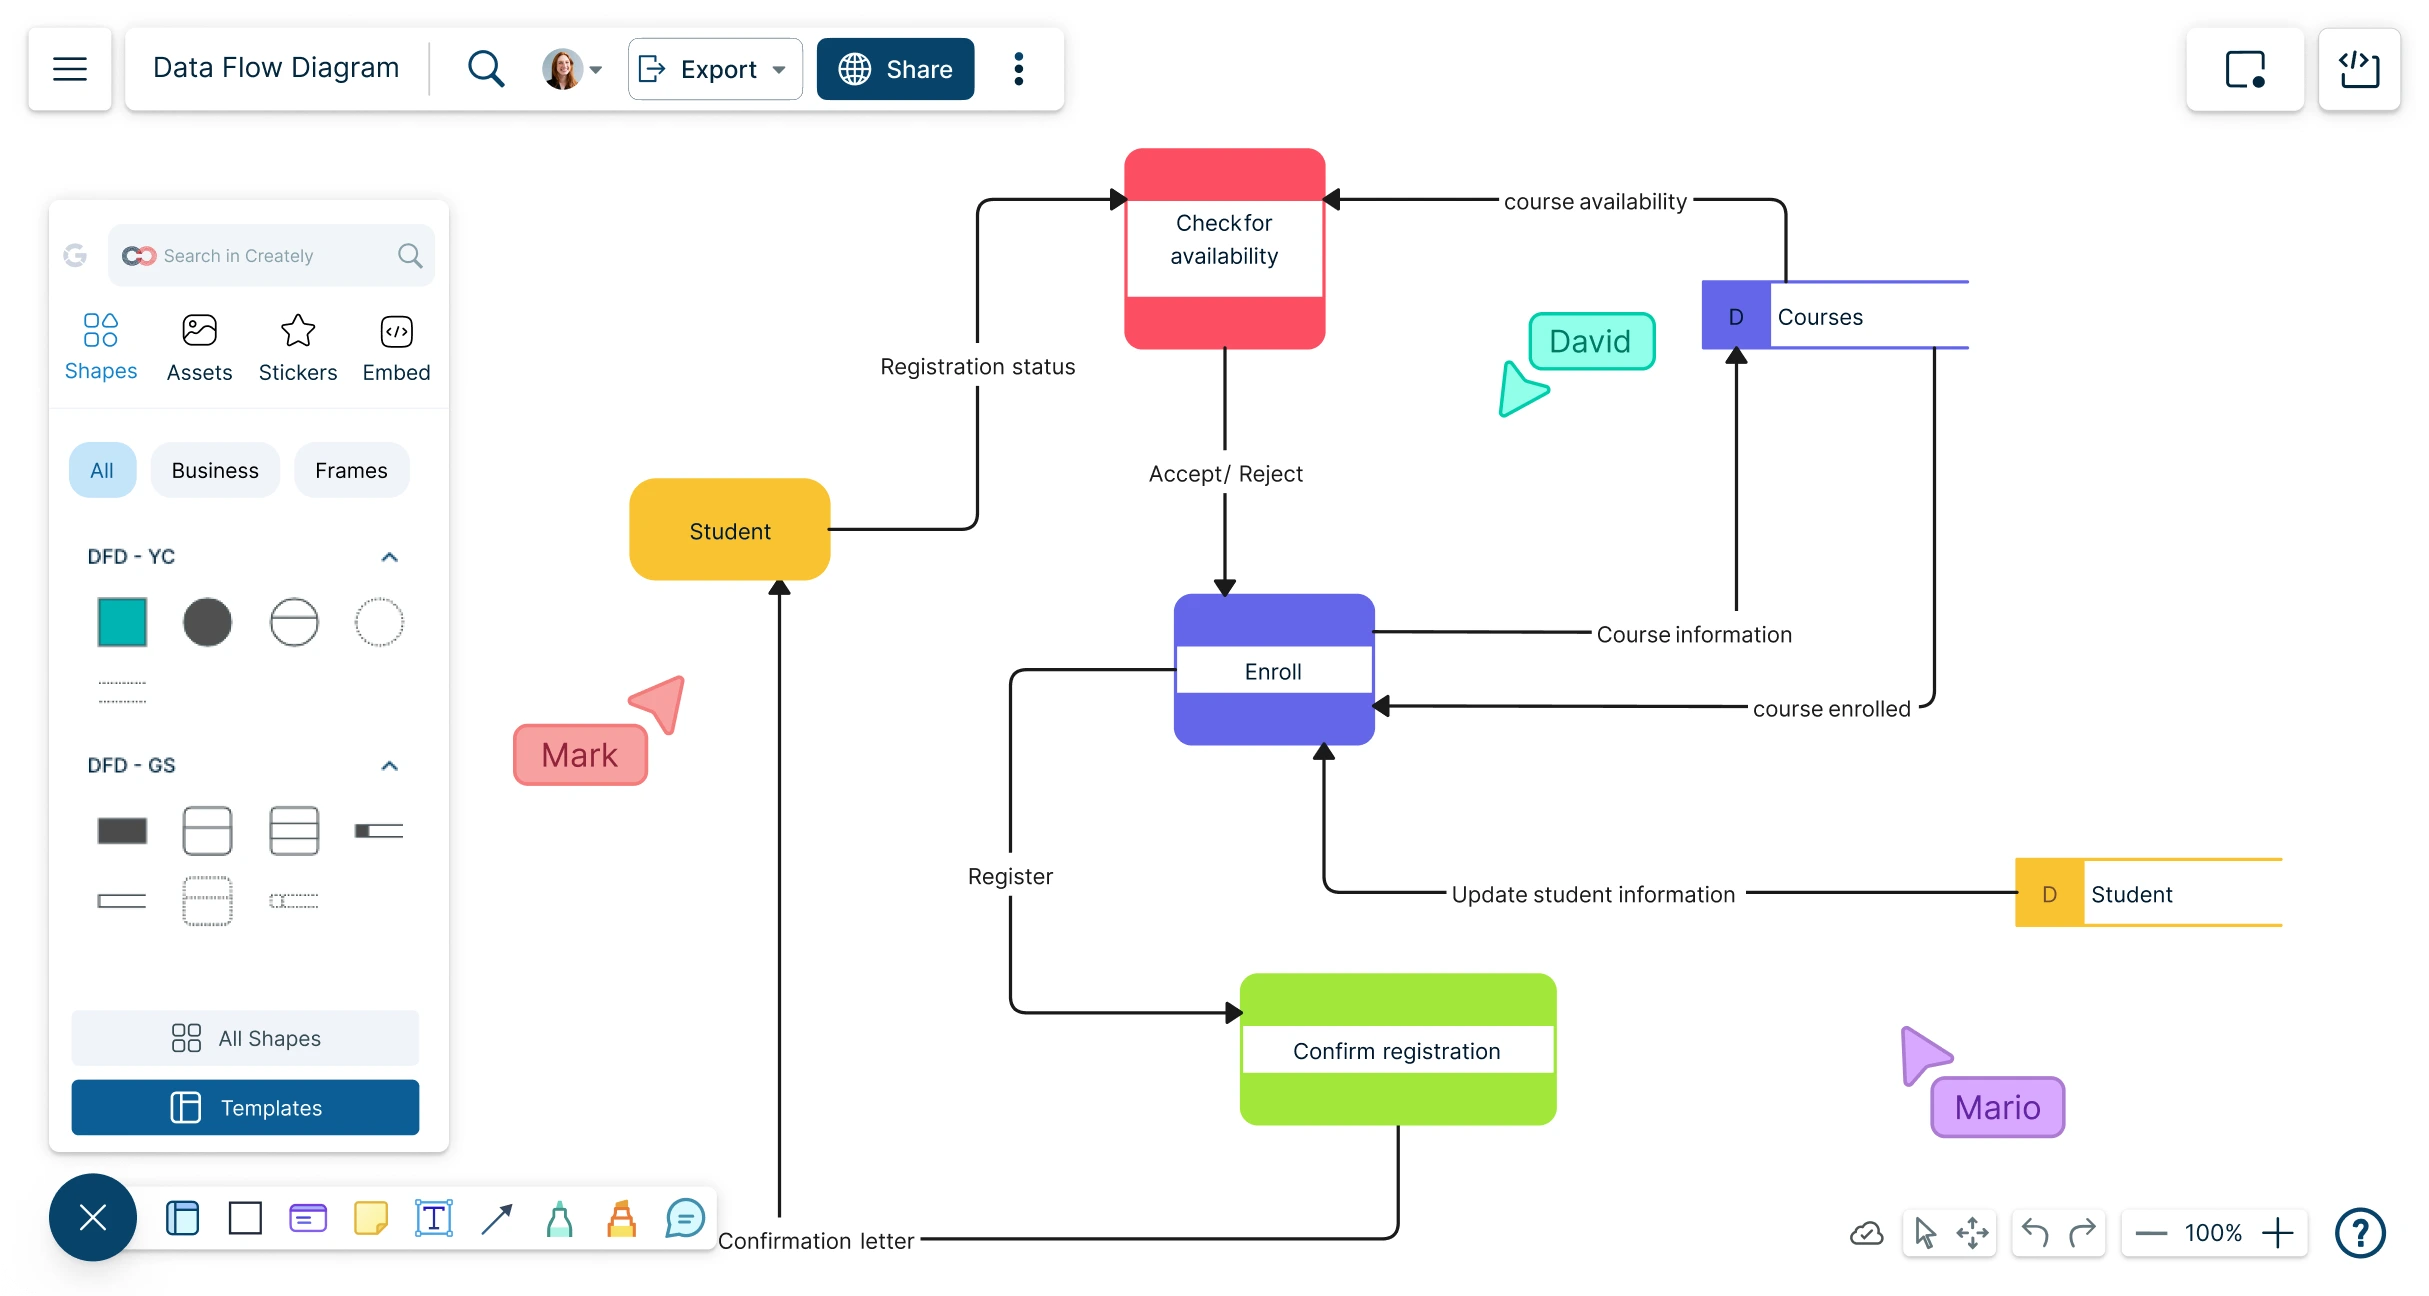
Use Creately’s Free DFD maker to visualize how data flows through systems. Collaborate in real-time with your team to show how data interacts and how it's stored.
- Easy and intuitive interface to draw multi-level DFD diagrams
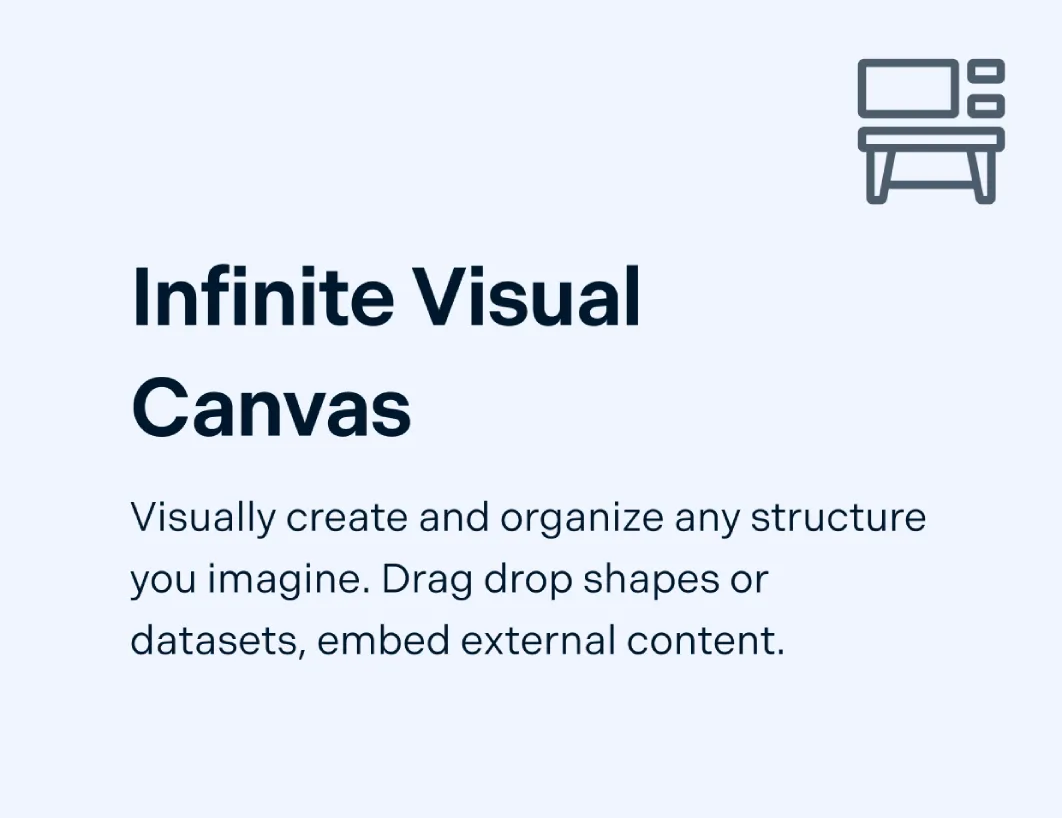
- Infinite canvas to analyze existing systems or model new ones
- Drag-and-drop from standard shape libraries to visualize entities, processes & data stores


 Diagramming Visual Collaboration Org Chart


How to Create a DFD Diagram Online with Your Team?
Open a Data Flow Diagram Template
Launch Creately’s data flow diagram generator and select a DFD template from the library. Invite your team to the workspace to gather information and define your system’s requirements.
Add Processes, Entities & Data Stores
Use the shape library to drag and drop standard DFD symbols such as processes, external entities, data stores, and data flows. If you have a context diagram to map the system at a high level, showing inputs, outputs, and relationships, link this next to your DFD on the same canvas.
Connect & Customize
Use dynamic connectors in the data flow diagram maker to indicate the direction of data flow between processes and entities. Break down into DFD levels (Level 0, Level 1, etc.) to show more detail. Apply preset color themes, layouts, and styles to keep diagrams clear and consistent.
Add Notes
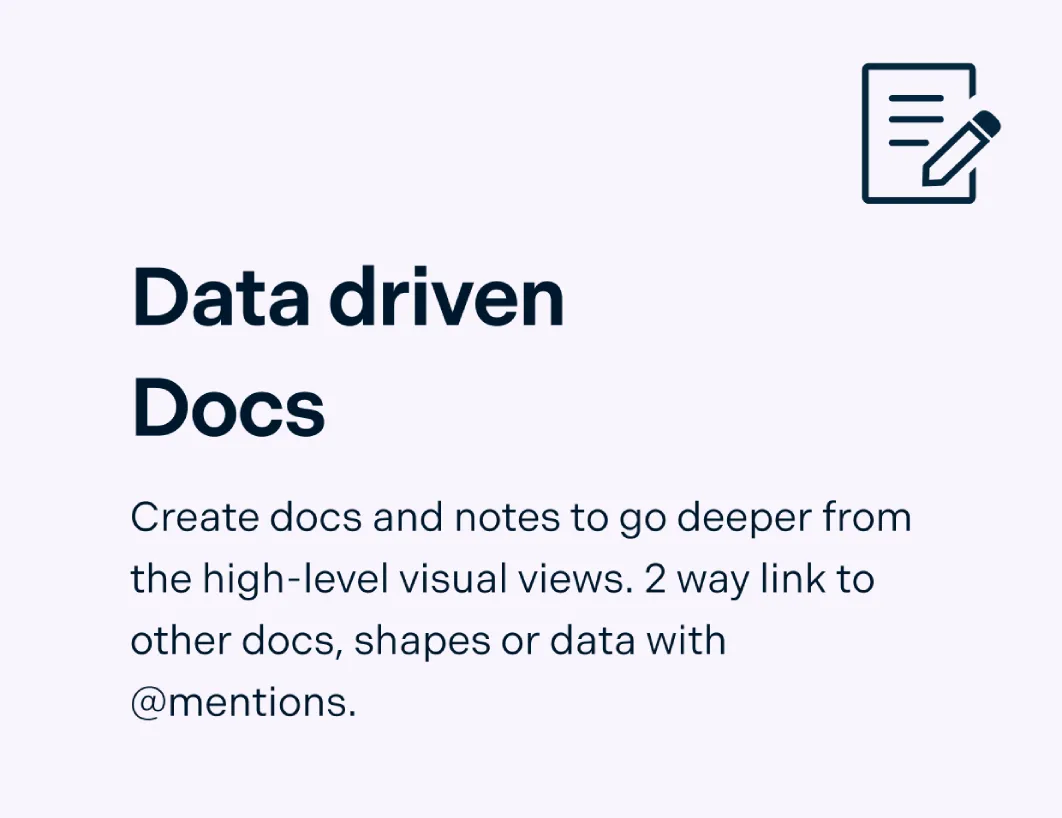
Use the notes panel in the data flow diagram software to attach requirements, IPs, or transformation rules to elements. Use sticky notes for team brainstorming and add links between context diagrams and lower-level DFDs to create a central repository of information.
Review, Update & Share
Invite your team to the DFD diagram maker to collaborate in real time. You can add comments, review changes with version history, and validate accuracy together. Share your finalized DFD via secure link or export to PNG, SVG, PDF, or JPEG. Keep diagrams updated to reflect evolving systems.
Create a Data Flow DiagramHow to make a Data Flow Diagram?


Map and Understand System Data Flows

Use our data flow diagram creator with simple drag-and-drop tools to easily define and map out complex systems.
Access multiple DFD online templates, complete with industry-specific notations, to clearly show how data flows within your system.
Customize with styling and color options to create professional and fully customizable DFDs.
Use the Plus Create feature to intuitively suggest the next shape as you create a data flow diagram seamlessly.

Link and Connect Multiple Data Flows
Use comprehensive shape libraries to detail processes, analyze data flow, and identify areas for improvement.
Create smooth navigation flows using dynamic connectors and advanced linking features.
Use the infinite canvas to draw DFDs online and visualize multiple diagrams in one space for faster analysis and easy reference.
Work Seamlessly on Data Flow Diagrams with Team

Experience real-time collaboration with live cursors, enabling any number of participants to work together on a shared canvas in the DFD online tool.
Use @mention comments directly to facilitate discussions and follow-ups, keeping all communication within the same data flow diagram online.
Easily embed your data flow diagram on any website or share it with team members via email or link invite for quick collaboration and feedback.
What is a Data Flow Diagram?

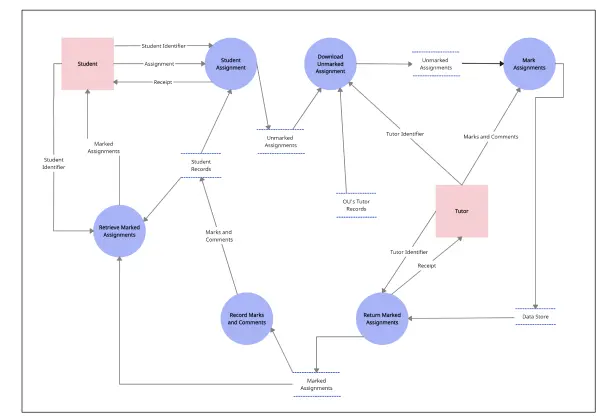
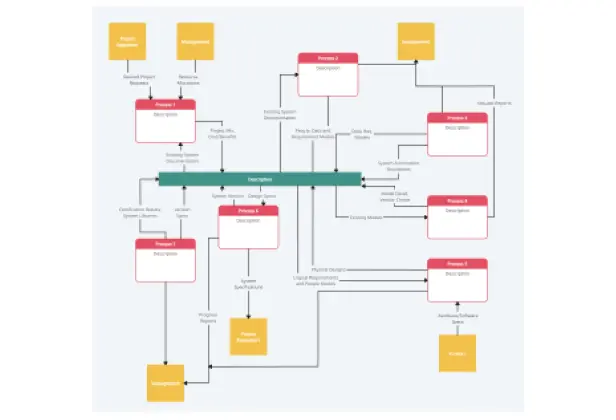
A data flow diagram depicts the way data is processed by a system, the inputs and outputs with a special focus on the information flow and storage. DFD’s describe the movement of data within an information system and visualizes the data processing and transformation activities.
DFDs are used to analyze and design information systems, and can also be used to identify potential bottlenecks and areas for improvement. They are commonly used in software development, business process modeling, and system design.
How to Create a DFD Diagram Online with Your Team?
Open a Data Flow Diagram Template
Launch Creately’s data flow diagram generator and select a DFD template from the library. Invite your team to the workspace to gather information and define your system’s requirements.
Add Processes, Entities & Data Stores
Use the shape library to drag and drop standard DFD symbols such as processes, external entities, data stores, and data flows. If you have a context diagram to map the system at a high level, showing inputs, outputs, and relationships, link this next to your DFD on the same canvas.
Connect & Customize
Use dynamic connectors in the data flow diagram maker to indicate the direction of data flow between processes and entities. Break down into DFD levels (Level 0, Level 1, etc.) to show more detail. Apply preset color themes, layouts, and styles to keep diagrams clear and consistent.
Add Notes
Use the notes panel in the data flow diagram software to attach requirements, IPs, or transformation rules to elements. Use sticky notes for team brainstorming and add links between context diagrams and lower-level DFDs to create a central repository of information.
Review, Update & Share
Invite your team to the DFD diagram maker to collaborate in real time. You can add comments, review changes with version history, and validate accuracy together. Share your finalized DFD via secure link or export to PNG, SVG, PDF, or JPEG. Keep diagrams updated to reflect evolving systems.
Create a Data Flow DiagramCreate Data Flow Diagrams Easily and Faster with these Premade Templates
FAQs About the DFD Maker in Creately
Who uses data flow diagrams?
What are the different data flow diagram levels?
- Level 0 (Context diagram) is the broad overview of the system.
- Level 1 (Process decomposition) breaks the context into sub-processes.
- Level 2 (Detailed view) is a deeper dive into Level 1 sub-processes.
- Level 3+ is rarely used, very detailed and complex.
Does Creately include data flow diagram symbols and standards?
Can I customize my data flow diagram in Creately?
Is Creately’s data flow diagram creator free to use?
What are Creately’s best features for building data flow diagrams?
- Drag-and-drop builder for multi-level diagrams.
- Standards-compliant shape libraries.
- Ready-made templates and examples.
- Real-time collaboration with your team.
- Easy export to PNG, PDF, and SVG.