When problems arise, pinpointing the real cause can be challenging. Instead of guessing, teams need a structured way to analyze issues and find effective solutions. That’s where the right tools come in. In this guide, we’ll explore what is a fishbone diagram and how a fishbone diagram helps break down problems, uncover root causes, and improve decision-making. You’ll also find insights on its benefits, uses, and templates to help you get started right away.
What Is a Fishbone Diagram?
A fishbone diagram is a simple tool for identifying the root cause of a problem by visually organizing potential causes. It gets its name from its shape, which resembles a fish skeleton—the problem is placed at the “head,” while the “bones” branching out represent different categories of causes. This structured approach helps teams avoid assumptions and focus on analyzing every possible factor contributing to the issue.
Also known as an Ishikawa diagram (after its creator, Kaoru Ishikawa) or a cause-and-effect diagram, this method is widely used in business, marketing, manufacturing, healthcare, education, and process improvement. By grouping possible causes into categories—such as people, processes, materials, or technology—teams can systematically explore patterns and pinpoint what needs to be addressed.
Unlike simple brainstorming, a fishbone diagram provides a structured way to think critically about a problem rather than just treating symptoms. Whether you’re troubleshooting a product defect, improving customer service, or fixing a workflow, a fishbone diagram helps you get to the root of the issue quickly and logically by streamlining the steps of a root cause analysis.
What is a fishbone diagram? Think of it as detective work. Instead of making random guesses about why something went wrong, this tool helps you lay out all possibilities, connect the dots, and find the real culprit.
Structure of a Fishbone Diagram
Now that you know what is a fishbone diagram, let’s understand its structure. A fishbone diagram is designed to visually organize the causes of a problem, making it easier to see connections and find the root cause. Here’s how it’s structured:


Visual layout and components
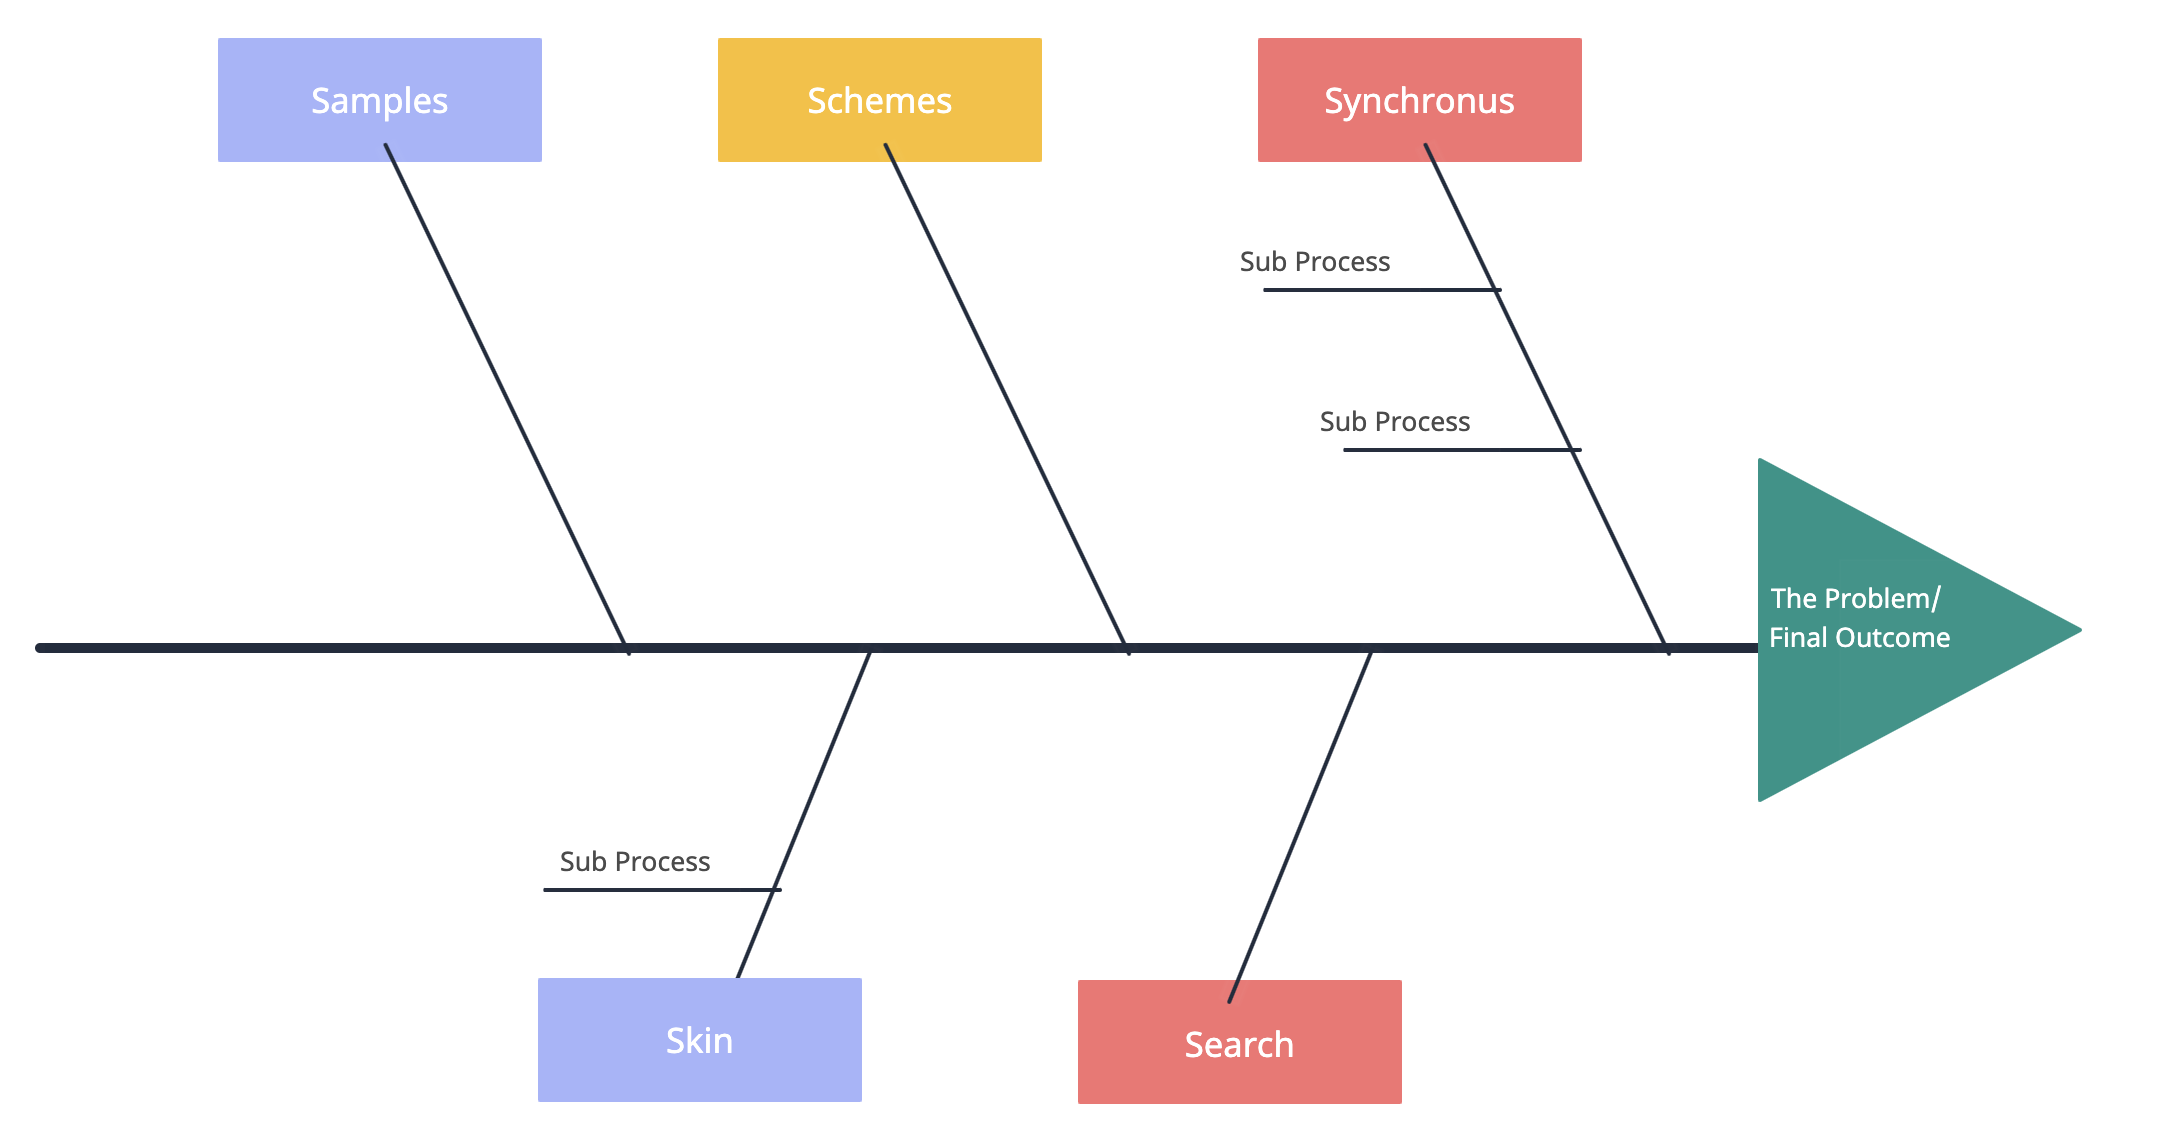
The diagram looks like a fish skeleton. The head represents the problem you’re trying to solve, while the bones branching out from the spine represent different possible causes. Each bone can have sub-branches that go deeper into specific factors contributing to the issue.
Explanation of the head (problem statement)
The head of the fishbone diagram is where you write the problem clearly and specifically. This ensures that everyone is focused on the same issue. For example, instead of writing “low sales,” a more specific problem statement might be “decrease in online sales over the past three months.” The clearer the problem, the easier it is to identify the right causes.
Description of bones (major cause categories)
The bones branching from the spine represent major categories of causes. These categories change depending on the situation. For example:
- In manufacturing, common categories include materials, machines, methods, manpower, measurement, and environment (often called the 6 Ms).
- In service industries, categories might be policies, procedures, people, place, and technology.
- In marketing, the categories could focus on product, price, place, promotion, and customer experience.
These broad categories help organize brainstorming and prevent teams from overlooking key factors.
Illustration of sub-branches (specific causes)
Each major category can have sub-branches that go deeper into possible causes. For example, under “manpower,” a cause might be “lack of training,” and under “methods,” a cause might be “unclear process instructions.” By adding these details, you can trace back to the root of the problem instead of just guessing.
This structure makes the fishbone diagram a powerful tool for identifying real problems—not just surface-level issues. It encourages teams to think critically and find practical solutions that lead to long-term improvements.
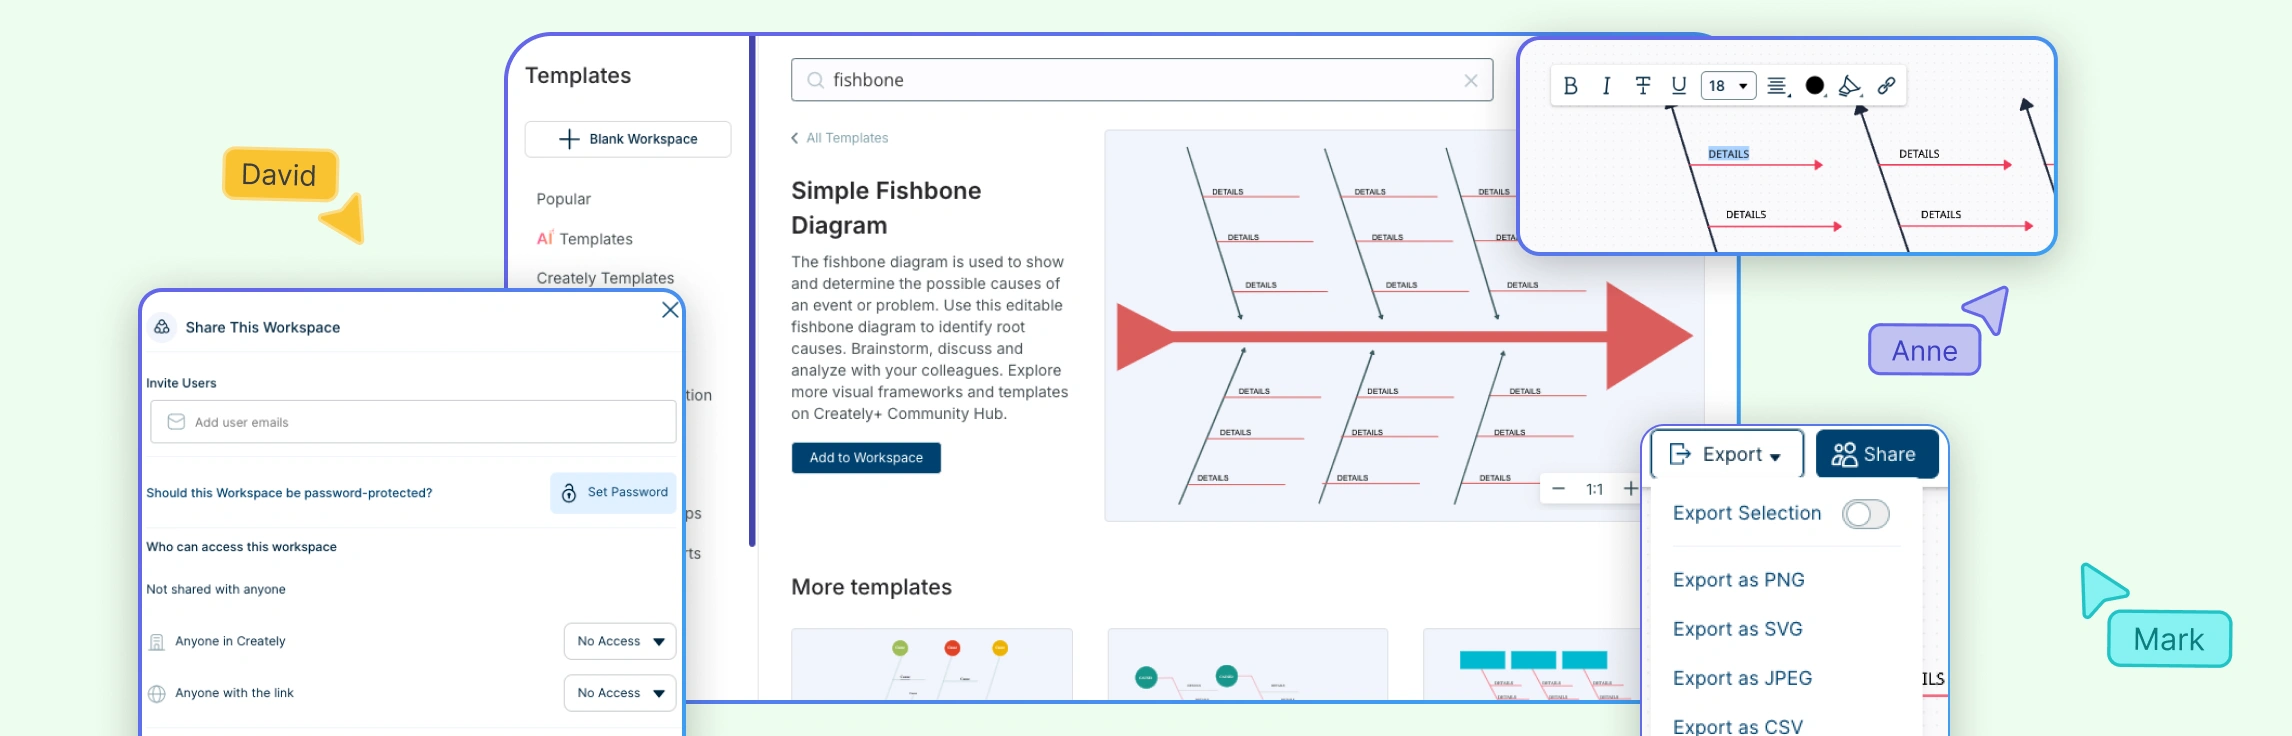
Fishbone Diagram Templates
Ready to create your fishbone diagram? Templates make it easy to get started. With a structured layout, you can focus on identifying causes and finding solutions. Below, you’ll find customizable fishbone diagram templates to fit your needs and simplify the process.
Blank Fishbone Diagram Template

Simple Fishbone Diagram Template

Problem Solving Fishbone Diagram Template

Fishbone Diagraam Template for Sales
Fishbone Diagraam Template for Root Cause Analysis

Common Types of Fishbone Diagrams
Fishbone diagrams can be adapted for different industries by changing the categories of causes. While the structure remains the same, the way causes are grouped can vary depending on what you’re analyzing.
- 4S fishbone diagram – Often used in service industries, this version focuses on surroundings, suppliers, systems, and skills to uncover issues in customer service, business operations, and other non-manufacturing fields.

- 6M fishbone diagram – A go-to for manufacturing and engineering, this type examines causes related to materials, machines, methods, manpower, measurement, and mother nature (environment) to troubleshoot production and quality control problems.

- 8P fishbone diagram – Common in marketing and business strategy, this variation looks at product, price, place, promotion, people, process, physical evidence, and performance to identify issues in branding, sales, and customer experience.

Each type provides a different way to structure problem-solving based on industry needs. If you want to dive deeper into how these variations work and when to use them, check out our full guide on types of fishbone diagrams.
What Is the Purpose of a Fishbone Diagram
The purpose of a fishbone diagram is to help teams find the real cause of a problem instead of just treating its symptoms. By organizing possible causes in a clear, visual way, it makes complex issues easier to understand and solve. The diagram breaks down problems into different categories—like people, processes, materials, or technology—so teams can see all contributing factors at a glance.
Instead of guessing why something went wrong, a fishbone diagram helps teams think critically, spot patterns, and focus on real solutions. It’s especially useful in business, healthcare, manufacturing, and education, where improving processes and preventing future issues is key. Whether fixing a product defect, improving customer service, or streamlining operations, this tool helps teams work smarter by identifying and addressing the root cause of problems.
Fishbone Diagram Example
Let’s look at a fishbone diagram example to help you better understand what is a fishbone diagram. Let’s say a restaurant is struggling with negative customer reviews about slow service. The management wants to find out what’s causing the delays and how to fix them.
Step 1: Define the problem
The restaurant team writes the problem at the head of the fishbone diagram: “Long wait times for customers.”
Step 2: Identify major cause categories
Since this is a service-related issue, they use the 4S fishbone diagram, with four main categories:
- Surroundings – The restaurant’s physical space and environment
- Suppliers – Issues with ingredient deliveries or stock availability
- Systems – Processes for taking orders, cooking, and serving food
- Skills – Staff experience, training, and efficiency
Step 3: Brainstorm specific causes
For each category, the team adds possible reasons for slow service:
- Surroundings: Poor kitchen layout slows down food prep
- Suppliers: Late ingredient deliveries cause menu delays
- Systems: Orders get mixed up because of outdated POS software
- Skills: New servers take longer to process orders
Step 4: Find the root cause and take action
By looking at the diagram, the restaurant realizes that outdated ordering software and an inefficient kitchen layout are the biggest contributors to slow service. They decide to upgrade their POS system and reorganize the kitchen for better workflow.
This example shows how a fishbone diagram helps teams visually break down a problem, see patterns, and focus on the real causes—leading to smarter, long-term solutions.
Advantages and Disadvantages of Fishbone Diagrams
A fishbone diagram is a great tool for problem-solving, but like any method, it has its strengths and limitations. Here’s a closer look at both:
Advantages of fishbone diagrams
1. Helps identify root causes
Instead of just addressing symptoms, a fishbone diagram encourages teams to dig deeper and find the actual cause of a problem. This leads to more effective solutions.
2. Organizes complex information
When multiple factors contribute to an issue, it can be overwhelming. The structured format of a fishbone diagram helps break down causes into clear categories, making analysis easier.
3. Encourages teamwork and brainstorming
Since a fishbone diagram works best when created collaboratively, it brings teams together to share insights and different perspectives. This often leads to fresh ideas and well-rounded solutions.
4. Works for various problems
Whether you’re troubleshooting business challenges, improving processes, or diagnosing issues in manufacturing, healthcare, or education, a fishbone diagram is flexible enough to apply in different fields.
5. Visually simple yet powerful
The diagram presents a lot of information in a clear, visual format, making it easier for teams and stakeholders to understand the problem at a glance.
Disadvantages of fishbone diagrams
1. Doesn’t prioritize causes
While a fishbone diagram helps list all possible causes, it doesn’t rank them in terms of importance or likelihood. Additional analysis is needed to determine which factor is most responsible for the issue.
2. Can become too complex
If a problem has many contributing factors, the diagram can quickly get cluttered and hard to read. Without proper organization, it might feel overwhelming rather than helpful.
3. Requires group input
A fishbone diagram is most effective when built through teamwork and discussion. If key people aren’t involved, important causes might be missed, leading to incomplete analysis.
4. Doesn’t provide solutions
The diagram helps identify why a problem is happening, but it doesn’t suggest how to fix it. Teams still need to take the next step in developing and implementing solutions.
5. Potential for assumptions and bias
Sometimes, teams may list causes based on opinions rather than actual data, leading to incorrect conclusions. To be effective, the diagram should be supported by facts and evidence.
History of Fishbone Diagrams
The fishbone diagram was created by Kaoru Ishikawa, a Japanese quality control expert, in the 1960s. He developed this tool to help businesses and manufacturing teams analyze problems in a structured way and improve their processes.
Ishikawa introduced the diagram while working with Toyota to improve production quality. At the time, Japanese industries were focused on continuous improvement (Kaizen), and there was a growing need for simple but effective problem-solving methods. The fishbone diagram became a key tool in this effort, helping teams visually organize the causes of defects, inefficiencies, and other challenges.
Over time, the use of fishbone diagrams expanded beyond manufacturing. Today, they are widely used in healthcare, education, project management, marketing, and even daily decision-making. The method has remained popular because it helps teams break down complex problems, find root causes, and develop better solutions—all in an easy-to-understand format.
Even though it was created decades ago, the fishbone diagram is still one of the most effective and widely used problem-solving tools today.
When to Use a Fishbone Diagram
A fishbone diagram is useful anytime you need to find the root cause of a problem and organize possible reasons in a clear, structured way. Here are some common situations where this tool can help:
1. When a problem keeps happening
If the same issue keeps coming back despite multiple fixes, a fishbone diagram helps you look beyond quick fixes and find what’s really causing it.
2. When there are many possible causes
Some problems are simple, but others have multiple factors contributing to them. A fishbone diagram helps break down these causes into categories, making it easier to analyze.
3. When you need a team-based approach
Whether in business, healthcare, or education, a fishbone diagram works best when different people share their insights. It encourages brainstorming and ensures no important factor is overlooked.
4. When you’re improving a process
If you’re trying to make a system more efficient—whether it’s a production line, a customer service workflow, or a marketing campaign—a fishbone diagram helps identify areas for improvement.
5. When data alone isn’t enough
Sometimes, numbers and reports don’t tell the full story. A fishbone diagram helps teams visually organize their thoughts and discuss factors that might not be obvious from raw data.
6. When you need a structured way to solve problems
Instead of randomly listing possible causes, a fishbone diagram gives a clear format to follow. This makes discussions more focused and helps teams move from problem identification to action planning.
How to Use a Fishbone Diagram for Problem-Solving and Root Cause Analysis
A fishbone diagram is one of the seven basic quality tools used to analyze problems and identify their root causes. It helps teams break down complex issues into structured categories, making it easier to spot patterns and connections.
In Six Sigma, fishbone diagrams play a key role in the “analyze” phase of the DMAIC (Define, Measure, Analyze, Improve, Control) approach. During this phase, teams use the diagram to systematically explore possible causes of a problem before deciding on improvements. By organizing factors such as people, processes, materials, and technology, businesses can move beyond surface-level fixes and implement long-term solutions.
Fishbone diagrams are widely used across industries, from manufacturing and healthcare to marketing and education. Whether improving product quality, streamlining operations, or solving customer service challenges, this tool helps teams collaborate, think critically, and make data-driven decisions.
Read more: The Easy Guide to Solving Problems with Six Sigma DMAIC Method
Conclusion: What Is a Fishbone Diagram?
Understanding what is a fishbone diagram and how to use it can make problem-solving much easier. This simple yet powerful tool helps you dig deeper, organize possible causes, and see the bigger picture instead of just addressing surface-level issues. Whether you’re troubleshooting a recurring business challenge, improving a workflow, or analyzing why a project didn’t go as planned, knowing what is a fishbone diagram allows you to take a structured approach and find real solutions.
The best results come when you use a fishbone diagram collaboratively, involve different perspectives, and back up your analysis with real data. And with platforms like Creately, you can easily create, edit, and share your diagram, making problem-solving even more efficient.
At the end of the day, what is a fishbone diagram really about? It’s about helping you find the root cause of a problem so you can fix it for good. With its clear and visual format, this tool makes problem analysis more effective—so you can move forward with confidence.
References
Kumah, A., Nwogu, C.N., Issah, A.-R., Obot, E., Kanamitie, D.T., Sifa, J.S. and Aidoo, L.A. (2024). Cause-and-Effect (Fishbone) Diagram: a Tool for Generating and Organizing Quality Improvement Ideas. Innovations Journals, [online] 7(2). doi:https://doi.org/10.36401/jqsh-23-42.
ResearchGate. (n.d.). (PDF) Application Of Fishbone Diagram To Determine The Risk Of An Event With Multiple Causes. [online] Available at: https://www.researchgate.net/publication/46567642.
Coccia, M. (2017). The Fishbone Diagram to identify, Systematize and Analyze the Sources of General Purpose Technologies. [online] ResearchGate. Available at: https://www.researchgate.net/publication/322526380.
FAQs: What Is a Fishbone Diagram
How do you define a fishbone diagram?
What aspect of events does a fishbone diagram help to illustrate?
What are the three basic rules of a fishbone diagram?
Can fishbone diagrams be used for personal problem-solving?
What’s the difference between a fishbone diagram and a flowchart?
Can fishbone diagrams be used for brainstorming?
How do I know if I’ve identified the root cause?