Entity Relationship (ER) diagrams are the cornerstone of effective database design, acting as a visual language that bridges the gap between abstract concepts and structured data models. At the heart of these diagrams lie ER diagram symbols and notation styles, which transform complex relationships into easily understandable representations. Whether you’re a novice stepping into the world of data modeling or an experienced database architect aiming to refine your craft, understanding these ER diagram symbols is crucial for building clear, efficient, and scalable data structures.
In this beginner’s guide, we’ll dive into the visual grammar of the essential ER diagram symbols, find out what Crow’s Foot Notation is, and explore how they bring clarity to the intricate world of entities, attributes, and relationships. Let’s get started!
What Are ER Diagram Symbols?
ER diagram symbols are essential visual tools that simplify the complexities of database structures. These symbols offer a graphical representation of entities, attributes and relationships in a database. This not only facilitates the design and implementation of robust database systems in an easily digestible visual format, but also enables a broader understanding of data architecture.
For those embarking on database projects, ER diagrams are indispensable, serving as the blueprint for a logical database structure. Check out the entity relationship diagram tutorial to learn about the process of designing a database system.
Real-World Applications of ER Diagrams
Entity Relationship (ER) diagrams have a wide range of applications across various fields, primarily in database design and data modeling. The following applications highlight the versatility of ER diagrams in both technical and non-technical domains.
Database Design: ER diagrams serve as blueprints for designing relational databases, helping to define entities, attributes, and relationships.
System Analysis: They are used to analyze and document the structure of systems, ensuring clarity in how data flows and interacts.
Software Development: ER diagrams assist developers in understanding data requirements and relationships, making it easier to implement database-driven applications.
Business Process Modeling: Businesses use ER diagrams to model workflows and processes, ensuring efficient data management and decision-making.
Educational Purposes: They are widely used in teaching database concepts and relational data modeling to students.
Data Migration and Integration: ER diagrams help in planning and executing data migration or integration projects by mapping out existing data structures.
Reporting and Analytics: They provide a clear representation of data relationships, aiding in the creation of reports and analytics.
Commonly Used ER Diagram Symbols
ER modeling utilizes a series of symbols to represent different components within a database and understanding them is vital for accurate database representation. The use of symbols such as rectangles, ellipses, and diamonds ensures that database designers and software engineers can quickly grasp the intricacies of database structures through familiar shapes.
The three main types of ER diagram symbols are entities, relationships and attributes which are connected by various types of lines depending on the ER diagram notation being used. Variations of these symbols can convey additional information about the dependencies within the database structure.
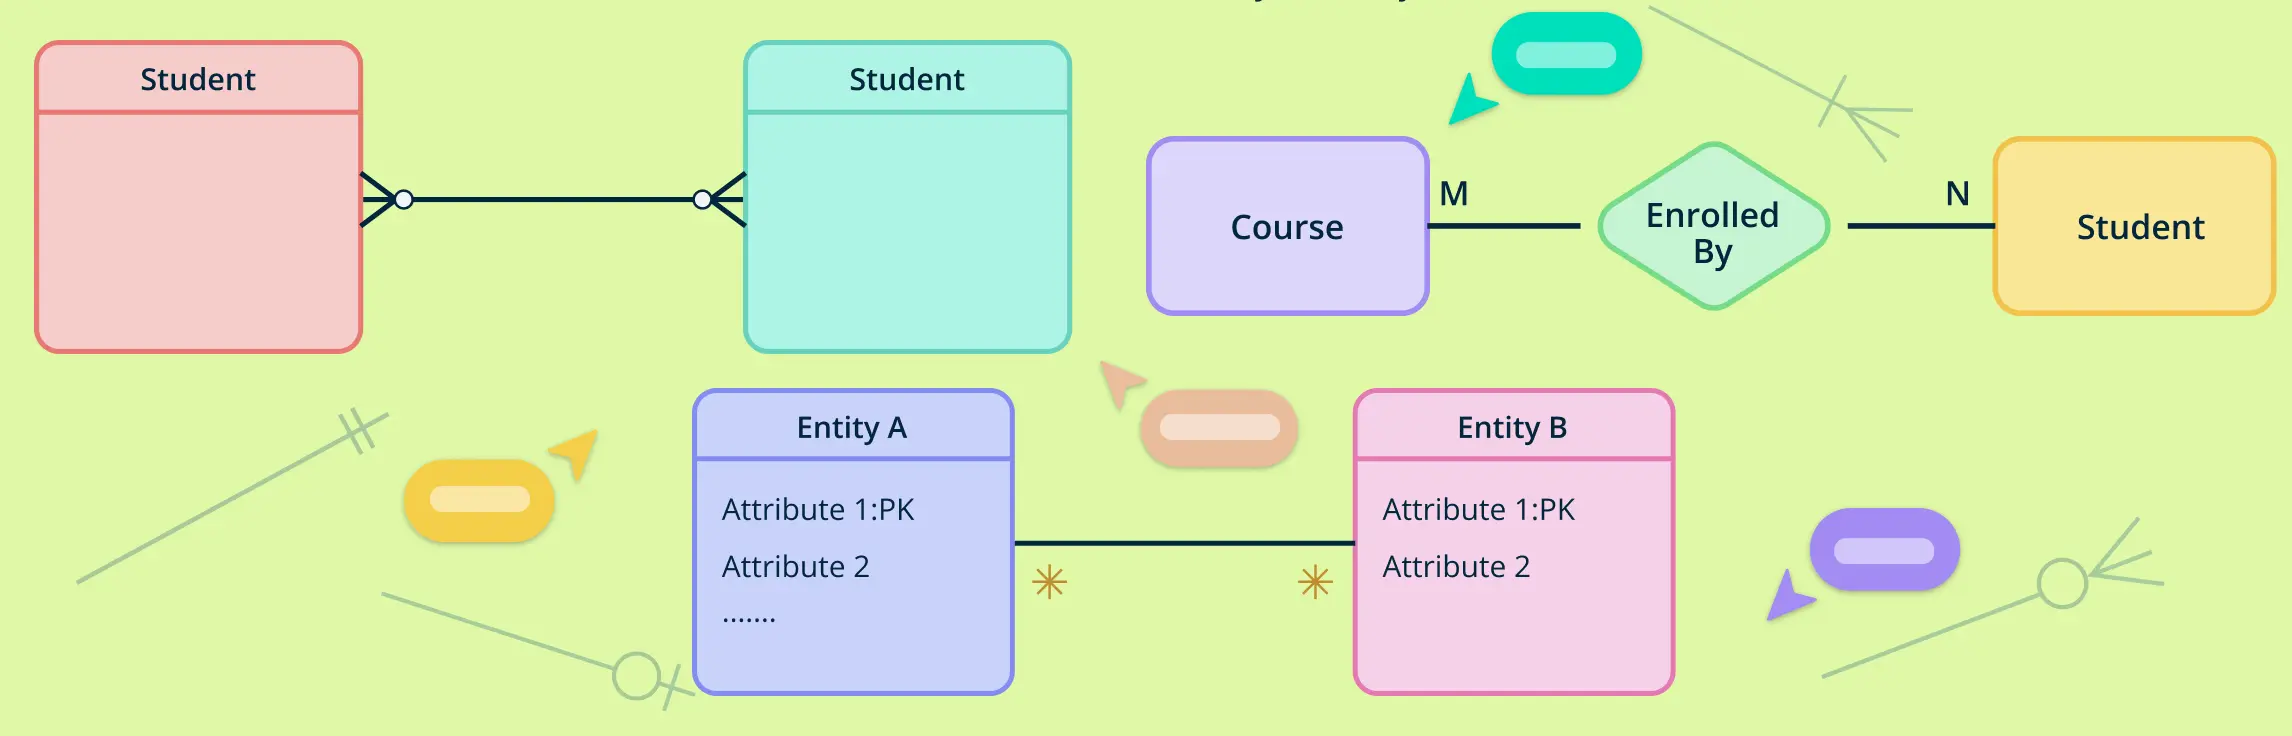
1. Entity Symbols
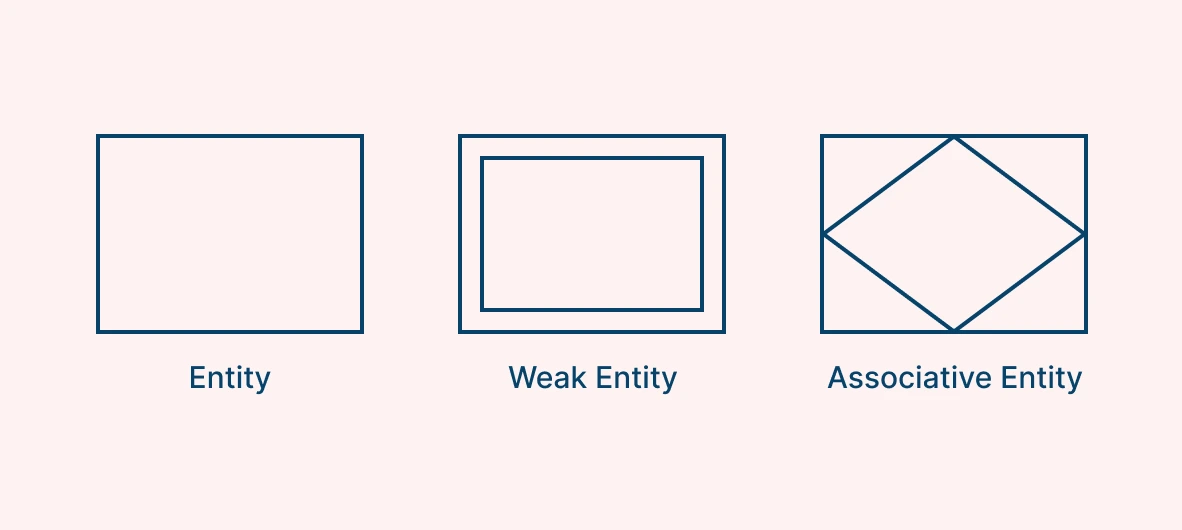
Entities are symbolized by rectangles and are objects intended for storing specific information. A single rectangle is usually called a ‘strong entity’ or ‘parent entity’ which is independent from other entities. These will usually have ‘weak entities’ that will be dependent on them.
A weak entity lacks the ability to be uniquely identified based solely on its own attributes. It is dependent on a strong or parent entity. These are symbolized as a double rectangle (a rectangle within a rectangle).
Finally, there’s the ‘associative entity’ which is represented by a diamond shape within a rectangle. These are used to relate instances of many entity types and will contain attributes specific to the relationship of those instances.
2. Relationship Symbols
The interactivity between two entities is described by a relationship which is visually represented as a diamond symbol. In the case of a double diamond (a diamond within a diamond), this denotes a ‘weak relationship’ which exists between a weak entity and its parent as explained earlier.

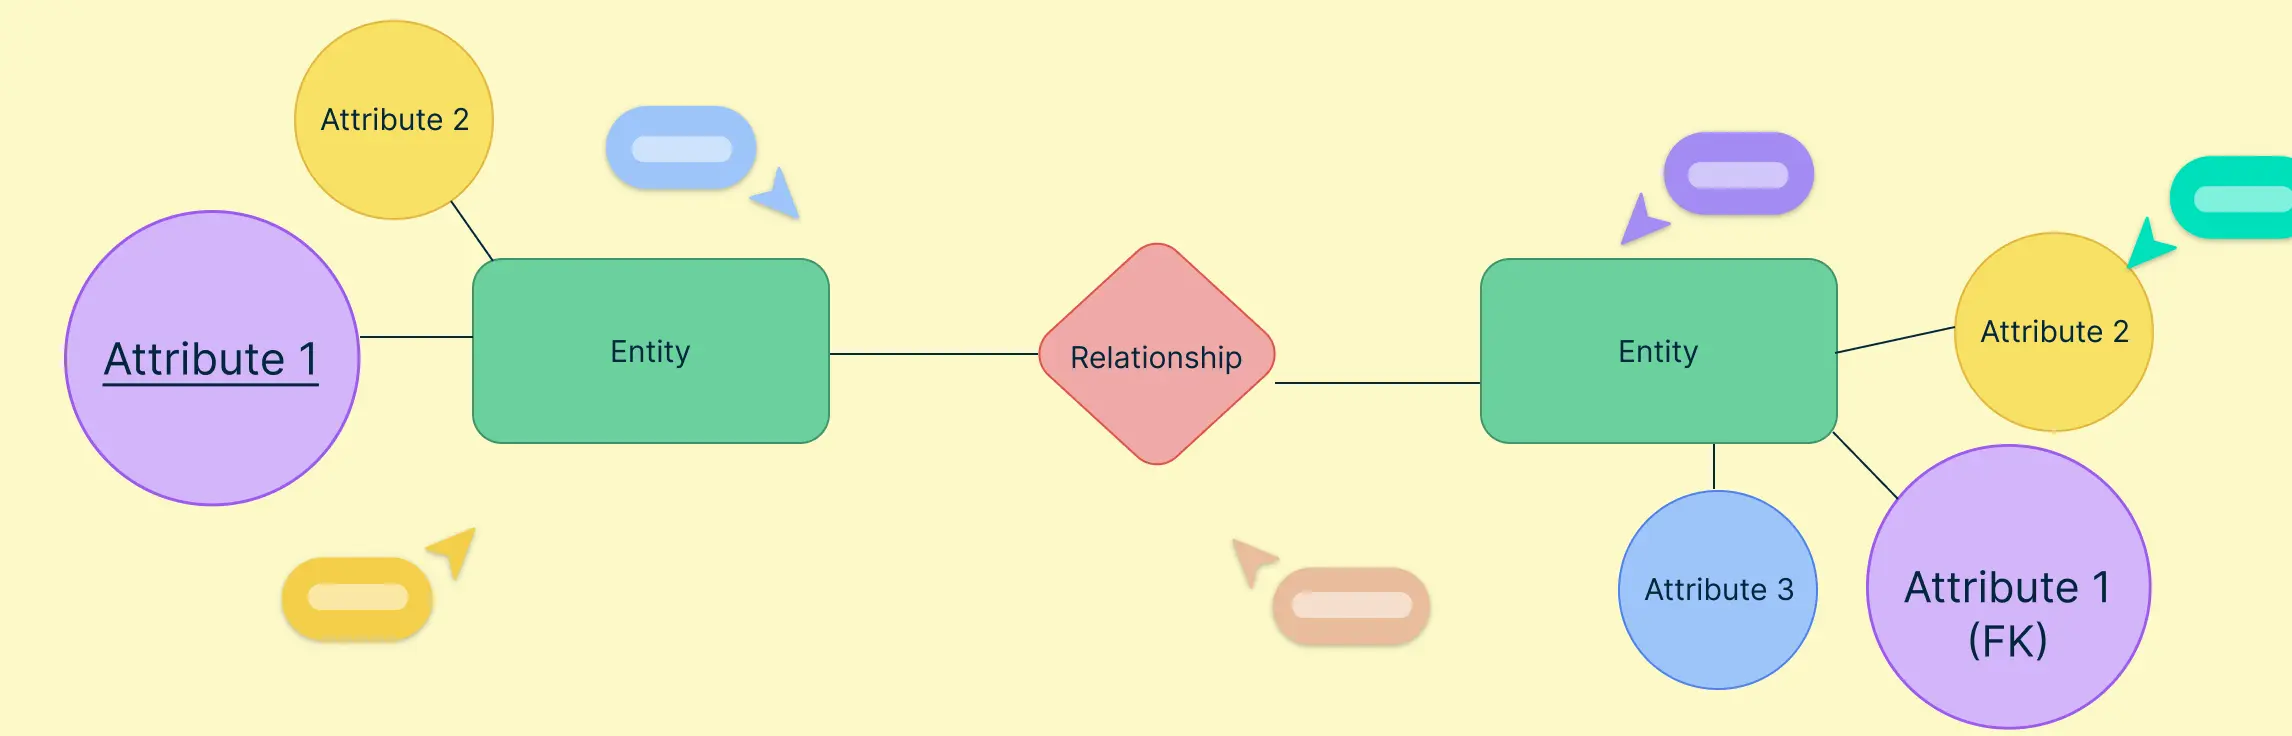
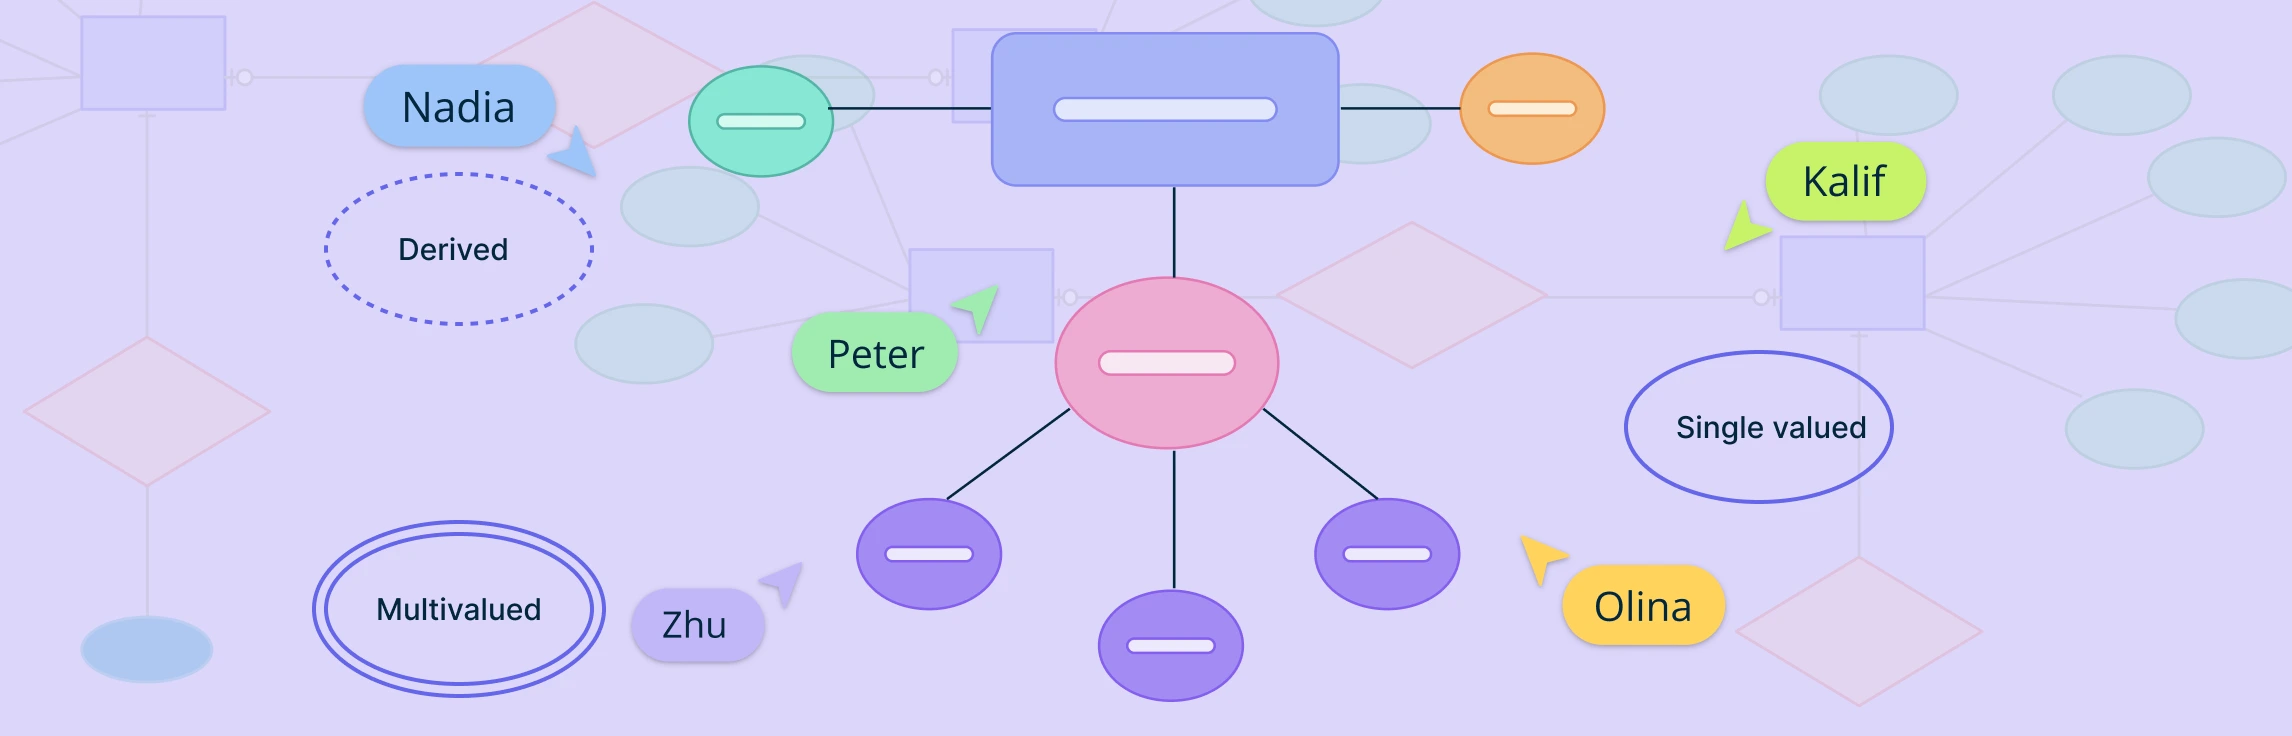
3. Attribute Symbols
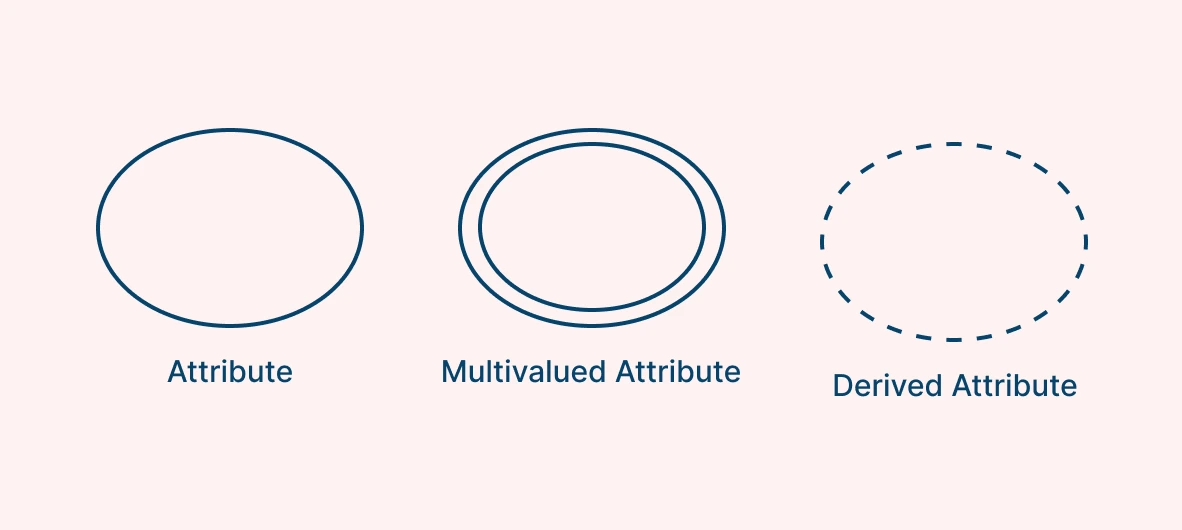
Ellipses (ovals) symbolize attributes, detailing the properties and characteristics of entities. A key attribute is the unique, distinguishing characteristic of the entity. A single ellipse denotes a ‘simple attribute’, while a double ellipse (an ellipse within an ellipse) highlights ‘multivalued attributes’ that can hold more than one value.
For example, an entity like Student will possess attributes such as Name and Courses. Here, while Name is a single-value attribute, Courses can be multivalued if a student is enrolled in multiple courses. Additionally, there are ‘derived attributes’ which are calculated from other data points, such as Age being derived from the Date of Birth.
4. Connecting Lines
Solid lines are used to connect the various ER diagram symbols mentioned above.

Physical ER Diagram Symbols
Often, database engineers will require additional information than what is shown by the simple connections between entities, relationships and attributes we have discussed thus far. These conceptual ER diagrams, while great for large projects to get a high-level understanding, lack technical details needed for the actual design of a database. This is where physical ER diagram modeling comes in.
A physical ER diagram is a detailed visual representation of the structure of a database, focusing on how data will be physically stored and implemented. It builds upon the conceptual ER diagram by including details of entities such as attributes within the structure of fields, keys and data types.
Fields in a Physical ER Diagram
Attributes are established as fields within the entity. These represent the columns of the database that the ER diagram is modeling visually. As shown in the example, the Name, Student ID and Date of Birth are all attributes contained within the fields of the entity ‘Student’.

Keys in a Physical ER Diagram
Keys are used to categorize the attributes and as a method to link different tables of a database to each other. This is done to keep the database organized. Primary keys are used to uniquely identify a single instance of an entity. Foreign keys are used when an attribute in one entity is related to another entity in a relationship that could be one-to-one or one-to-many. In the example, the Student ID is the primary key since it uniquely identifies each student.

Data Types in a Physical ER Diagram
Data types or simply ‘types’ for short are, as the name clearly implies, the type of data. The Student ID will have an integer data type (INT), the name will be a variable length string of character data (VARCHAR) and the date of birth will be the standard DATE type.

Cardinality and Ordinality
Cardinality in ER diagram symbols defines the maximum number of times an entity can participate in a relationship with another entity. It helps to specify the nature of the relationship between entities in a database. Ordinality refers to the minimum number of instances an entity can participate in a relationship. It defines the lower bound of participation, which can be zero (optional) or one (mandatory).
An entity’s participation in a relationship being mandatory or optional is referred to as ‘Optionality’. This is not to be confused with ordinality since the two are closely related but not identical concepts. For example, an optional relationship means an entity can exist without being linked to another entity, while a mandatory relationship requires the entity to be linked.
Defining cardinality and ordinality ensures database integrity and helps avoid errors such as duplicate or inconsistent data. Together, ordinality and cardinality help database designers establish the constraints and rules for how entities interact within a database.
There are three types of cardinality types.
Cardinality Types
1. One-to-One:
Each instance of Entity A is related to exactly one instance of Entity B, and vice versa. Example: A person can have one passport, and a passport is assigned to one person.
2. One-to-Many:
A single instance of Entity A can be associated with multiple instances of Entity B. However, each instance of Entity B relates to only one instance of Entity A. Example: A teacher can teach multiple classes, but each class is handled by only one teacher.
3. Many-to-Many:
Multiple instances of Entity A can relate to multiple instances of Entity B, and vice versa. Example: Students can enroll in multiple courses, and each course can have multiple students.
Ordinality Types
1. Mandatory Participation:
If ordinality is set to a minimum of 1, it means that an entity must participate in the relationship. Example: Every employee must belong to at least one department.
2. Optional Participation:
If ordinality is set to a minimum of 0, it indicates that an entity’s participation in the relationship is optional. Example: A customer may or may not place an order.
Types of ER Diagram Notation
Cardinality and ordinality are represented visually on ER diagrams by customizing the connecting lines and their endpoints. Database engineers employ a variety of ER diagram symbols, according to the style of notation used. The most popular styles are Crow’s Foot Notation, Chen Notation, Bachman Notation and Barker’s Notation.
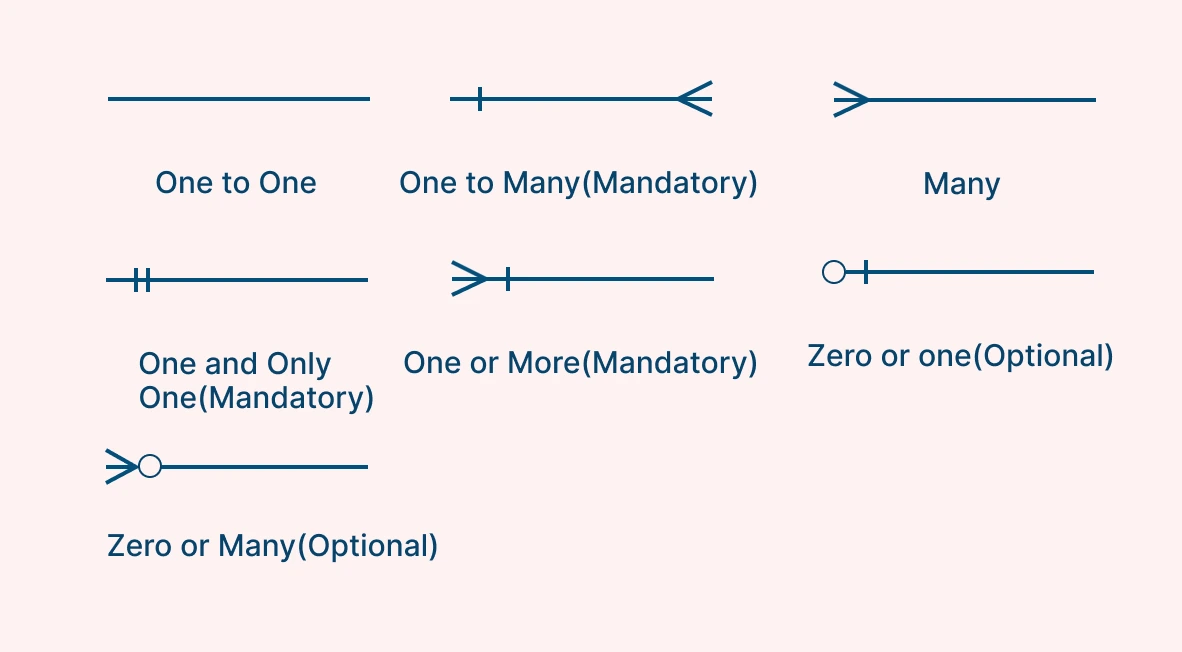
Crow’s Foot Notation
One of the most popular styles is called ‘Information Engineering’ (IE) or ‘Crow’s Foot’ Notation. The name comes from the very distinctive three-pronged symbol that is commonly used to represent the “many” side of the relationship of a connecting line. In this style, cardinality and ordinality are purely visual. The different ERD cardinality symbols of Crow’s Foot notation are shown below.
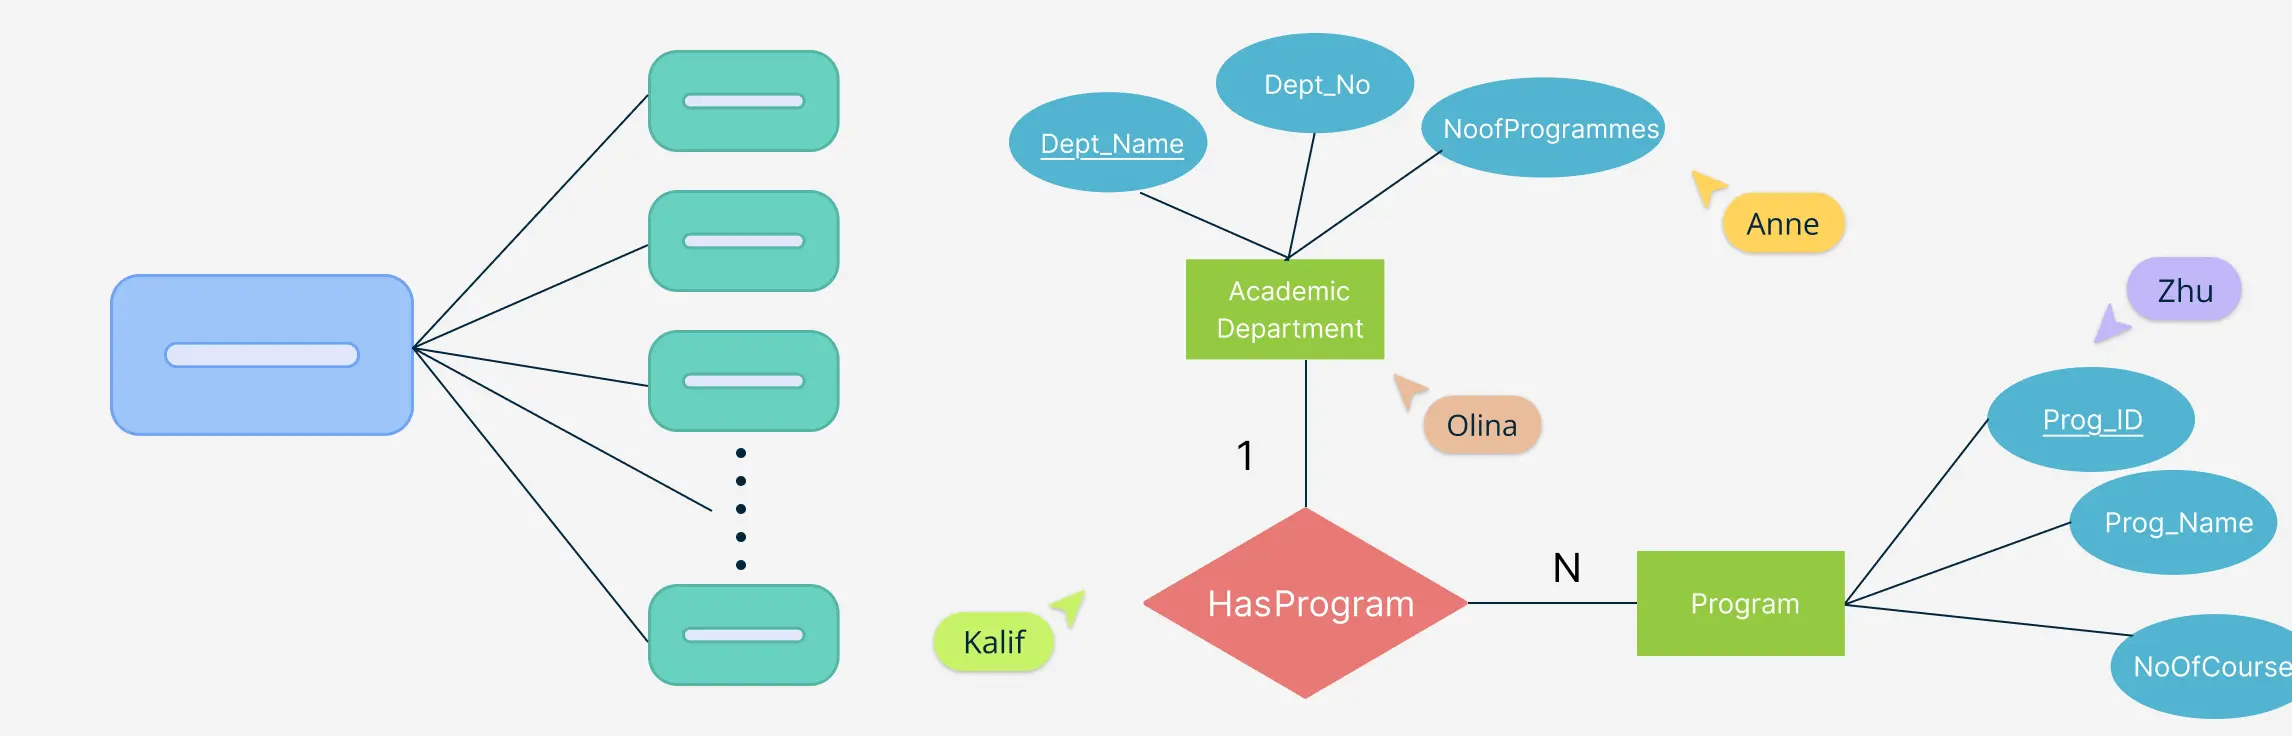
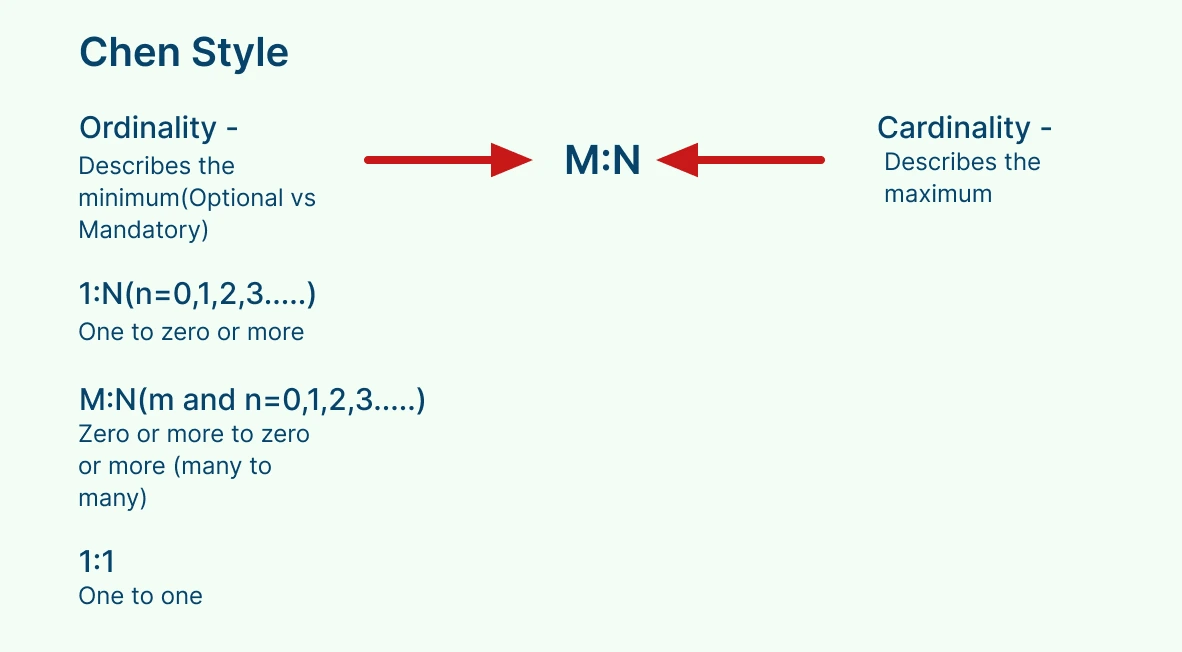
Chen Notation
Chen Notation is named after Peter Chen, one of the early pioneers of entity relationship modeling. He first published his method in 1976, which has become the textbook method used to train students in the basics of database design. In this style, cardinality and ordinality are shown by numbers and letters next to the connecting lines.
Bachman Notation
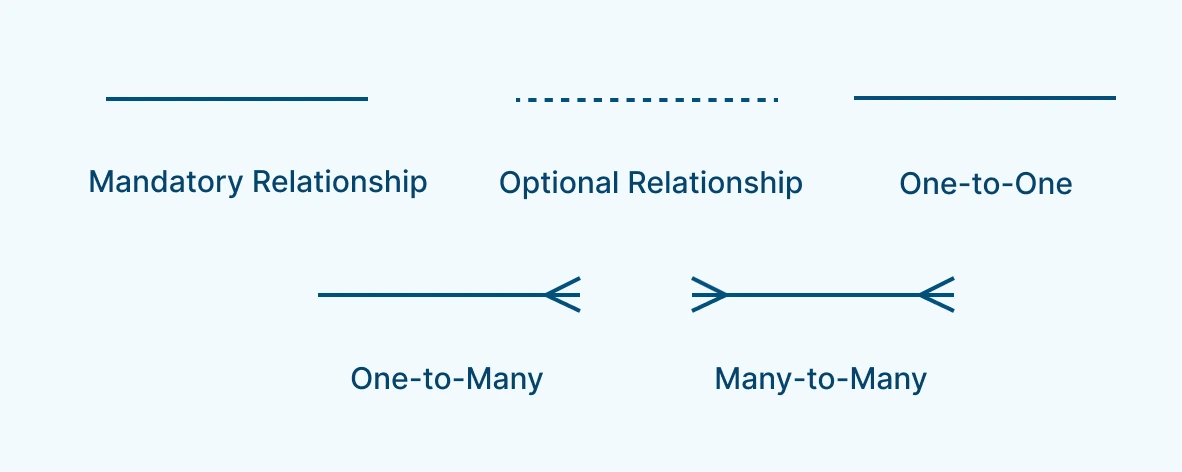
The third type of ERD cardinality notation is Bachman style. This method is visual and uses dots and arrows to convey information as shown below.

Barker’s Notation
Barker’s Notation is named after Richard Barker who developed the system along with Ian Palmer, Harry Ellis, and the rest of the team at CACI, a British consulting firm in the 1980s. These ER diagram symbols were later adopted by Oracle when Barker joined the company and are now the standard for database modeling in Oracle. Barker’s notation makes a few slight changes to the standard ER diagram symbols discussed earlier.
Relationships are no longer depicted as diamond symbols but as simple connecting lines between entities. The shapes at the end of a line convey details of cardinality and ordinality as shown below.
Other changes to ER diagram symbols in Barker’s notation include representing entities as rounded rectangles, with the entity name in singular form at the top. Attributes are categorized as unique identifiers, mandatory, or optional. There is the introduction of non-transferability which is shown by a rhombus. This represents certain relationships, like between a book and its chapters, which are non-transferable. Furthermore, subtype entities are added where entities can be grouped under a common supertype entity.
Want to make your own Entity Relationship diagrams? Use this handy Free ER Diagram Maker and get started.
ER Diagram Templates
Get started with your database creation with these helpful ER Diagram templates!


Conclusion
ER diagram symbols and notation are more than just visual tools, they’re the building blocks for understanding and designing effective database systems. As data continues to drive innovation across industries, the importance of well-structured databases cannot be overstated. Learning the basics of ER diagram symbols discussed in this beginner’s guide is the first step to enhance your database design skills.
After you master these steps, you will be able to create systems that are optimized for real-world success in whichever field you are working in. If you’re ready to start creating databases, check out Creately, one of the most popular visual collaboration tools available online. It comes packed with all the ER diagram symbols, templates and helpful examples you’ll need to get started.
FAQs About ER Diagram Symbols
What is an ER diagram?
What is the purpose of an ER diagram?
What are strong and weak entities?
What is Cardinality in an ER diagram?
What are the different styles of ER diagram notation?
What is the Crow’s Foot Notation?
Resources:
Chen, P. (2002). Entity-Relationship Modeling: Historical Events, Future Trends, and Lessons Learned. [online] Available at: https://bit.csc.lsu.edu/~chen/pdf/Chen_Pioneers.pdf.
Chen, P.P.-S. (1976). The entity-relationship model—toward a unified view of data. ACM Transactions on Database Systems, 1(1), pp.9–36. doi:https://doi.org/10.1145/320434.320440.
Frantiska, J. (2017). Entity-Relationship Diagrams. Visualization Tools for Learning Environment Development, pp.21–30. doi:https://doi.org/10.1007/978-3-319-67440-7_4.
Masri, K., Parker, D. and Gemino, A. (2008). Using Iconic Graphics in Entity-Relationship Diagrams. Journal of Database Management, 19(3), pp.22–41. doi:https://doi.org/10.4018/jdm.2008070102.