Concept maps are powerful tools in science education, serving as visual representations that organize and structure knowledge. They are particularly effective in enhancing scientific understanding and making complex information more accessible.
What Are Science Concept Maps?
A science concept map is a graphical tool that visually represents key concepts in science and the relationships between them. These maps are structured with nodes for concepts, connected by lines or arrows that describe the relationship, often labeled to explain the nature of the connection. This format helps in chunking information and analyzing relationships, making it an invaluable tool in the realm of science.
Science Concept Map Examples
Science includes many topics, from biology and chemistry to physics and the environment. Concept maps help organize these ideas by showing how they connect. Whether studying the human body, chemical reactions, or forces in physics, these science concept map examples make learning easier by breaking down complex information
Concept Map of Volcano


Concept Map Water Cycle

Concept Map Universe

Weather Concept Map

Phase Change Concept Map

How to Make a Concept Map for Science
Creating effective concept maps in science is not just about drawing lines and writing keywords; it involves a deep understanding of the content and the relationships between concepts. Here’s how to create a concept map for science.
Step 1: Choose a main topic
Start by identifying the key concept you want to explore. This could be anything from “The Water Cycle” to “Cell Structure” or “Newton’s Laws of Motion.” Write it in the center of your page or digital canvas.
Step 2: Identify key concepts
Think about the most important ideas related to your main topic. For example, if you’re mapping the water cycle, key concepts might include evaporation, condensation, precipitation, and collection.
Step 3: Organize the concepts hierarchically
Arrange your concepts from general to specific. The most important ideas should be closest to the main topic, while supporting details should be placed further away.
Step 4: Connect concepts with lines and arrows
Draw lines or arrows between related concepts. This helps show how they are connected. For example, in a concept map of the human body, “Circulatory System” might connect to “Heart” and “Blood Vessels.”
Step 5: Label the connections
Add short descriptions on the connecting lines to explain the relationships between concepts. For example, you might write “causes” between “Global Warming” and “Ice Melting” to show the cause-effect relationship.
Step 6: Expand with examples or definitions
To make your concept map more detailed, add examples, definitions, or even images. For example, under “Photosynthesis,” you could include “Example: Plants like trees and grass.”
Step 7: Review and refine
Look over your concept map and check if the connections make sense. Make adjustments to improve clarity, add missing ideas, or simplify where needed.
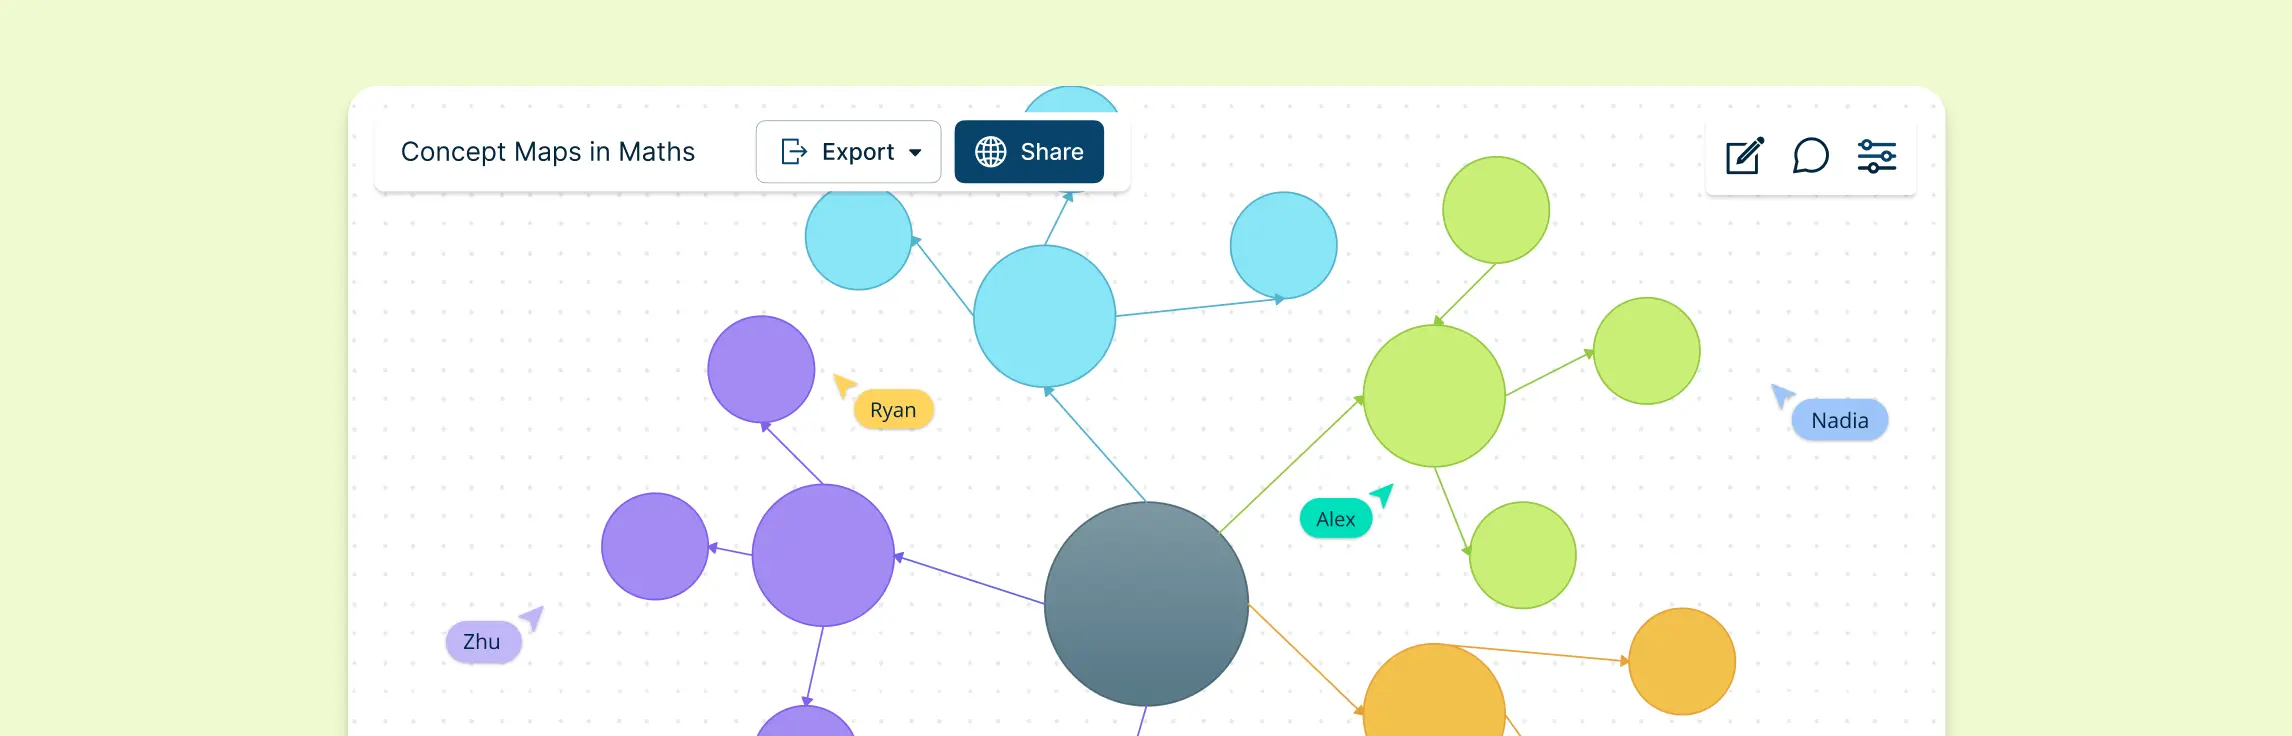
Utilizing the right tools can significantly enhance the creation and utility of concept maps in science. A Concept Map Maker offers an intuitive platform with features like real-time collaboration and a vast array of templates, making it an excellent choice for both beginners and seasoned educators.
Types of Concept Maps in Science
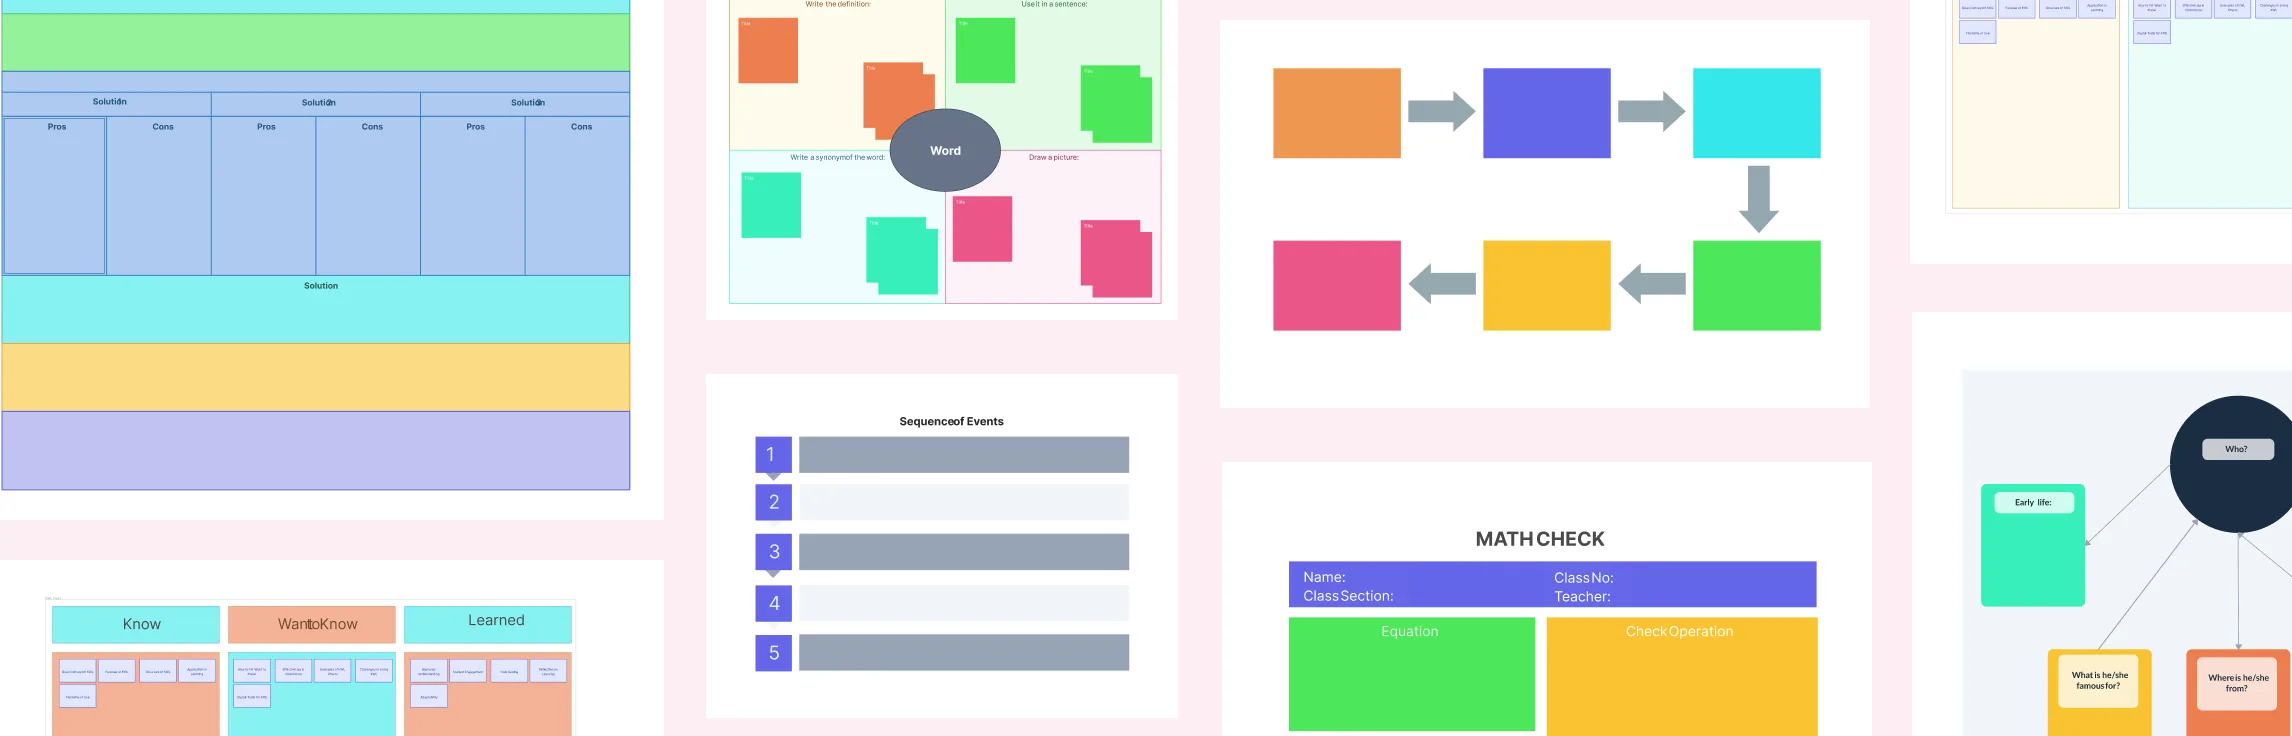
Science education utilizes various types of concept maps, including spider maps, hierarchical, flowchart, and systems maps, each serving different pedagogical purposes:
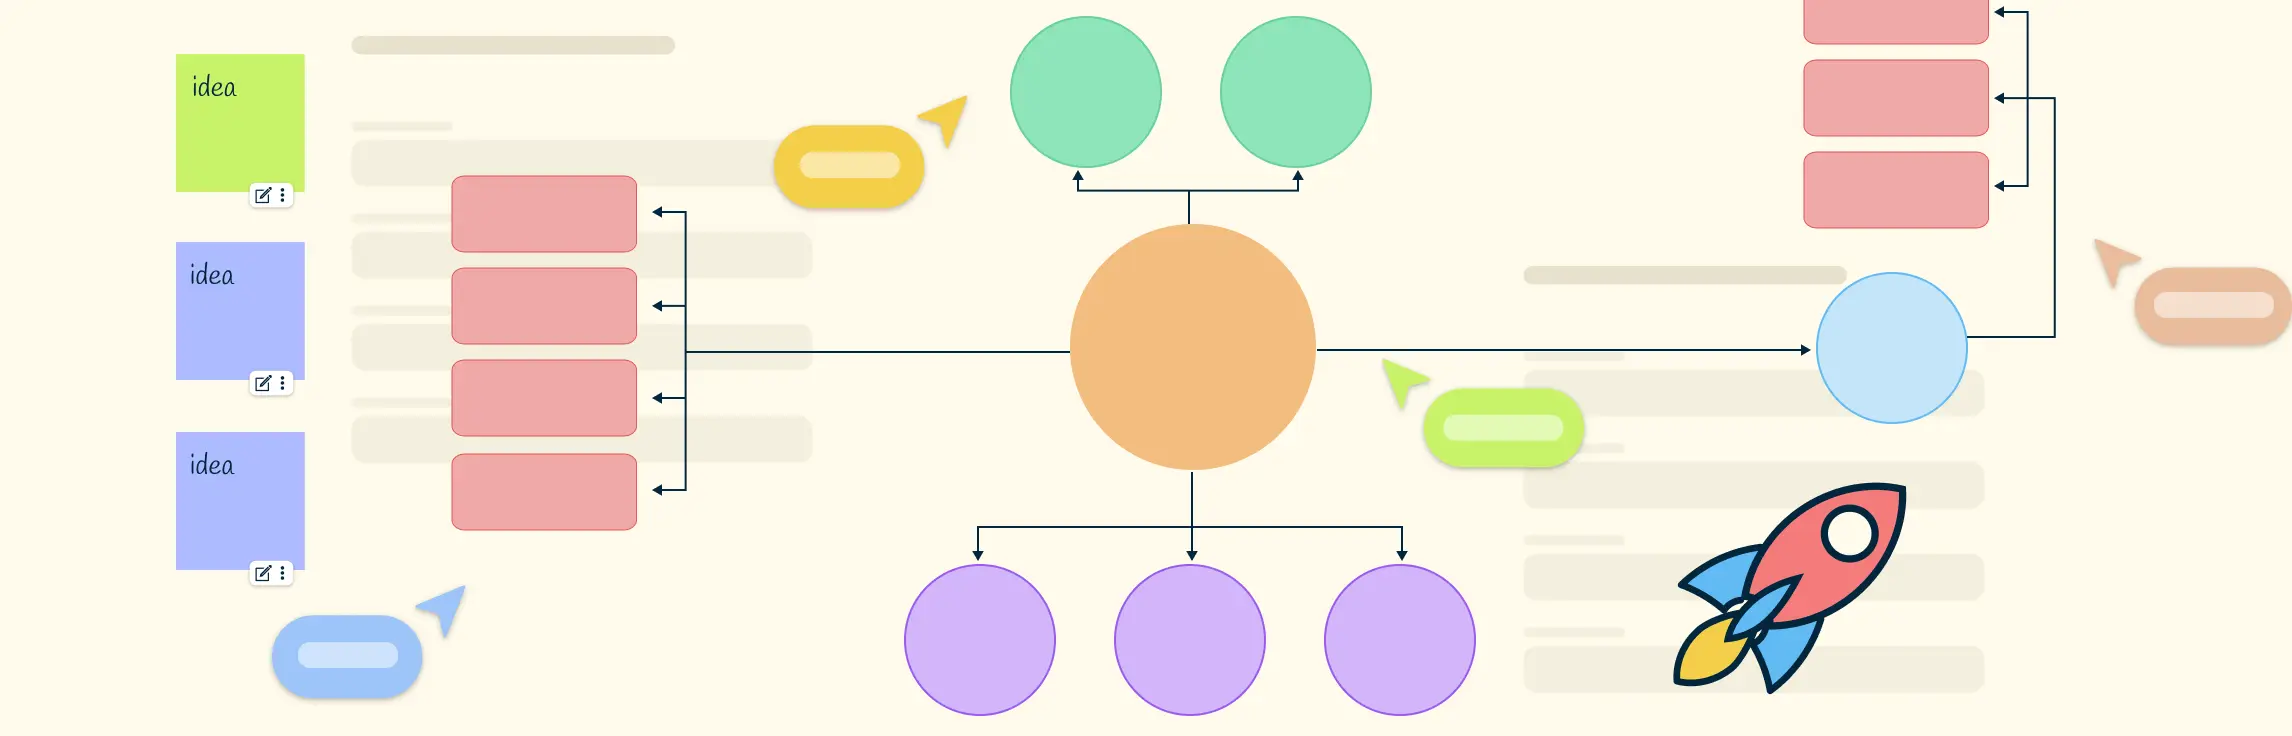
Spider maps organize information around a central theme, ideal for brainstorming sessions.
Hierarchical maps display information in a tree structure, emphasizing order and priorities.
Flowchart maps illustrate sequences and decision paths, useful in scientific processes.
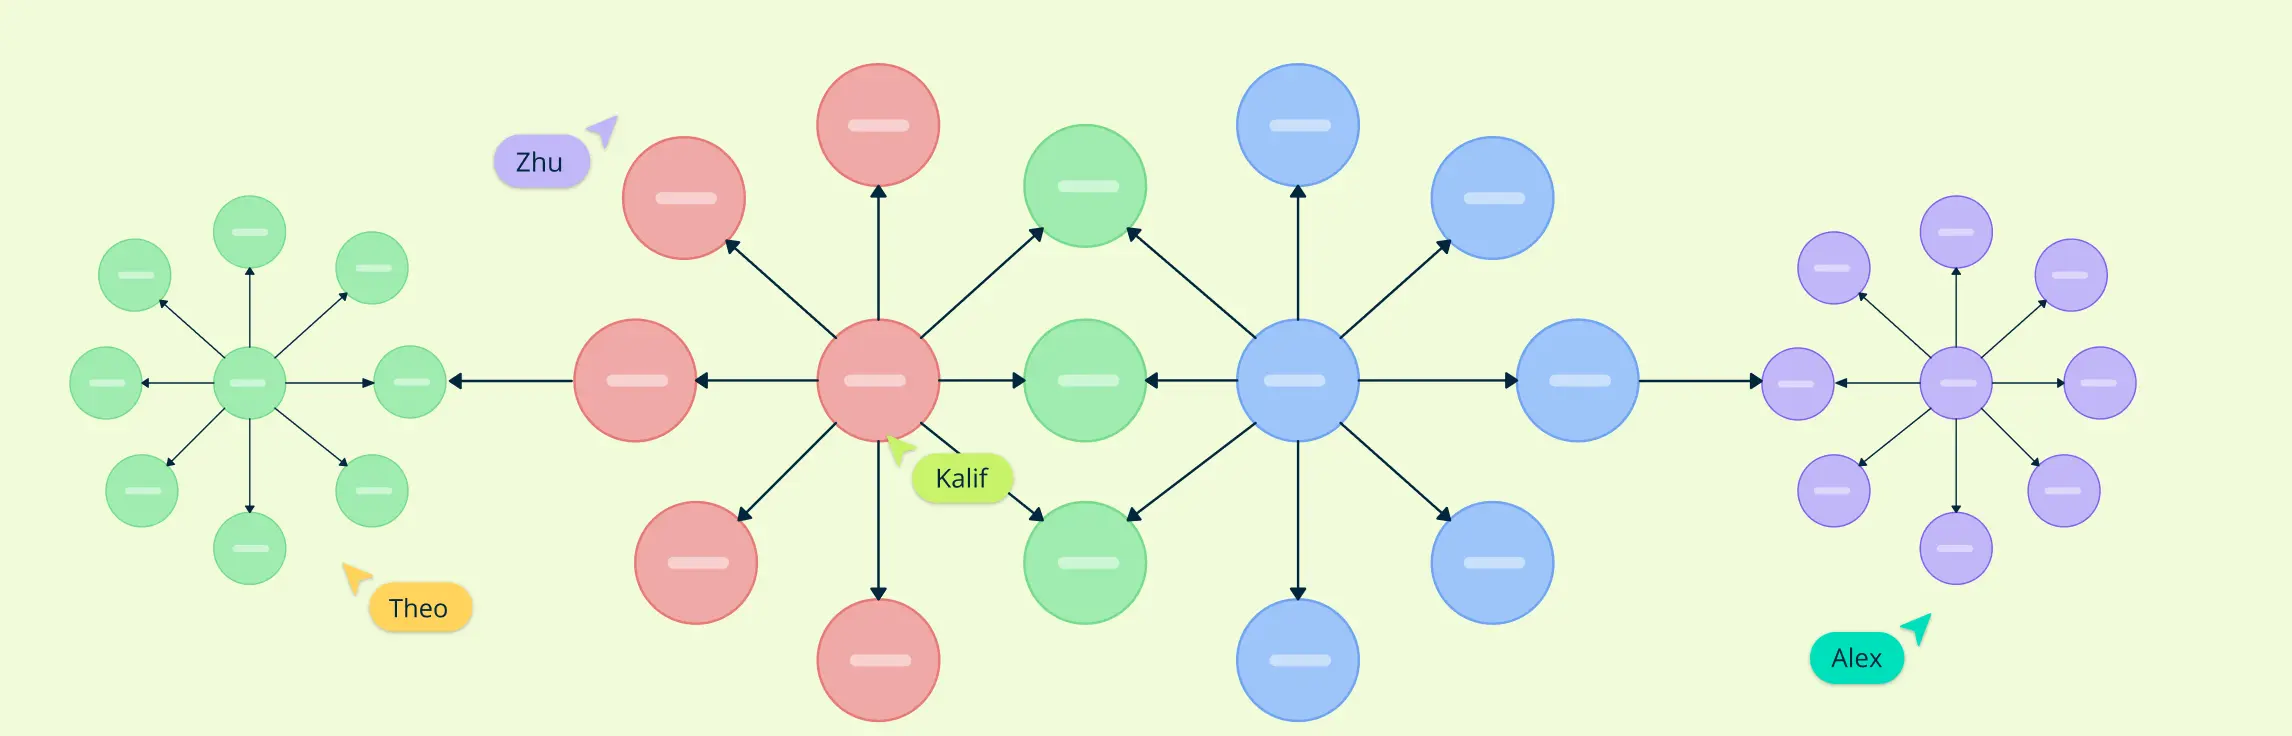
Systems maps show interconnections and feedback loops, critical for understanding ecological and physiological systems.
Each type of map caters to different aspects of learning and assessment, making concept maps a versatile tool in science education.
Ways to Use Concept Maps in Science
1. Organizing Lessons
A teacher might utilize a science concept map to visualize a topic, aiding in understanding the connections between various ideas. This approach helps in planning the depth and sequence of teaching. Similarly, a researcher might use a concept map to prepare for a project aimed at exploring students’ ideas.
2. Assessing Understanding
Teachers may ask students to create science concept maps for formative assessment, evaluating their understanding. This can be done at the beginning of a topic to assess prior knowledge and identify misconceptions, or during and after the topic to monitor progress.
Analytical and Presentation Tool
Researchers can use science concept maps to visually represent learners’ ideas gathered from interviews, serving either as an analytical tool or a means to present findings.
4. Revision Aid
Students might create science concept maps as a revision strategy to identify connections within a topic, engaging in ‘active learning’ by reworking material rather than passively reading or copying notes. They can also compare and discuss their maps to identify significant differences.
5. Promoting Dialogue
Group science concept maps can foster productive discussions among students, requiring them to articulate their ideas and collaboratively decide on the inclusion and relationships of concepts.
6. Scaffolding Learning
Students can complete partially finished science concept maps to reinforce previously taught ideas (‘scaffolding plank’) or structure new learning (‘scaffolding pole’). Teachers may use these maps at the beginning of a topic as an advance organizer or at the end as a revision tool. Providing maps with missing information encourages active problem-solving.
Benefits of Using Concept Maps in Science for Learning and Assessment
Science concept maps in science are not just tools for visualization but are pivotal in enhancing learning and assessment. These maps facilitate a deeper understanding of scientific concepts through visual learning and offer a unique assessment tool that evaluates higher-order thinking. Let’s explore the multifaceted benefits of using concept maps in science education.
1. Visual Learning Enhancement
Science concept maps serve as powerful visual learning aids. By graphically arranging concepts, they help students visualize relationships between different scientific ideas, making complex information more digestible. This visual representation supports the enhancing scientific understanding through structured visual summaries.
2. Assessment Capabilities
As an alternative assessment tool, science concept maps go beyond traditional testing methods to evaluate students’ understanding and their ability to link concepts creatively. This method is particularly effective in assessing higher-order thinking skills, offering a clearer insight into students’ cognitive processes than what multiple-choice tests or written answers might provide.
3. Personalized Learning
Science concept maps allow for personalized learning pathways, catering to individual learning styles.
They enable students to progress at their own pace, exploring different branches of a concept map based on their interests or areas of difficulty.
This personalized approach is supported by Creately’s, which helps in tailoring educational experiences to meet diverse learning needs.
Moreover, science concept maps aid in retention and recall by making details significant and memorable. They also support inclusive education by minimizing biases related to language and short-term memory, making learning accessible to a broader range of students.
References
Dowd, J.E., Duncan, T. and Reynolds, J.A. (2015). Concept Maps for Improved Science Reasoning and Writing: Complexity Isn’t Everything. CBE—Life Sciences Education, 14(4), p.ar39. doi:https://doi.org/10.1187/cbe.15-06-0138.
Abraha, M. (2024). Effects of concept mapping on students’ science learning: secondary schools of Habru Woreda, Amhara Region-Ethiopia. Cogent Education, 11(1). doi:https://doi.org/10.1080/2331186x.2024.2426109.
Katagall, R., Dadde, R., Goudar, R.H. and Rao, S. (2015). Concept Mapping in Education and Semantic Knowledge Representation: An Illustrative Survey. Procedia Computer Science, 48, pp.638–643. doi:https://doi.org/10.1016/j.procs.2015.04.146.
FAQs about Concept Maps in Science
How can concept maps help in science learning?
What are some examples of concept maps used in science?
How do you create a concept map for a science topic?
Why are concept maps better than traditional notes for science?
Can concept maps be used in scientific research?
How can teachers use concept maps in science classrooms?
Are concept maps useful for exam preparation in science?