Compelling Tips for Infographic Campaigns

Infographics became a highly popular and effective content marketing resource three to four years ago. Today, it remains to be potent. While other industries roll out generic blog contents to obtain visibility, infographics combined with energetic imagery and attractive texts can successfully educate audiences about a particular topic and encourage further brand engagement.

Unfortunately, the well-researched, carefully crafted and excellently designed infographics is often overlooked. This proliferation of terrible infographics is practiced out of selfish reasons by the less competent marketers whose sole aim is to obtain quality link juice. Recently, with its rampant irrelevance, many have declared the death of infographics.

But it isn’t true, though many have overlooked the importance of ‘quality’, infographics isn’t dead.

At least, not yet. When carefully crafted, infographics, just like other forms of visual content, remains to be highly effective in the busy world of content marketing. In fact, more than 60% of marketers anticipated the continuous wide use of infographics by 2017.

Full credits to the technological advancements and the widespread utilization of mobile internet access, the typical human being has now a shorter attention span. This makes visual content to become even more essential in capturing audience’s attention. It must come not surprising that an excellently weaved infographics are noticed and shared three times more compared to its counterparts.

As long as you remain true to providing value to your audience rather than just doing things for mere links, infographics will continue to be an efficient marketing tool.

After crafting an excellent infographic, content marketers often face a daunting dilemma over its promotion.

Once you have your infographic completed and you think it’s something that is truly worth sharing, considering the following guidelines for promotion will help create better audience engagement.

Optimize Landing Pages

Optimize Landing Pages

Make sure your landing page is as user-friendly as possible. Incorporate social media links underneath the infographic. This will allow people to share it through various platforms such as Twitter, Google+, Facebook and Pinterest. It is also necessary to provide an HTML embed code below the infographic. This will make the lives of other website owners easier in presenting your infographic in their respective sites, in case they choose to.

Look For Credible Infographic Directories

Look For Credible Infographic Directories

There are a myriad of places online that would be happy to have your infographics displayed and be shown to their visitors. This will help bring in various positive effects with regards to backlinks and website traffic.

Just always remember to dutifully follow each website’s submission guideline.

Further, create a compelling introduction to support the information within your infographics. This will make your post become more credible and attractive.

Reach Out to Established Bloggers

Reach Out Established Bloggers

Blogging has changed a lot. Today, bloggers are becoming picky with the guest postings they receive. They will consider accepting one if, and only if, it is contextually relevant content to show to their audience.

So long as your infographic is well-crafted, you will find bloggers that will be interested in placing your infographic along with their content.

You can simply contact the site owners of each blog post that you think is relevant with what you have. You can tell them that you came across their article while doing researches. Then, ask them if they’ll be interested in putting an infographic within their article.

This in fact is not an aggressive request. Instead, you came in to offer them an awesome piece that their audience will surely appreciate. Now, if they would ask to see the infographic and they happen to like it, then you can pitch for them to republish it.

Exhaust Email

Exhaust Email

If you believe that your infographic is relevant enough with your mailing list, then exhaust it for better branding.

You can drop people with a message that has a thumbnail of the infographic with a backlink to your preferred landing page. If in cases your infographics relate to any of the services you offer, use the infographics to help readers find their way to such pages.

Make Use Of Social Media

Make Use Of Social Media

In posting the infographic on Facebook and Twitter, you can include a thumbnail image and a hyperlink back to your landing page. Different social platforms may have different guidelines, so it is necessary to tailor your thumbnail individually.

In posting the infographic on Twitter, make sure to use relevant #hashtags to further enhance engagement.

Takeaway

One of the most crucial things to consider in promoting your piece is to contact emails you have made over the years with different blogs. You can humbly ask the owners of each blog to embed your infographic on their sites. Most of these people will be glad to accept your offer considering that it could be a strategic way for them to add further value and content to their respective blogs.

Also, it is essential for you to use credible sources for your infographic.

Now, do you have any infographic promotion scheme in mind? Share it with us by leaving a comment below.

Compelling Tips for Infographic Campaigns

Author Bio
Patrick Panuncillon is the link building expert behind LinkVista Digital, an online marketing solutions based on the Philippines.

Why Infographics is a “Must-have” Marketing Tool
Infographics in Marketing

It’s no secret that human beings are visually oriented, so we respond to images more than words most of the time. In this day and age of our consciousness being dominated by the Internet, innovative use of images is very important in capturing an audience and making sure that they get the value we want them to have through that power.

In combining informative content with visuals, the infographic became one of the best ways to convey information as it makes whatever statistics needed more digestible and comprehensible. Even those who may not be that good with figuring out facts and figures can understand them through the use of infographics. It’s the epitome of showing and not just telling.

Chart available in our infographic library

Charts available in our infographic library

The Advantages of Infographics

Infographics are also quite shareable and linkable, making them perfect for social media. When people see infographics on Facebook and Twitter, they can get it right there instead of having to read through paragraphs on a long article. If you’re a startup or a small business who is trying to make a mark with content, then infographic software are a great tool for doing just that.

Due to them being great for social media and linking, they can do wonders for your SEO. People who are doing research and stumble upon your infographics can link credit to your website, making you more of an authority and boosting your visibility online. Also, just by having tons of people share your infographics, you already get so much exposure. If the facts and figures presented by your infographics are that compelling, they will indeed be shared.

Having said that you need to encourage sharing and linking by adding embed codes etc. Since you have already created the info-graphic you can go that extra mile and start marketing your info-graphic as well. Check out this great article about how to make your infographic go viral.

Creating infographics also lets you figure out your brand’s go-to graphic design. You definitely need to have your branding go with your design, so the colors and visual style you incorporate must be consistent with your brand. By doing so, you make your brand a lot more recognizable.

Do’s and Don’ts in Infographics

First of all, you must determine the original source of data by looking at its sources and tracking it back to the original page where it’s cited. That’s then what you put on your infographic as one of your sources. Never under any circumstances neglect citing your sources because plagiarism is a serious breach of conduct and trust.

Also make sure that your data is the most recent available. Using outdated data is poor form, so you have to go the extra mile in determining from what year that data is from. With that in mind, you’d also want to limit the number of sources you’re using since it’s easy to have too many, and they might conflict each other. Pick the most recent ones with high online rankings for best results since you’d want to have sources with considerable authority online.

Don’t put down a user-generated website as your source since that information may not be entirely true. Since pretty much anybody willing enough can change and add to whatever is on that page, it may not be entirely reliable. You may check out the sources and references cited there though and see if they’re indeed authoritative and trusted, and then you may be able to use those sources as your own.

Tell a story with the information and make sure that there are no gaps and hanging questions in it. The worst thing you can do is to have lots of gaps and leave the audience with more questions than answers. Telling a story with it means having a progression from fact to fact that makes sure audiences don’t get lost along the way.

Finally, take the initiative and share your infographic on social media. Don’t wait for your audience to take notice, take it to them as soon as you can. The more visibility you can have, the better chances your infographic can gain an audience. If you can turn it into a press release, then definitely do so. Also, don’t promote only once; do what you can to promote it as long as it’s still relevant to the times.

Websites for Getting Infographics Data and Content From

Sources are not that hard to come by, but it can be confusing as to which ones are the most trustworthy ones. Here are some you can make use of.

The Guardian Data Blog is all about data journalism and visualization that lets you take a look at what goes on behind The Guardian’s journalistic efforts. There’s also a Presenting Data Master Class offered by The Guardian that can help you do better infographics and other data presentations.

The United States Census Bureau is a great source for seemingly obvious reasons. It gives you quick and easy access to facts on people, business, and geography. It also has a Data Visualization Library, which should give you ideas on how to present in your infographic.

The World Health Organization website provides data and analyses for monitoring the global health situation of past and present. You can review the Publications section if you don’t know where to begin.

Data.gov is the US Government’s home for open data. Whatever data you need that involves the US, it should be here.

CIA World Facts is great if you want more in-depth data that you can’t find anywhere else. It also has the added benefit of making you feel like a secret agent, if that’s your kind of jam.

Google Public Data Explorer is powered by the most powerful Internet company in the world, so it’s bound to be full of data that’s mostly up to date.

Google Scholar and Google Consumer are some of the Google-based tools for gathering data from various sources on the Internet. Ask Your Target Market and Mechanical Turk are similar in this regard as well.

Infographic Online Tools

If you’re not a graphic designer, don’t have tools like Photoshop, and/or don’t have the time to carefully craft a design for your infographic, then you may want to get into online tools that can help you make one yourself in no time.

Creately’s online infographic tool comes packed with many features to quickly come up with info-graphics. This include separate libraries for business shapes, people shapes, charts, country maps, world maps, US state maps etc. Check out the blog post about creating infographics online with Creately.

Visualize is an infographic resume generator that can help you chart out your professional qualifications and accomplishments in a simple yet compelling personal visualization.

Google Developers has chart tools that are simple yet powerful, as well as free to use. Not only can you choose from a variety of charts, but you can also configure an extensive set of options to make it suit the look and feel of your website.

Easel.ly is a free online infographic tool with a dozen free templates for you to choose from, with each being easily customizable. You can also access a whole library of elements like arrows, shapes, connector lines, fonts, colors, text styles, sizes, and so on to let you fully customize your infographic.

Piktochart is a lot like Easel.ly that offers three basic themes for free and a subscription plan for those who want to use it more extensively for a longer period of time.

There are many others like Easel.ly and Piktogram such as Infogr.am, Visual.ly, InFoto Free, Venngage, Dipity, Get About, and more. Explore each one and find out which one is best for you.

About the author: Jay Manangan is a web content writer and a designer of Your Company Formations UK and Co-Founder of Shift Stream Media. His main interest are online marketing, business management, web design and tech. Follow him on Google+ and Twitter.

4 Inspirational Infographics to Help Start Your Business
Infographics to Start a Business

If you have dreams of starting with a simple notion and turning it into a billion-dollar industry in under a year, chances are you’re getting a little ahead of yourself. But, you don’t need deep pockets or a fancy set-up to start a business. You can begin with nothing more than a great idea and a little support from like-minded individuals. And if you’re looking for some inspiration or motivation then just have a look at these 4 info-graphics.

No Money, No Problem

The first thing entrepreneurs often think they need a ton of right out of the gate is money. Marketing and SEO are two of the most expensive aspects of starting a business, but the advent of email marketing and the use of social media for brand-building have helped businesses reach a wide target audience without spending much and have influenced purchasing decisions.

On top of this, there’s a whole host of SEO tips and tricks available to business owners that can get their websites noticed and give them credibility.

According to this Forbes article Appster began with an initial investment of $3000, and Carol Craig of Craig Technologies started with $150 and is pulling in nearly $45 million a year today.

If you don’t have a hefty life saving lying around, there’s more than one way to gain moderate amounts of capital without generating business revenue first, which is good news, because according to below infographic by QuickBooks, 64% of businesses start with an initial investment of $10,000 or less:

Business that started wit less than $10000

Business that started with less than $10000

You Don’t Need a Huge Office to Get Started

Google, Apple, HP, and Amazon all started in a garage, and Craig Newmark of Craigslist worked out of his living room for the first five years.

Having access to a fancy office building may seem necessary, but a space to work is really the only crucial part. You may be going after customers that you need to impress, but waiting until you have enough money to acquire an impressive home base is not the way to get them.

No matter what service you’re providing or what product you’re selling, you can start with little more than a single room. Some of the biggest names began in unconventional places, as this Washington State University infographic illustrates:

No Time? How about 30 hours per week?

The third thing most people don’t think they have enough of is time. While there’s no way to launch a successful business without a substantial time commitment for the first several years, it’s not necessary to quit working altogether and sink everything into a business.

It’s possible to start planning, developing, and implementing in your spare time and then save the satisfying show of saying goodbye to your boss for good for when your business is stable. Rest assured, if you have passion and determination, you have the time:

How to find time to start a business

Isn’t 30 hours per week enough to pursue your dreams?

It’s Now or Never

No matter your perceived limitations, there are steps you can take to get your dream off the ground right now. The last thing to consider is this infographic, which describes the anatomy of a successful entrepreneur, and says nothing about money, space, or time:

A typical journey of an entrepreneur

An Anatomy of an entrepreneur

Are You Going to Start a Business This Year?

We sincerely hope these info-graphics will help you to start a business. With crowdfunding, shares spaces, co-working spaces and many other facilities it’s now easier than ever to start a business so you have absolutely no excuse not to pursue your dreams.

And finally keep in mind that ideas are cheap, its the execution that matter.

Share Information Effectively with Creately Infographics
Share information effectively using infographics

It’s an undisputed fact that the human brain processes images a lot faster than words and this is particularly true when it comes to illustrating complicated data.

Visually representing large amounts of data in an infographic allows it to be quickly and clearly communicated in a holistic manner that doesn’t require background knowledge to analyze it.

While there are several different diagramming software options available for creating infographics, none offer the fast and easy approach that the lean Creately drawing space provides.

Read on to discover the unique edge this uncomplicated tool brings to visual storytelling while saving time!

Share information effectively using infographics

Save Time with Creately’s Template Library

If you don’t have hours to spare crafting a beautiful infographic, Creately’s extensive range of infographic templates offers the perfect solution!

Choose from one of our pre-created infographic styles to get started and spend a couple of minutes customizing anything and everything.

With just a few mouse clicks personalize your chart to match your unique needs and voila, you’ve now transformed complex information into an attractive and instantly understandable graphic!

Combine Data Driven Content with Graphic Elements

Bring your data to life using the user-friendly Creately drawing space to drag and drop different graphical and data elements that combine forces to give your audience the whole story.

Creately takes you beyond the world of traditional bar charts and pie charts, by bringing unique data driven elements like repeaters to save you time while keeping your infographic clean and uncluttered.

Customize Infographics Quickly and Easily

When working with software such as Microsoft Excel to illustrate data, there are certain limitations that you will come across. These limitations often arise during customization of charts which can be particularly frustrating when you don’t have the freedom to generate a chart that is exactly the way you want.

At Creately we understand the importance of extreme customizability and provide you with absolute control over all aspects of your drawing. This allows you to customize even the most of minute of details like line color, position of fonts; et cetera to express yourself with minimum effort.

Share Completed or Infographics in Draft Mode Instantly

Creately gives you the unique edge of being able to share work in progress infographics with an audience while giving them authority to make changes in real time. This saves times and does away with having to organize meetings for feedback etc.; instead allowing changes can be completed right then and there.

Once an infographic has been completed, Creately allows you to embed your diagrams on a website or share a high resolution version in a range of different formats for ultimate accessibility.

Creately is not just an effective drawing tool for infographics, but can be used for a host of other diagramming needs. Providing the perfect balance between power and expressibility with flexibility and ease of use, it is no wonder that Creately has become the tool of choice for a number of small, medium and large organizations across the world.

How to Use Creately Viewer to Display Large infographics
Display large infographics in any page of any size using Creately viewer

If a picture is worth thousand words, an infographic is probably worth million words. A well thought out infographic can condense years of research and tons of data into a single understandable image. So its no wonder infographics are so popular. But the biggest problem faced by many bloggers and websites owners is how to display large infographics in a meaningful way. And in this post we’ll show how you can use Creately viewer to do this  efficiently.

Display large infographics in any page of any size using Creately viewer

The toolbar provides plenty of features to better view the image

What is the Diagram Viewer ?

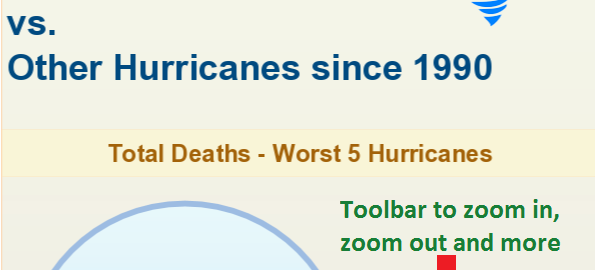
Creately viewer is small JavaScript code which you can use to embed your diagram in webpages and blogs. When you’re working on a diagram you can see it under the “Publish” section. Below I have embedded an infographic about hurricanes so you can see how it looks like.

If you hover over the image you will see a toolbar at the bottom. You can use that to zoom in on the infographic, view it on new window or even download it. For a detailed look into the Creately viewer and its capabilities check out this link. For a brief overview of the features check the next section.

How Creately viewer make infographics awesome

  • Ability to define the size of the viewer – By default the viewer is set to 600 x 400, but you can give a custom range so the viewer exactly matches the dimensions of your page.
  • Ability to link to sources – Most of Creately objects can be linked to other Creately objects or external pages. This enables you to link to external resources within the context of the diagram.
  • Zooming – To zoom in on the infographic to capture more details. Especially useful for large infographics.
  • Ability to drag the image – combined with zooming this makes it very easy to absorb details in large infographics.
  • Other usability features – The toolbar comes with fit to screen button, 100% zoom button, download button and even have buttons to share on Facebook and Twitter making it even more user friendly.

How to show existing infographics using the Creately viewer

If you already have infographics or want to showcase an infographic belonging to someone else using the Creately viewer, you can do this by importing that infographic as an image. Just make sure you have the right to do so and you’re not violating copyright laws.

Are you using Creately viewer to display large infographics? Even if you’re using it to show normal diagram we love to hear about how you use it and what we can do to improve it. if you’re not using it what’s holding you back?

How to Make Resolutions That Actually Work

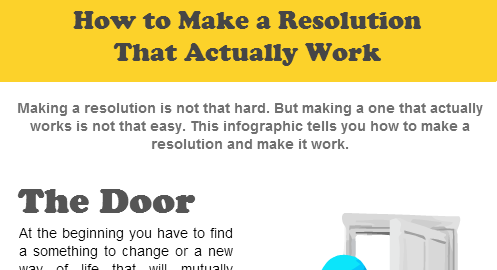
When you want a change or to deviate something in your life that is not beneficial anymore, you practice what’s best for you by creating resolutions. A resolution is a firm decision to do or not to do something. But is it easy to make resolutions that actually work? This infographic tells you how to make resolution that actually work for the best.

how to make a solid resolution

How to Make Resolutions That Actually Work