The Ultimate List of Change Management Tools to Drive Change Like a Pro

Change is never easy. Especially in a context of business, as it affects a lot of aspects. In order to ensure a smooth transition from the current state to the desired state of business, you need the correct change management tools and resources at hand.

We’ve compiled a list of useful change management tools that you can use to adapt to new changes in your organization seamlessly.

What is change management?

In the simplest of terms, change management is a systematic approach towards dealing with change. It’s a structured way of applying tools, knowledge, and resources to effectively drive organizational success.

There are multiple stages in a change management process. The following change management process template highlights these different change management steps.

Change management process template

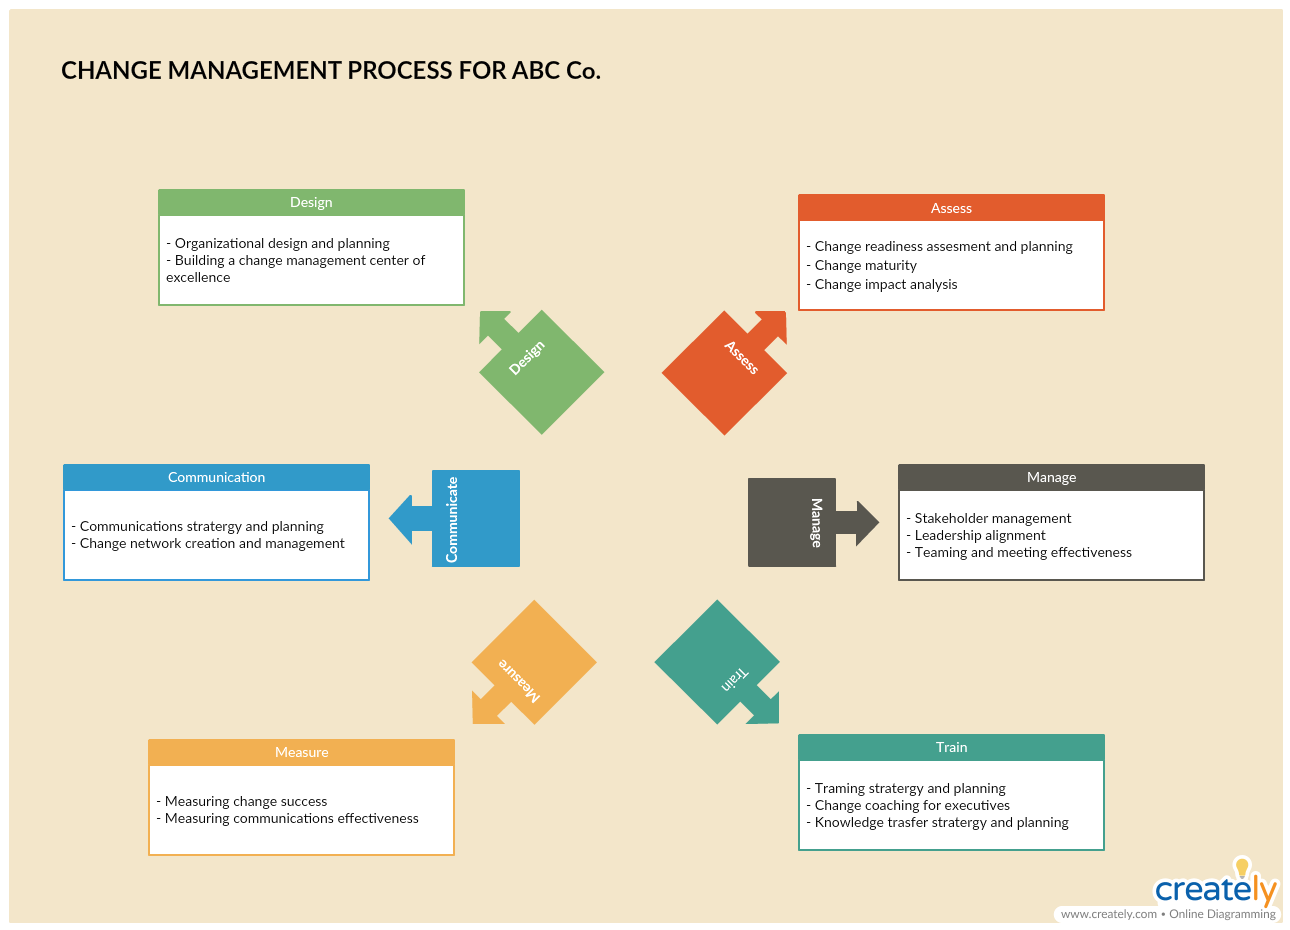
Change Management Process Template (Click on image to edit online)

Flowcharts/ Process Maps

What is it

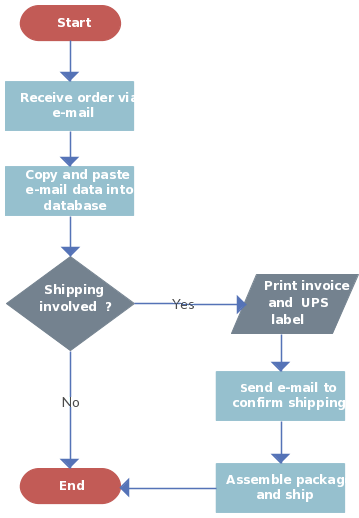
Flowcharts and process maps are great ways to visualize the various processes in the organization for the benefit of everyone, including those who are not directly involved in carrying them out. In the readiness assessment or the preparation stage of the change management cycle, flowcharts can help you map out the current state of organizational processes.

Any change that will be discussed and implemented can be added to the flowchart, in which way it can be preserved for future reference.

How to use it

In our handy tutorials, we discuss how to draw flowcharts and process maps in detail including everything else you need to know about the two diagram types. Do check them out below for further reference.

Ultimate Flowchart Guide

The Easy Guide to Process Mapping

With the Creately Viewer, you can link your current-state flowchart/ process map and the future-state flowchart/ process map, so anyone who refers to it can quickly see the changes between the two.

ADKAR Analysis

What is it

The ADKAR model in change management is used as a coaching tool to make sure that the people or employees involved in the process support and believe in the change. ADKAR stands for,

Awareness

Desire

Knowledge

Ability

Reinforcement

How to use it

The ADKAR model presents a set of goals that team leaders should try to achieve, and being able to do so is the key to earning the support of the employees to successfully implement the change strategy.

Step 1: Spread awareness

Clearly communicate to the employees what change is occurring and why.

Step 2: Inspire desire

Build desire in your employees to support the change so they would do their part naturally rather than forcing them to do so.

Step 3: Impart knowledge

Make sure to help employees learn how to support the change through training programs, job aids, tutorials, coaching programs and checklists provided by the company.

Step 4: Improve ability

Help employees further improve their ability through feedback and evaluations.

Step 5: Reinforce the changes

Make sure that employees don’t go back to their old ways. In order to reinforce the changes, give incentives and rewards to employees.

ADKAR Analysis Template

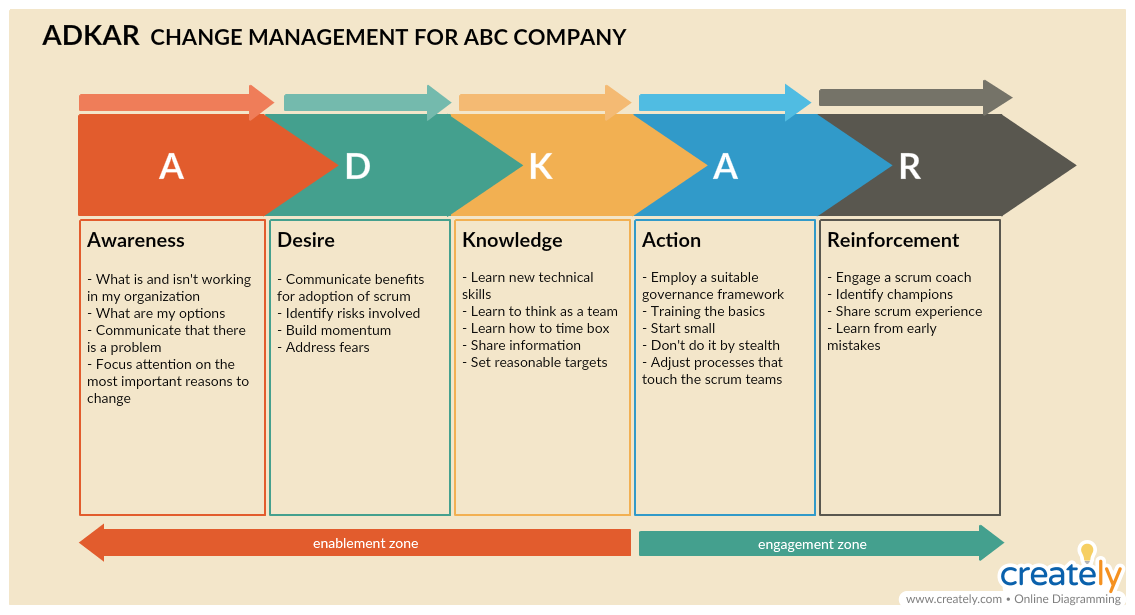
ADKAR Analysis Template (Click on image to edit online)

Culture Mapping

What is it

A culture map is a tool that is used to visualize the company culture, which is influenced by values, norms, employee behavior etc. It helps you discover information that is crucial to your change initiative, such as who are the positive enablers and how you can minimize risks during a project.

How to use it

Step 1: Identify the subcultures

Identify the groups that belong to the different subcultures in your organization. These could be IT, finance, marketing, sales, etc teams in your organization. Identify 5-6 people that can best represent these subcultures.

Step 2: Carry out interviews

Interview each group to know the cultural blockers and enablers reinforced intentionally or unintentionally by the management.

Step 3; Organize the information

Organize the information such as the behaviors, enablers, blockers, current and desired outcomes etc. in a cultural map like the one below for quick analysis.

Cultural Map Template

Cultural Map Template (Click on the template to edit online)

Force Field Analysis

What is it

Force field analysis, also known as a barrier and aids analysis, is a useful decision-making tool. It helps you identify and analyze forces for and against change or the implementation of a proposed solution.

How to use it

Step 1: Define your plan for change

What is your goal for the change?

Step 2: Brainstorm forces for change

What are the forces you can think of that would help you move forward with your plans? Remember to look at factors in both the internal and external environment.

Step 3: Brainstorm forces against change

What are the forces that are blocking you from implementing the changes? Fill out these sections for the analysis using the template below.

Force Field Analysis Template

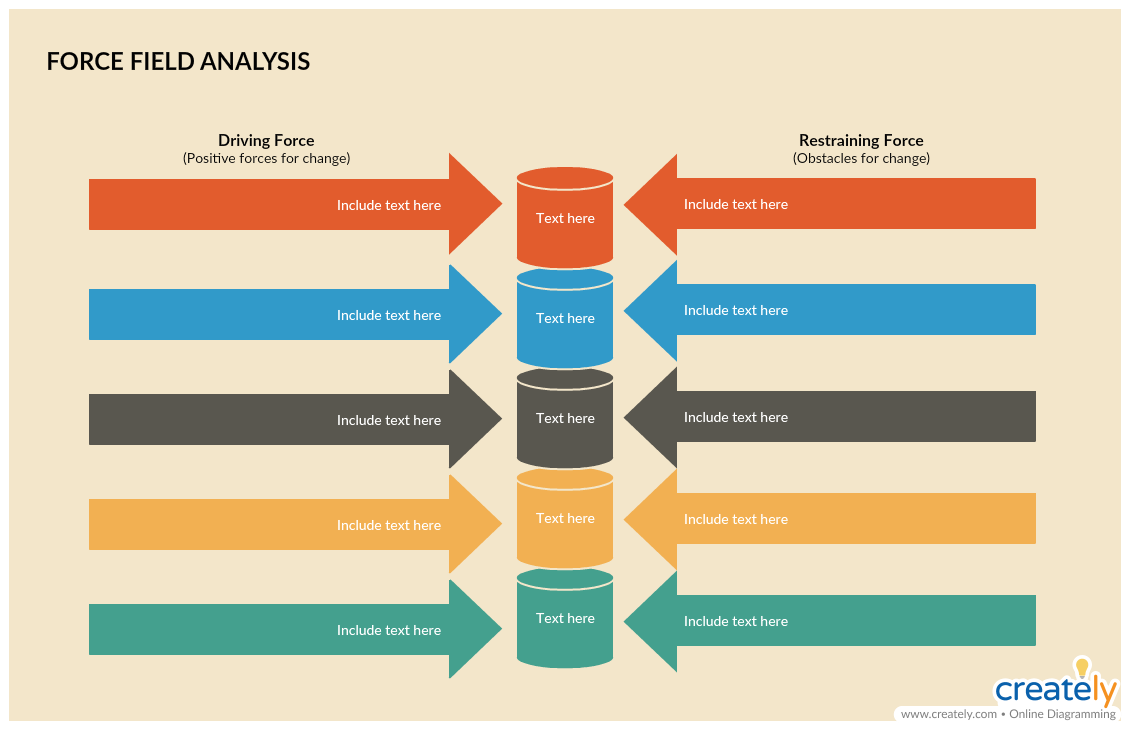
Force Field Analysis Template (Click on the template to edit online)

Stakeholder Analysis

What is it

In the stakeholder analysis, you identify stakeholders and categorize them based on different factors such as geography, income groups, occupation, legal requirements etc.

At the end of the analysis, you’ll have found out who your project’s stakeholders are and why the project is important to them.

How to use it

Step 1: Identify the stakeholders

Think of all the people who might be affected by your project. Remember to consider those who come from outside of your company as well.

Step 2: Prioritize the stakeholders

Your list of stakeholders may include people who may be affected by and care about your project and, who may be unaffected by and be not that interested in your project.

Using a Power/interest grid for stakeholder analysis like the one below, you can prioritize your stakeholders based on their stake in the project and their engagement.

Stakeholder Analysis Template

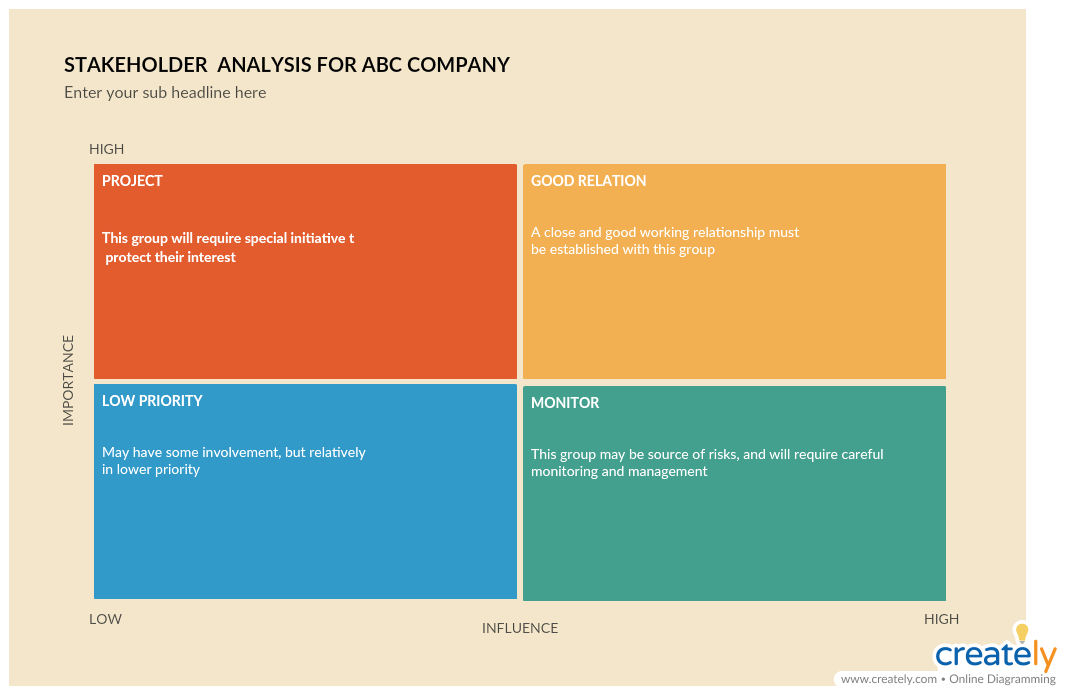
Stakeholder Analysis Template (Click on the template to edit online)

Step 3: Stakeholder map

Now that you have prioritized your stakeholders, you can use a stakeholder map to easily categorize them.

Stakeholder map template

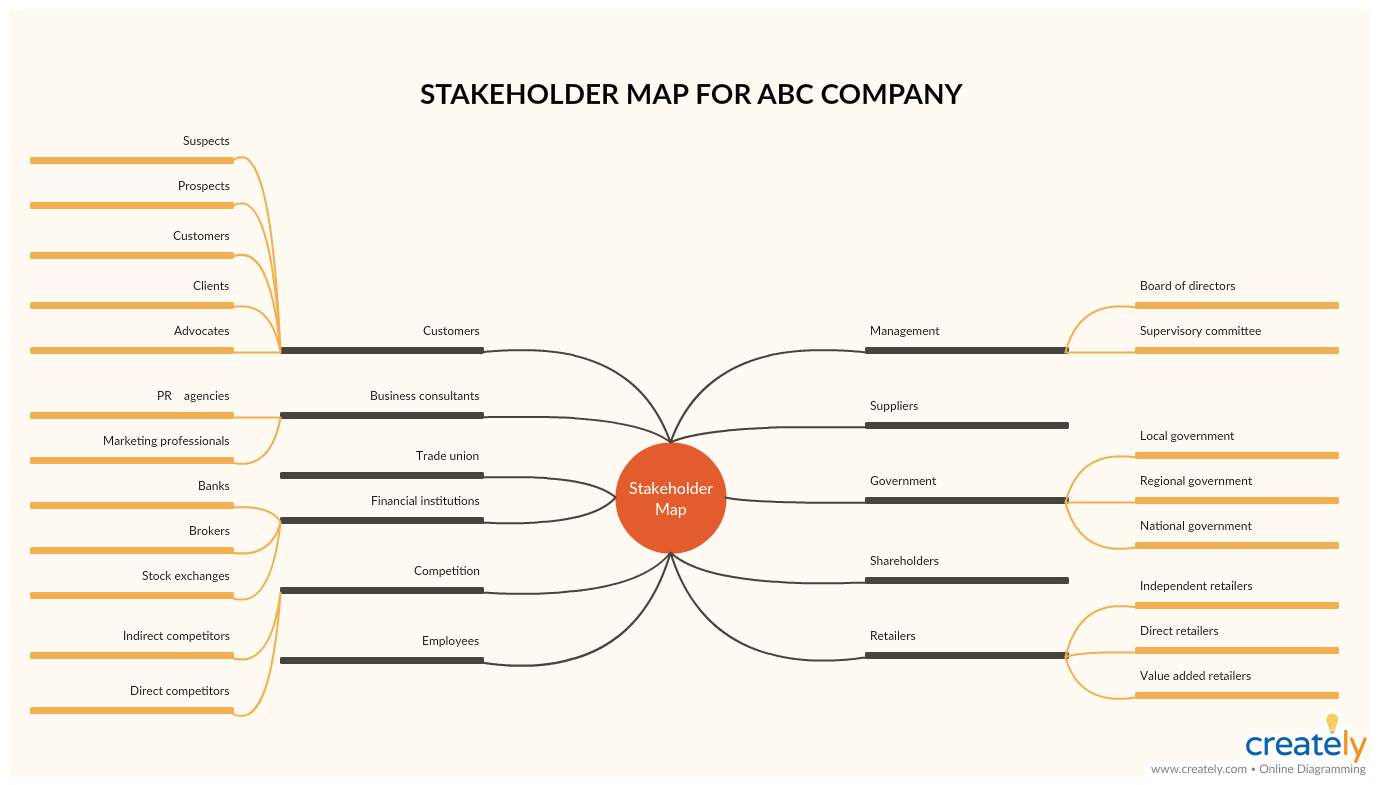
Stakeholder Map Template (Click on the template to edit online)

Kotter’s 8 Step Change Model

What is it and How to Use It

Kotter’s change model is an 8-step method to manage change. These steps include,

Step1: Create a sense of urgency

If everyone really wants the change to happen, it is much easier to implement it. Creating a sense of urgency among everyone will help spark that motivation in them to embrace the change that you are about to bring about.

You can use a SWOT analysis to emphasize the threats and opportunities that lurk in the marketplace or the industry. Additionally, you can also use a threat vs. opportunity matrix to show how your company stakeholders will be affected by the change or lack thereof.

Threats and Opportunity Matrix Template

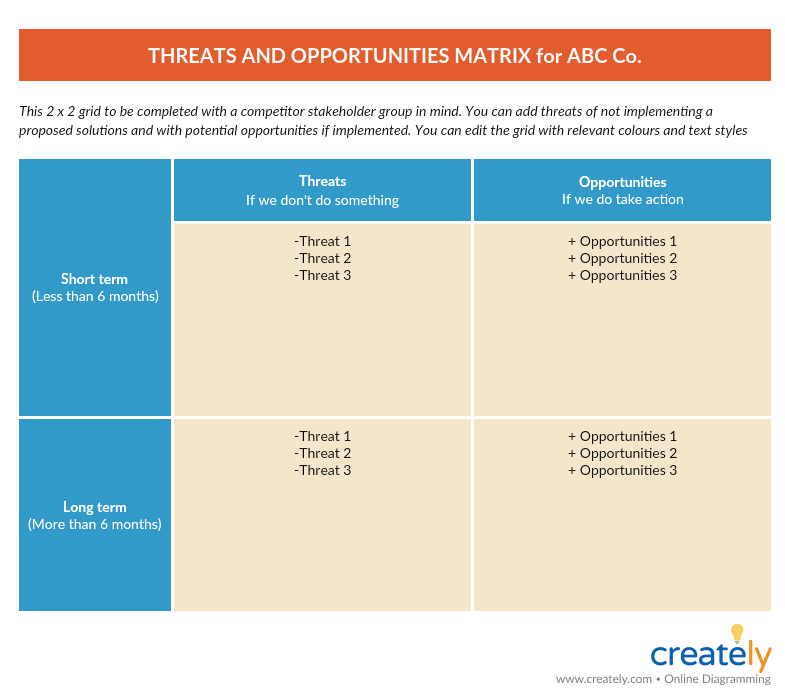
Threats and Opportunity Matrix Template (Click on template to edit online)

Step 2: Build a guiding coalition

Build a strong team made up of influential people from all statuses and expertise and who can convince others that change is necessary.

Step 3: Form a strategic vision and initiatives

Create a clear vision as to why change is necessary or as to why you are asking your employees to do something. Determine the values that are linked to the change and create a strategy to get to your vision.

Step 4: Clearly communicate the said vision

Communicate your vision frequently so that it will be embedded within everything your team does. Not only during special meetings but every chance you get, try to remind the vision to your team.

Step 5: Enable action by removing any obstacles

Identify barriers that are blocking the implementation of change. Help those who are resisting change see what’s needed. Reward people to support change.

Step 6: Generate short-term wins

If your staff can see short-term wins that will motivate them. Create short-term targets so you can celebrate quick wins.

Step 7: Build on the change

If something worked, identify what went right and improve it. Set goals and continue to work on it, building momentum.

Step 8: Make it part of the culture

Make sure that any change you gain, you make it part of your culture.

Kotters 8 Step Change Model

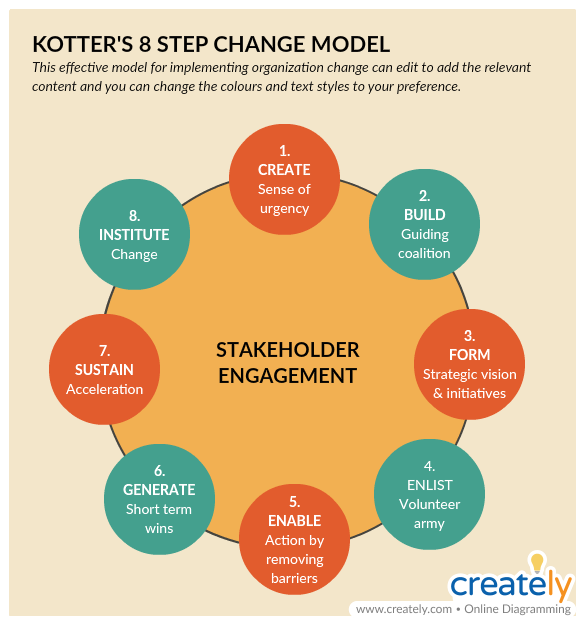
Kotter’s 8-Step Change Model (Click on template to edit online)

Lewin’s Change Model

What is it and how to apply it

According to Kurt Lewin’s change model, successful change is achieved through a 3-step process;

  • Unfreezing

This is the stage of preparation. Before any change can be implemented, you need to spread awareness as to why it is necessary. Everything from processes to organizational structures should be examined and shown to the employees at this stage. The more they are aware, the more they’ll be urged to welcome the change.

  • Changing

This is the stage where real change occurs. Employees will learn new behaviors, processes, and ways of thinking during this time.

  • Refreezing

It’s time to solidify the new behavior, processes, goals etc. You must make sure that the change implemented is not lost and is incorporated into the culture of your organization.

Lewins Change Model Template

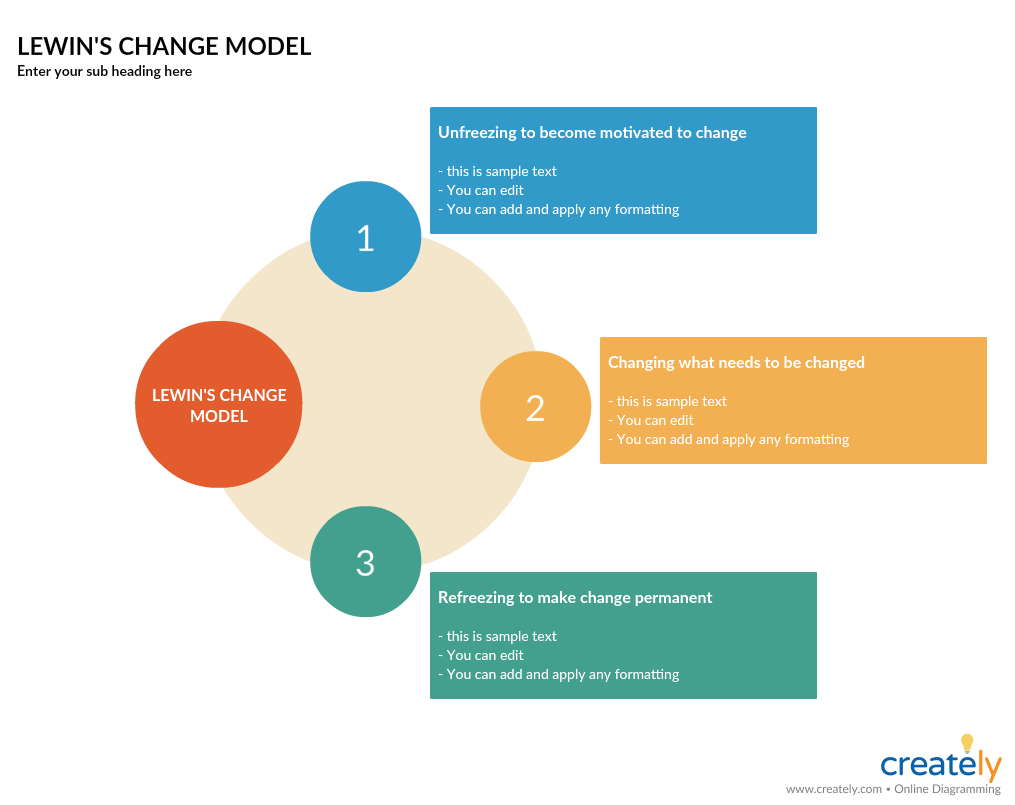
Lewin’s Change Model Template (Click on template to edit online)
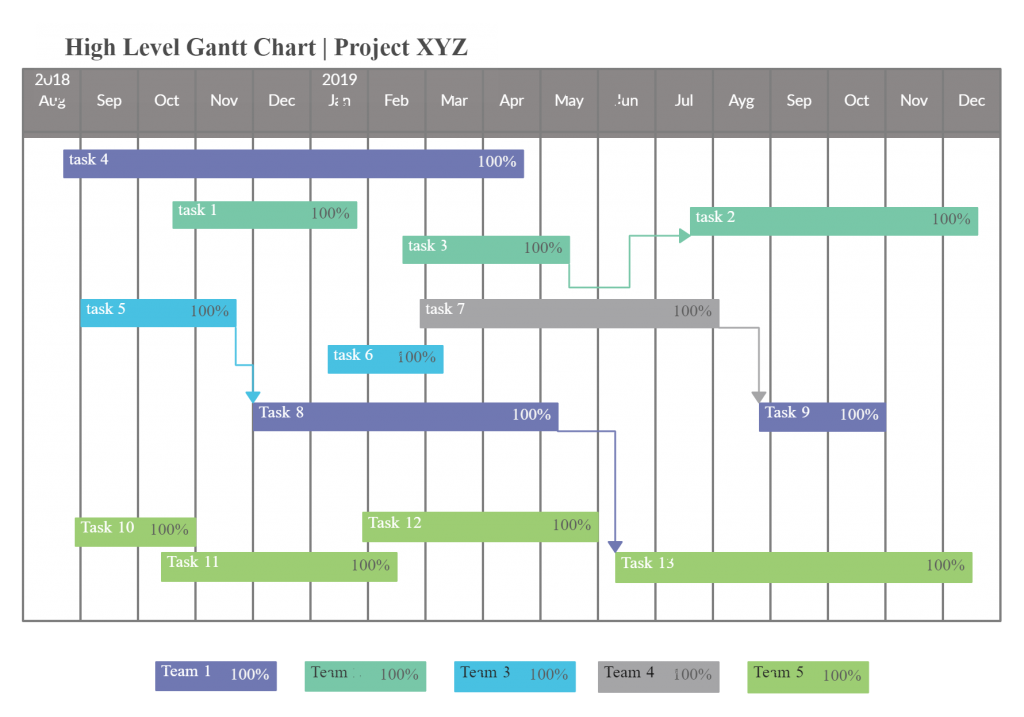
Gantt Chart

What is it

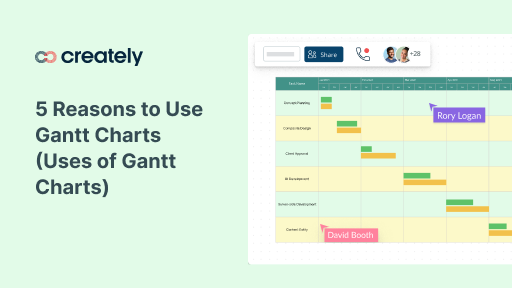
Any change management project includes a large number of tasks, and to complete them successfully you must make sure that they are completed on schedule. Gantt charts are a useful tool to visualize and track the tasks scheduled over a period of time.

How to use it

We’ve covered how to use Gantt charts to plan a project in a few easy steps in this guide. Do check it out for further reference.

Gantt Chart for Change Management

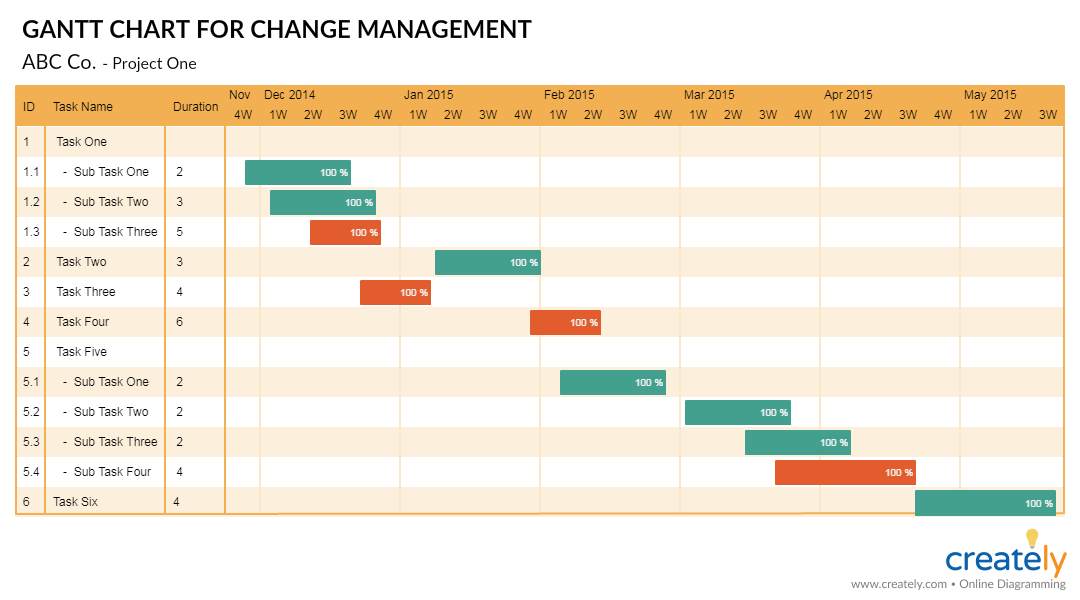
Gantt Chart Template (Click on template to edit online)

What Are Your Favorite Change Management Tools?

In this list, we’ve covered a list of tools that you can use during each stage of the change management process. What other change management tools do you use for your project initiatives? Let us know in the comment section below.

And don’t forget to check out our Ultimate list of marketing strategy tools that will help you narrow in on the most important decisions in a coherent manner so that your resulting marketing plan is effective.

Gantt Charts Made Quicker and Easier with Upgraded Creately
Easily switching between days and weeks in a Gantt chart

Gantt charts are a popular tool for the simple reason that they allow easy forecasting and tracking of project schedules with just a straightforward diagram.

This effectively provides management with key information to help improve productivity, while also improving communication of project goals and tasks with team members to build a cohesive environment.

While you don’t need us to preach on about the benefits of using a Gantt chart for scheduling, we do have something exciting to share that you definitely would want to hear!

The simple to use, but yet powerful revamped Creately minimizes time and effort spent on creating Gantt charts!

While project management and drawing software such as Ms Project and Adobe Illustrator can be used for the creation of Gantt charts, there are several limitations. Who’s got the time to spend hours drawing, resizing and filling in all those details when all you require is an uncomplicated visual?

Backed by a nifty array of new features, Creately simplifies the drawing of a detailed Gantt chart from hours to minutes. So, how does Creately make this possible?

User Friendly Timeline Format

Creately is all about drawing faster, easier and prettier Gantt charts! From the quick addition of objects in a familiar drag and drop environment to just increasing the length of the timeline for the dates to be adjusted, Creately simplifies tedious tasks.

Let’s not forget the fresh and spacious interface which allows you to maximize your screen space when drawing, rather than being besieged by menus.

Gantt charts make quicker with automation

With Creately adjusting your timelines a breeze

You don’t need to be a techie to wrap your head around this, hell if you’ve never created a Gantt chart before, Creately’s unique, user friendly environment is the perfect place to start!

Choose Your Diagram Style

With a plethora of templates available to help you get started, you can pick between different diagram styles to suit your unique requirement. For instance, choose between a timeline that has a description below each task for easy readability, or a standard Gantt chart.

Easily switching between days and weeks in a Gantt chart

Switching between days and weeks couldn’t get any easier

Once you’ve placed a container on the timeline, you can customize it by adding month, week or day tasks and editing the properties, it’s really that simple!
Easy Customization

The beauty of Creately is the no-nonsense customization it offers! Apart from the automatic date changes mentioned earlier, duration labels are updated by just resizing week, day or month bars.

We didn’t just stop there, you can choose from a plethora of styles and colors with a few clicks of your mouse to customize your drawing too.

Fast Track Exporting

When drawing a Gantt chart you will require input from different team members in order for it to be an effective and accurate representation of the project schedule.

Creately allows online collaboration with easy sharing, so edits can be made simultaneously on a work in progress drawing either from across the hall or from the other side of the world.

One of the great strengths of using Creately, is the range of different formats that you can export your drawings in. These can be easily embedded into a presentation or document using the Creately diagram viewer with great graphical quality and clarity.

If you’ve never played with Creately before, sign up for a demo account and give it a go – we’re sure you’ll be raving too!

Using Gantt Charts and Flowcharts in Project Planning
Flowcharts-in-Project-Planning

Flowcharts and Gantt charts are both effective tools to plan projects. However, when it comes to project execution, both have different uses and applications. For a complex plan with a longer duration, a Gantt chart is better, and for short term and smaller projects, a flow chart can do the trick on its own. In some cases, Gantt charts and flowcharts are used in combination. Both types of charts can be easily made using Creately’s online flow charting tools and Gantt tools.

Using Flowcharts for Project Planning

Flowcharts can be used to display a stage by stage progression. They effectively show a sequence of events, with the completion of one stage leading to the beginning of another. The only downside of using a flowchart for project planning is that you cannot add a time interval for each stage. Flowcharts of a project plan must show:

  1. A clear beginning
  2. Clearly labeled stages represented by rectangular boxes
  3. Diamond shaped boxes for decisions/quality checks
  4. A clearly defined end

The arrows show the direction of flow. In case of a decision, the yes and no arrows must clearly indicate how to tackle different possible outcomes. Using Creatley’s flowchart designing tool, a simple flowchart for a small project can easily be made.

Order processing with shipping flowchart (Project Flowchart)

A small project quickly described using a flowchart (Project Flowchart)

As can be seen from the diagram, a flowchart gives a nice visual representation of different stages of the project but misses out on one of the most important elements of project planning, i.e. time. For a project to be planned and managed efficiently, it has to be timed and each stage has to be performed within a deadline.

When working on smaller projects, ones that can be completed within a day or two, a flowchart is enough. However, when working on larger projects, it is better to outline processes using a flowchart before using a Gantt chart to get into details.

Using Gantt Charts for Project Planning

We have featured a number of posts about this topic in the past, so we will keep this section brief. The biggest advantage of using Gantt charts for project planning is that they allow the manager to determine a time duration for each activity. Gantt charts allow for the effective display of task dependencies, information flows, and relationships between different activities. They do not put any emphasis on the logic controlling the decision making. Creatley’s Gantt chart designing tool can be used to make charts for simple and complex projects.

A Gantt chart is an excellent way to track time and tasks

A Gantt chart template available at Creately ( click to use as a template )

Use Gantt Charts for High Level Plans

Gantt charts are perfect for high-level plans and complex planning. Suppose you have a complex project to plan and the project spans over several weeks. Your first step should be to draw a mind map and come up with as many tasks and subtasks related to the project as possible. You should then identify the main tasks and draw a flowchart using Creatley’s flowchart designing tool.

After designing a flowchart, you should be able to see all the essential task presented in front of you clearly. Now to create a Gantt chart, you need to know the exact duration that each task should take. You should calculate your deadlines in mind, allocate resources accordingly, and assign each essential task with a time frame. List the tasks and their time frame in a table:

Task Duration
Task A 3 Weeks
Task B 2 Weeks
Task C 3 Weeks
Task D 4 Weeks

Once you have determined the duration for essential tasks, you can identify their relationships, see if they can function independently, and add to the table:

Task Duration Dependent Upon
Task A 3 Weeks
Task B 2 Weeks A
Task C 3 Weeks B
Task D 4 Weeks C

Furthermore, you can identify if the tasks can be performed parallel to others or if they are sequential. In the example we have used each task so far is dependent on the preceding task and cannot be accomplished simultaneously with other tasks.

In a complex project, there will most likely be an opportunity to run several tasks at once. You will just have to identify which tasks can be run independently and will have to keep checking the new tasks that become available after the completion of each task.

After identifying the tasks, drawing a flow chart, identifying the different types of tasks and their inter-relationship, you can easily construct a Gantt chart for a complex project.

If you are about to start a complex project and are looking to draw flowcharts and Gantt charts to make project planning and management easier, try Creately’s diagram software. Use the flow chart to look at the bigger picture, and then use the Gantt chart to get into details. Get started faster with our professionally drawn gantt chart templates and for more information, contact us at support

5 Reasons to Use Gantt Charts (Uses of Gantt Charts)
plan projects better with gantt charts

As there are many uses of Gantt charts, thousands of companies use Gantt charts to become more productive, enhance their communications, forecast over the long term and track results. While some naysayers believe they limit the size of the project that can be tracked, those using Gantt charts note an array of key benefits, including the five listed here.

Gantt Chart Advantages

While there are a number of reasons to use Gantt charts below are five key reasons they are often advantageous:

  1. Avoid Completion Confusion: Gantt charts were created to keep users on track, providing a visual timeline for starting and finishing specific tasks. By providing a visual overview of milestones and other key dates, these charts are thought to offer a more understandable and memorable method of maintaining timescale-based tasks and deliverables whether tracked on a daily, weekly, monthly or yearly basis. Below diagram shows the power of visualization found in Gantt charts. In a glance you can see that the interviews are done, there 50% more to do in training etc.

    Use Gantt charts to keep track of tasks and key dates

    A Gantt chart template available at Creately ( click to use as a template )

  2. Keep Everyone on the Same Page: Where there is a visual framework for the work to be done, there are fewer chances for misunderstanding, especially when it comes to highly complex tasks. Using Gantt charts allow all types of stakeholders to have the same information, set mutually understood expectations, and conduct their efforts according to the desired protocol.
  3. Understand Task Relationships: These charts can make clear how various tasks are interrelated and perhaps rely on the completion of another to meet specific objectives. These task relationships revolve around understanding the timing of each task, which then impacts other tasks listed. This can better assure the optimum work flow, maximized productivity and overall project success.

    A Gantt chart helps you easily visualize related tasks

    A Gantt charts makes it very easy to visualize related tasks

  4. Effectively Allocate Resources: By being able to look ahead on the Gantt chart, users can clearly discern where resources need to be anticipated, allocated or shared to maximize the use of those resources. The more closely the chart is followed, the better chance there is of keeping project costs within budget while also better assuring on-time completion.
  5. Get a Handle on the Future: While it is often easy to get caught up in day-to-day tasks as detailed on a chart, Gantt chart advantages include helping decision-makers look farther ahead to ensure each given project is working toward the achievement the organization’s long-term strategic objectives.

Create a Gantt Chart now !! We’ve made it easy for you >>

What about Gantt Chart Limitations?

For those Gantt chart cynics mentioned earlier, this method is not designed to be the cure-all for an organization’s project management ills. There are some situations where other tools may indeed be more effective – particularly in scenarios when a particular milestone or critical task is missing because the project manager didn’t include. Other limitations include the inability to include certain constraints like time, scope, and costs. Overall, however, Gantt chart advantages have been realized by all types of organizations for applicable applications.

Use Gantt Charts More Effectively Using Creately

One reason people are reluctant to use Gantt charts is that of the lack of drawing tools. They usually come packaged with expensive project management tools which are not suitable for simple Gantt charts. Creately makes it very easy to draw Gantt charts by providing you Gantt chart templates and simple drag and drop interface to draw Gantt charts.Detailing a project schedule or a sequence of events timeline is made easier than ever before with this intuitive and feature-rich Web-based software that facilitates chart creation, collaboration and completion in short order. Check out Creately Gantt charts.

Sources:

New Confluence Release and Recent Creately Features
Creately Confluence Plugin

Creately Confluence Plugin Compatible with Confluence 4

A quick update! we released a new version of Creately Confluence plugin. It is now compatible with Confluence 4 and also includes the below features and more

  • Easy migration from Confluence 3 to 4
  • Compatibility fixed for Confluence version 3 and 4
  • Diagram preview in edit mode ( Confluence 4 )
  • Quick add/edit diagrams in edit mode ( Confluence 4 )
  • Automatic diagram type suggestion
Creately Confluence Plugin

Add/Edit Diagrams Easily in Confluence using Creately

Drawing Gantt Charts in Confluence

Many understand the importance of Gantt charts but few bother drawing them. Its even harder in Confluence because of the lack of tools.  Now you can easily create Gantt charts in Confluence using our Gantt chart tool. Its simple to use and we added some templates to make it even more easier. Below are two of the many templates available for users.


Gantt Chart of a Research Project

Creately Gantt Chart Template

Project Phase Gantt Chart Template

Creately Gantt Chart Template

Enjoy the new templates and have fun drawing Gantt charts in Confluence. If you have any suggestions about Gantt charts or anything in general feel free to contact support with your suggestions. The flowchart guide was very popular and thanks for the feedback. We will surely publish more guides in the future. Merry Christmas and Enjoy the Holidays.

Draw Gantt Charts Online Easily Using Creately
Colorful Gantt chart template

We are excited to announce our new Gantt Chart Objects! It’s really simple and easy to draw Gantt charts or come up with a quick time line for planning things.
Most times you simply need to explain your thinking about a project schedule, a sequence of events with creating a Gantt chart or by make a timeline, you end up having to use a tool like Microsoft Project or draw it manually using a drawing software. We have gotten rid of that complexity and have added some nifty features to make it faster and easier to draw Gantt charts, so you can have fun while planning your projects. Below are some templates created using our tools ( click to open in new window )

Gantt Chart Template CreatelyColorful Gantt chart templateGantt Chart for a Business Plan template

Below are some of the new Gantt chart features

1/ Quickly Draw Graphs with Drag and Drop Elements

Gantt Specific objects like Gantt Container, Timeline to quickly start drawing diagrams. Just drag and drop the elements to the drawing area.

2/ Easily Add Columns and Rows

Double click on the Gantt Container and You will be taken to a text editor. Add a row by simply adding a line break and add a column by adding a comma

Draw Gantt charts easily with simple to use text editor

3/ Smart Objects that Adjust Automatically

Increasing the length of the object automatically increases the unit number, dragging tasks adjust the connectors etc

4/ One Click Create to Add Dependent Tasks

Create dependent tasks easily with connecting arrows automatically created for you

Easily add dependent tasks in the Gantt chart

5/ Show Completed Percentage Within Tasks

Easily track the progress of the task by showing completed percentage within the bar

Show Completed Percentages of the task in Gantt charts

6/ Timeline only Object for Simple Planning

Sometime people don’t want complicated graphs with columns and rows, and simple planning object is the tool to do exactly that.

The above new features combined with the already existing features of Creately makes it a great online tool to draw Gantt charts. Check out the below video to see how easy it is to create Gantt charts using Creately.

Have fun drawing Gantt charts and time lines with our tools and feel free to share your ideas and suggestions in the comments section.